

Positive sentiment around SNDK’s latest flash memory innovation drives Leverage Shares 2X Long SNDK Daily higher; stocks have been trading up by 13.21 percent.
Key Takeaways
- SNDG has dropped from the $11 area to the mid-$6s, showing a sharp sentiment shift in leveraged chip trading.
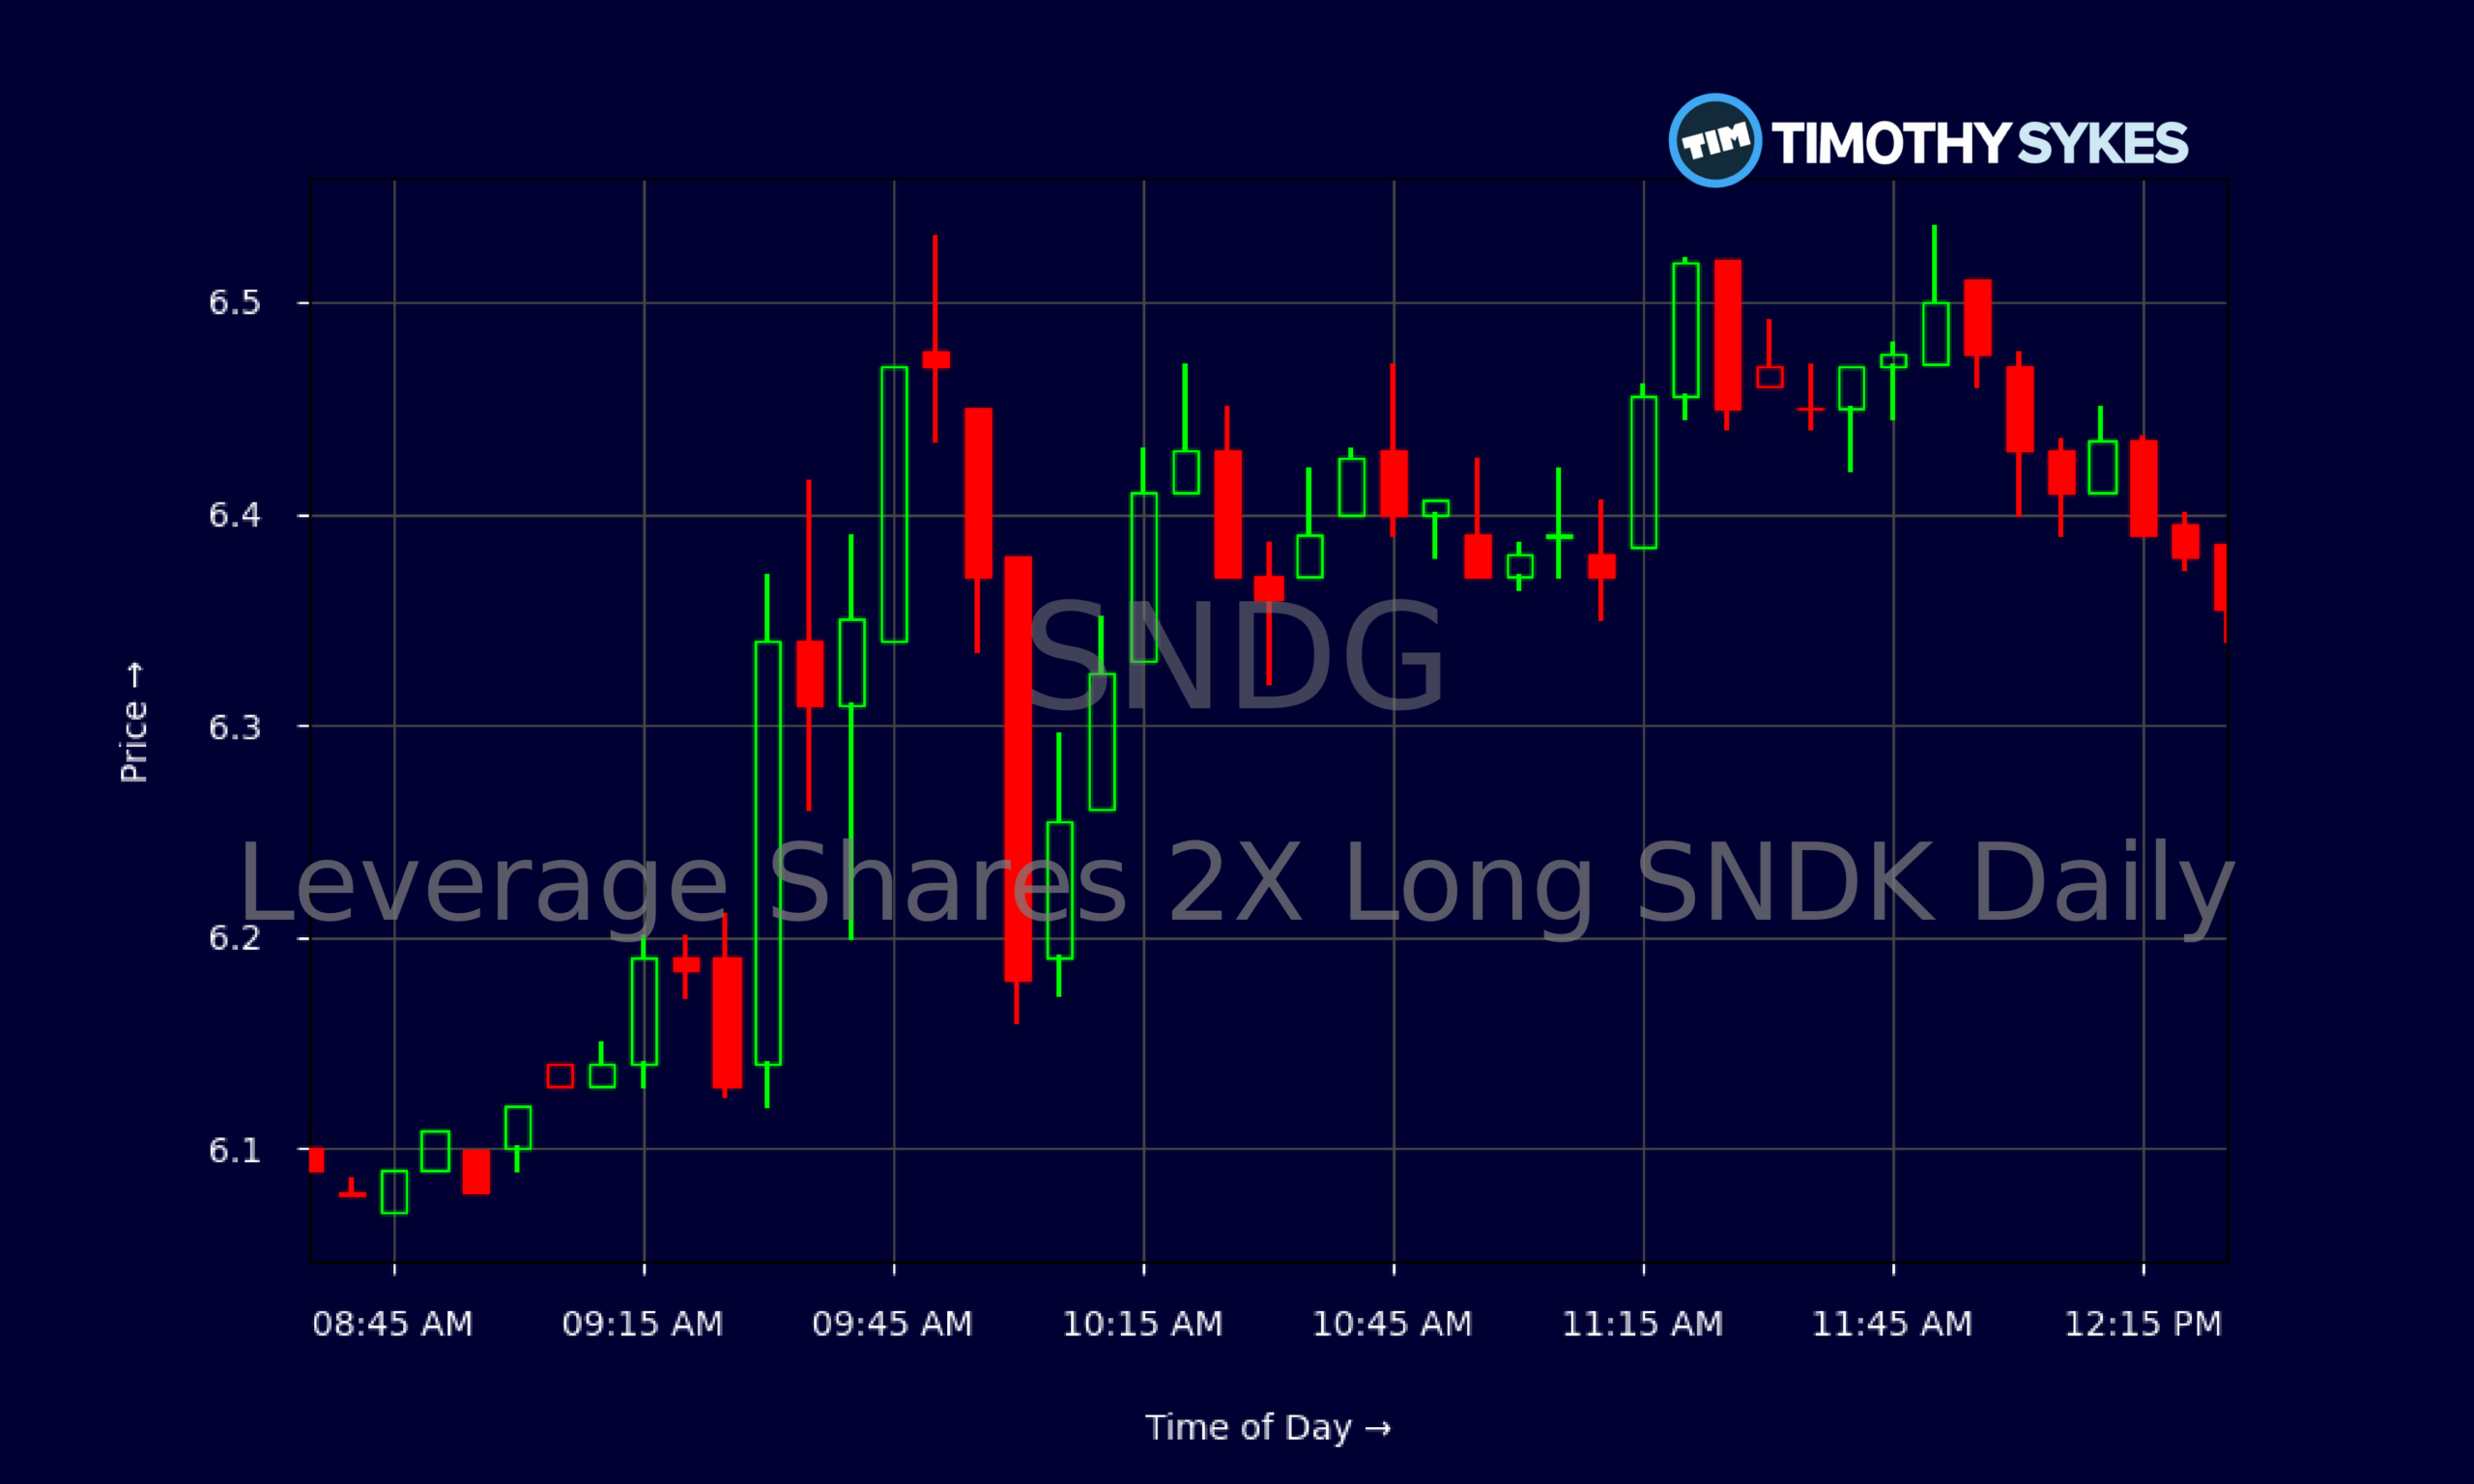
- Recent intraday action on SNDG shows tight consolidation between $6.30 and $6.50, signaling a short-term decision point.
- With no clear earnings or fundamentals, SNDG trades purely as a leveraged technical vehicle tied to Sandisk price action.
- Traders are watching whether SNDG can hold the $6 support zone after multiple red days and heavy downside momentum.
Live Update At 12:32:16 EDT: On Monday, October 19, 2026 Leverage Shares 2X Long SNDK Daily stock [BATS Global Markets: SNDG] is trending up by 13.21%! Discover the key drivers behind this movement as well as our expert analysis in the detailed breakdown below.
Quick Financial Overview
SNDG, the Leverage Shares 2X Long SNDK Daily product, is designed as a trading tool, not a traditional long-term holding. It gives traders 2x daily exposure to Sandisk price moves, which means SNDG magnifies both gains and losses. There are no classic fundamentals here — no earnings, revenue, or profit margins to study. SNDG is a pure price-action vehicle, and that is how active traders need to treat it.
The recent chart tells the story. At the end of 2026/09, SNDG closed around $10.86–$10.37. By 2026/10/02, it was near $10.08, then faded steadily. Over the next two weeks, SNDG slid into the $7s, then the $6s, closing at $6.34 most recently. That’s a steep drawdown of roughly 40% from late-September levels.
More Breaking News
Intraday, the 5-minute chart shows SNDG opening near $6.14, pushing briefly toward $6.53, then settling in a tight range around $6.34–$6.50. That intraday compression, after a multi-session selloff, often signals a battle between dip buyers and continued pressure from shorts and profit-takers.
Why Traders Are Watching SNDG Price Action
SNDG is all about speed and leverage. When Sandisk moves, SNDG tends to exaggerate the move, and that’s exactly what short-term traders want. Over the last several sessions, SNDG has gone from a high near $11.32 on 2026/09/25 down to the low $6s on 2026/10/19. That’s a massive range for anyone trading momentum, breakouts, or bounces.
On 2026/10/13, SNDG closed near $7.39 after hitting a high above $7.40. The next day, it traded up to $7.17 but closed around $6.595. The following sessions saw more selling pressure, with SNDG touching $9.73, then $8.78, then $8.46, before finally breaking into the $7s and $6s. Each lower high underscores a clear downtrend. For traders, that means every bounce so far has been a shorting opportunity, not a trend reversal.
Today’s intraday tape on SNDG is different. The stock opened around $6.14, dipped slightly, then ground higher into the mid-$6.40s and briefly above $6.50. From late morning through early afternoon, SNDG hovered between roughly $6.37 and $6.50 with smaller candles and wicks. That kind of consolidation after a big decline often becomes the staging area for the next move — either a relief bounce or another leg down.
Short-biased traders will stare at that $6.50 area as a possible risk level. Long-biased momentum traders will watch for a reclaim of prior intraday highs and volume to confirm a bounce. Either way, SNDG is setting up as a classic pattern: big trend down, tight base, clear levels.
Conclusion
For active traders, SNDG is a textbook reminder that leverage cuts both ways. The same 2x exposure that made SNDG interesting when it sat above $11 now makes the slide into the $6s especially brutal for anyone who overstayed or ignored risk rules. The daily chart shows lower highs and lower lows, while today’s intraday chart highlights a tight band of consolidation where the next directional push is likely to start.
The main edge in trading SNDG will not come from digging into balance sheets or income statements — they simply are not part of this product’s story. The edge comes from reading price, volume, and clear levels, then managing risk around those levels with discipline. This is where many traders either level up or blow up. As millionaire penny stock trader and teacher Tim Sykes, says, “It’s not about how much money you make; it’s about how much money you keep.” That mindset is exactly what separates traders who respect leverage and protect their capital from those who let a promising setup turn into a painful drawdown.
Tim Sykes always hammers the same core lesson: “Patterns repeat, but your discipline is what decides whether you profit from them or pay for them.” SNDG is offering a live case study in that principle right now. Traders who treat SNDG as a fast-moving tool — not a comfort blanket — and who cut losses quickly while respecting the leverage stand the best chance of turning this volatility into an educational and research-driven opportunity, rather than an expensive lesson.
This is stock news, not investment advice. Timothy Sykes News delivers real-time stock market news focused on key catalysts driving short-term price movements. Our content is tailored for active traders and investors seeking to capitalize on rapid price fluctuations, particularly in volatile sectors like penny stocks. Readers come to us for detailed coverage on earnings reports, mergers, FDA approvals, new contracts, and unusual trading volumes that can trigger significant short-term price action. Some users utilize our news to explain sudden stock movements, while others rely on it for diligent research into potential investment opportunities.
Dive deeper into the world of trading with Timothy Sykes, renowned for his expertise in penny stocks. Explore his top picks and discover the strategies that have propelled him to success with these articles:
- Penny Stocks Trading Guide
- Best Penny Stocks Under $1 to Buy Today
- Top 8 Penny Stocks to Watch on Robinhood
Once you’ve got some stocks on watch, elevate your trading game with StocksToTrade the ultimate platform for traders. With specialized tools for swing and day trading, StocksToTrade will guide you through the market’s twists and turns.
Dig into StocksToTrade’s watchlists here:





Leave a reply