

Leverage Shares 2X Long CBRS Daily ETF faces intensified selling pressure as key CBRS stocks have been trading down by -7.28 percent.
Key Takeaways
- Leverage Shares 2X Long CBRS Daily ETF (CBRG) has fallen from the $3.60 area to near $1.20 in under a month, showing aggressive downside momentum.
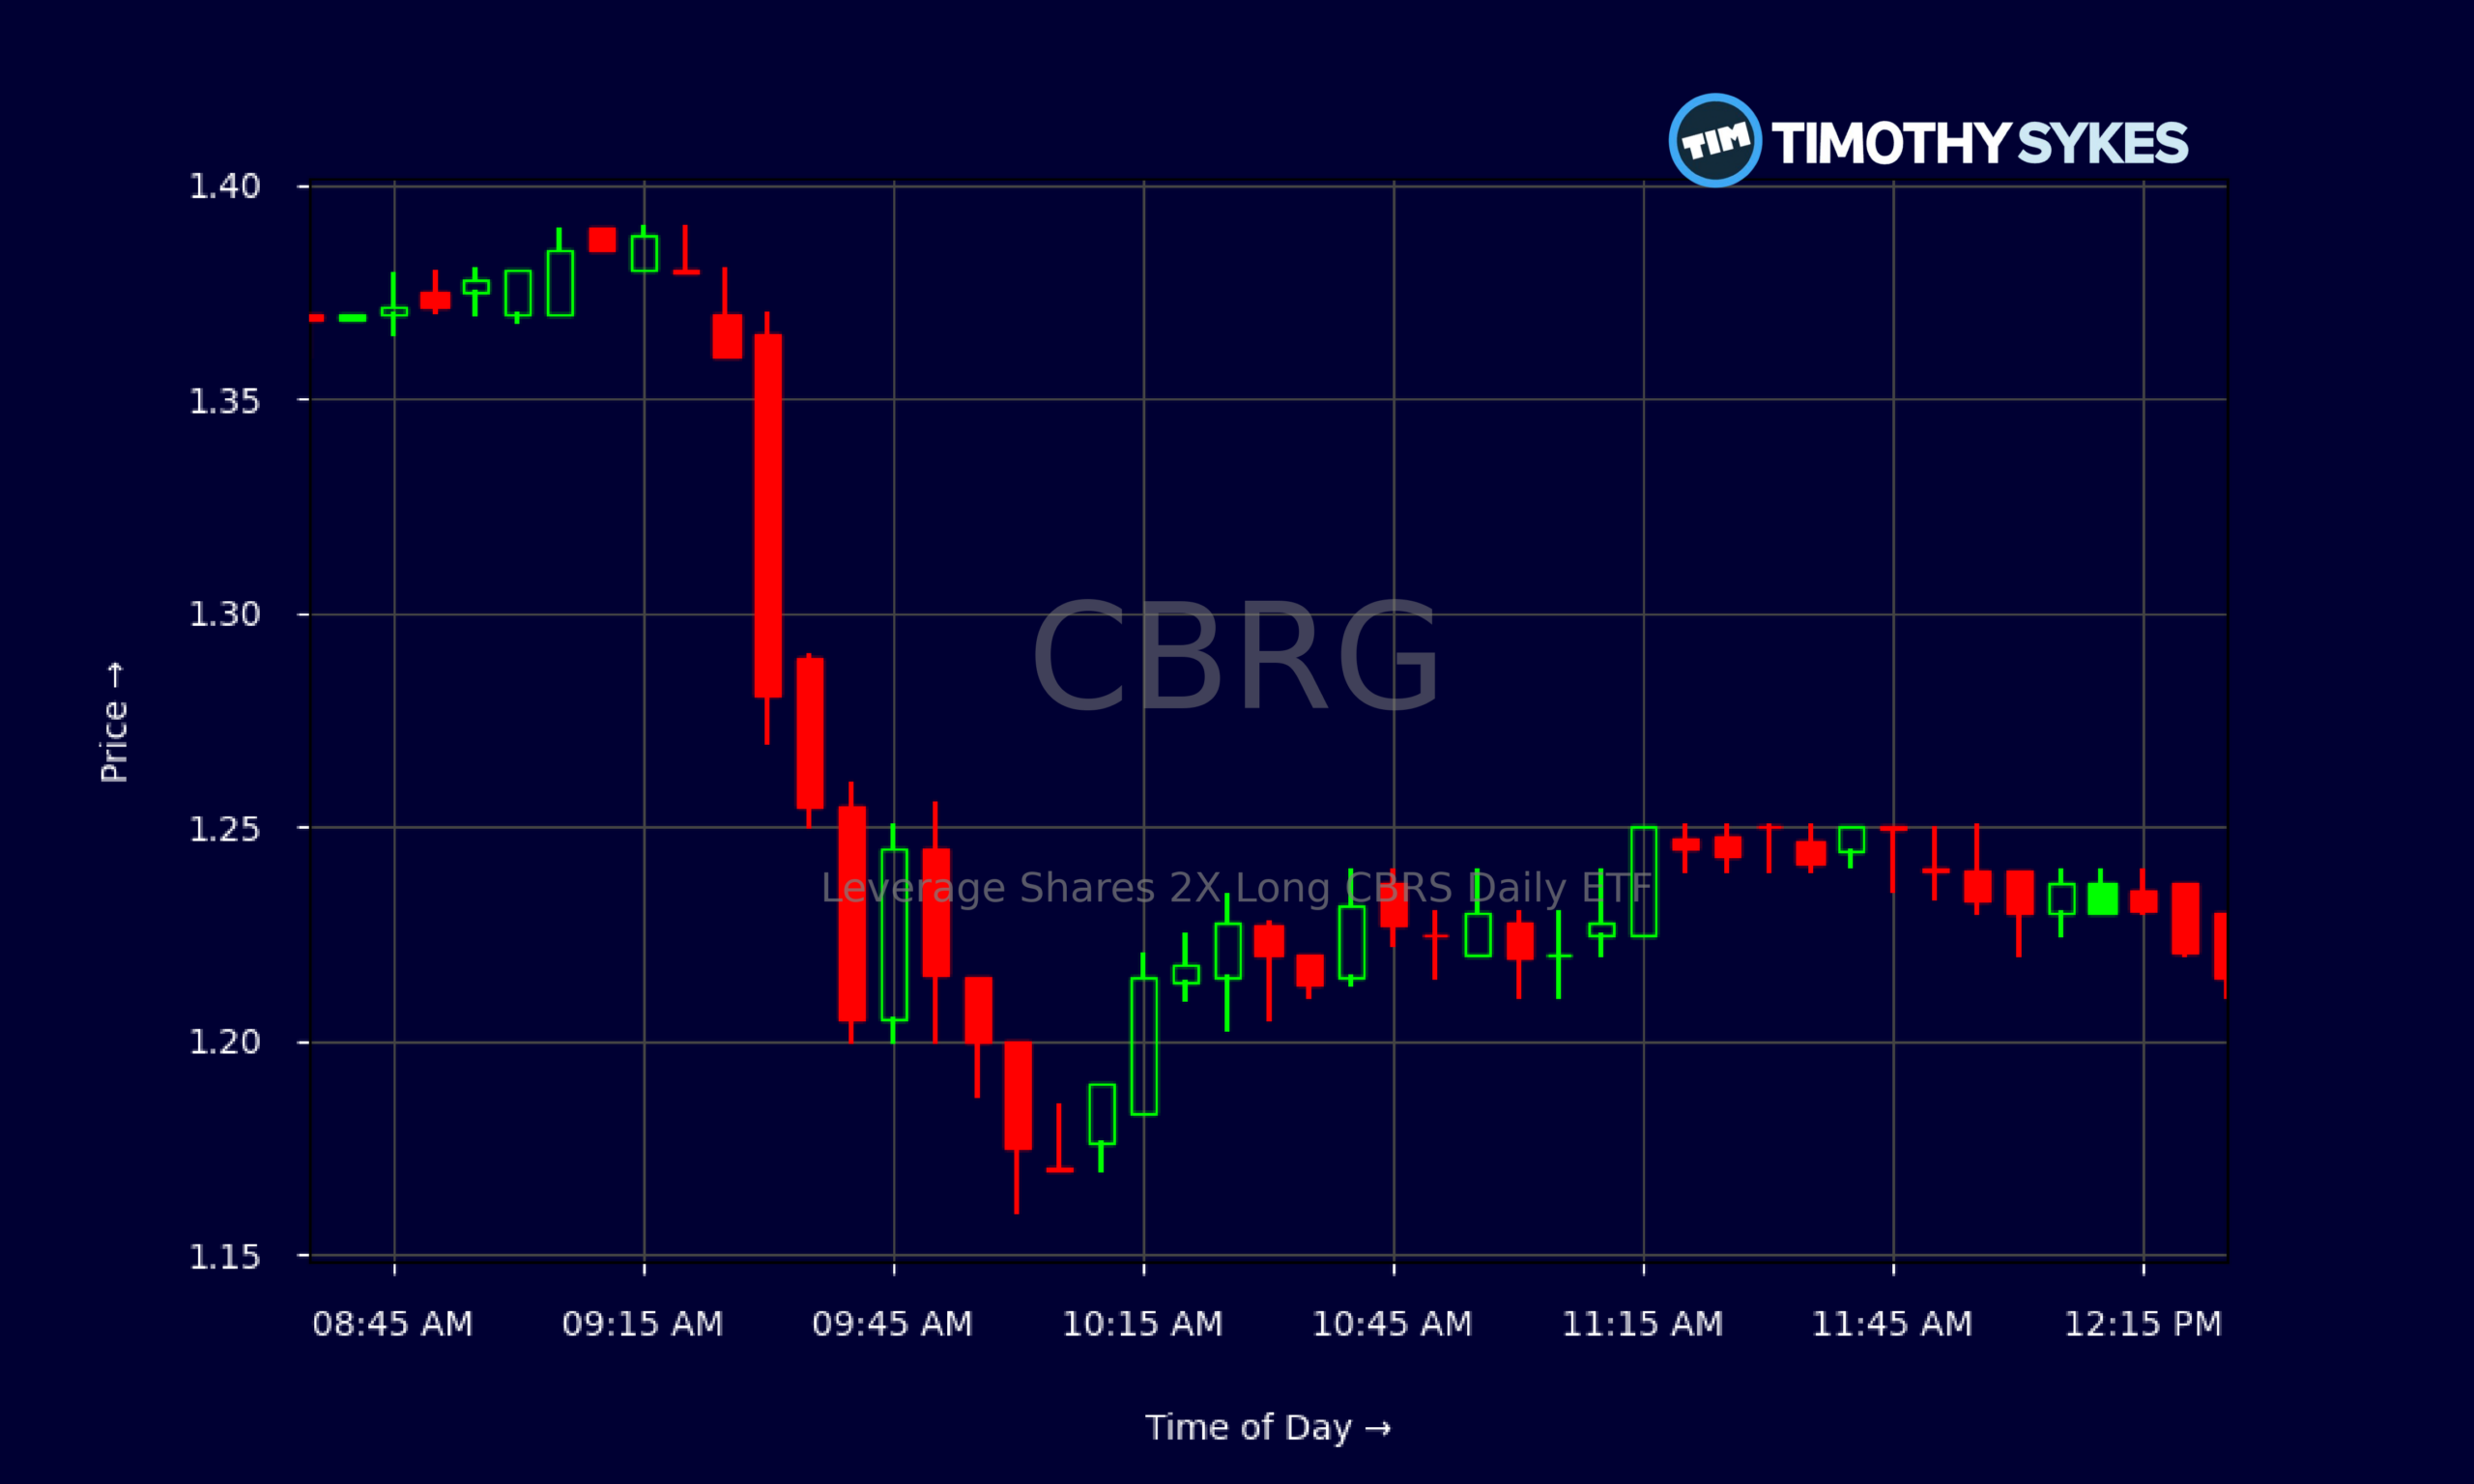
- Recent intraday trading in CBRG shows tight consolidation around $1.20–$1.25 after early morning weakness.
- The leveraged design of CBRG amplifies short-term moves, turning normal swings in the underlying into outsized gains or losses.
- With fundamentals not in focus, traders are leaning heavily on chart levels, volatility, and strict risk management in CBRG.
Live Update At 12:32:46 EDT: On Monday, October 19, 2026 Leverage Shares 2X Long CBRS Daily ETF stock [BATS Global Markets: CBRG] is trending down by -7.28%! Discover the key drivers behind this movement as well as our expert analysis in the detailed breakdown below.
Quick Financial Overview
CBRG, the Leverage Shares 2X Long CBRS Daily ETF, is built to magnify daily moves in its underlying exposure. That structure alone makes CBRG a pure trading vehicle, not a long‑term parking spot for cash. The daily chart tells the story clearly. In late September, CBRG traded near $3.60–$3.90. By 2026/10/19, it closed around $1.21. That is a deep drawdown in a short window.
From 2026/09/24 through 2026/10/02, CBRG chopped between roughly $2.30 and $3.90. Then the character changed. The ETF slid steadily from the mid‑$2s to the low $1s, with almost no bounce. That kind of trend shows strong selling pressure and likely forced exits by overleveraged traders.
More Breaking News
Key ratios and financial reports for CBRG are effectively blank, which is common for a leveraged ETF focused on tracking and amplifying daily price action rather than generating earnings or dividends. For traders, that means technicals, volatility, and liquidity matter more than traditional balance‑sheet analysis. Every CBRG entry is essentially a short‑term volatility bet.
Why Traders Are Watching CBRG Price Action
Traders are glued to the CBRG tape because this ETF is doing exactly what it is designed to do: swing hard. Leverage Shares 2X Long CBRS Daily ETF aims to deliver 2x the daily move of its underlying. When the base asset trends down, CBRG can bleed fast. When it reverses, CBRG can snap back just as quickly. That dynamic is what momentum traders hunt.
Look at the daily series. CBRG topped around $3.90 in late September, then started carving out lower highs and lower lows. The break from $2.70 on 2026/09/30 to $2.25 on 2026/10/09 marked a clear shift from choppy uptrend to controlled slide. The next leg down—from $2.36 on 2026/10/08 to $1.21 on 2026/10/19—confirms a full trend reversal. For traders who chase breakouts without a plan, that is a painful ride.
Zoom in to the intraday 5‑minute chart and you see a different story. Early in the session, CBRG dropped from $1.36 at the open to a low near $1.16 by 10:00. Then the ETF spent most of the day grinding between $1.20 and $1.25. That tight band, after a morning flush, often signals short‑term equilibrium. Aggressive shorts lock in profits; dip buyers test the waters.
For active traders, this is where CBRG gets interesting. A clean base around $1.20 offers clear risk levels. A break below the intraday low near $1.16 would show the downtrend still in full control. A push back through the $1.30–$1.35 zone might trigger a short squeeze and fast move toward prior resistance around $1.50–$1.70. CBRG rewards those who plan their trades and know exactly where they are wrong.
Conclusion
CBRG is not a quiet ETF you forget in a long‑term account. Leverage Shares 2X Long CBRS Daily ETF is a trading vehicle that lives and dies by volatility. Over the last few weeks, the daily chart has shifted from strong range action above $3.00 to a sharp unwinding into the low $1s. That is the kind of slide that wipes out undisciplined accounts but creates opportunity for prepared traders.
With no meaningful fundamental data to lean on, the edge in CBRG comes from reading price, volume, and levels. The recent intraday consolidation around $1.20 suggests traders are battling it out, with neither side fully in control after the latest sell‑off. Trend followers will watch to see if CBRG breaks to fresh lows. Counter‑trend players will look for a high‑volume reversal through intraday resistance.
Whichever camp you fall into, the rules are the same. Tight risk, clear levels, and no hesitation to cut. As millionaire penny stock trader and teacher Tim Sykes, says, “Consistency is key in trading; don’t let emotions dictate your trades.”. As Tim Sykes likes to remind traders, “Cut losses quickly, because big losses usually start out as small ones.” CBRG, with its 2x daily exposure, turns that warning into reality very fast. Use Leverage Shares 2X Long CBRS Daily ETF as a training ground for discipline, not a shortcut to riches. This analysis is for educational and research purposes only, and every trade in CBRG should start with a risk plan, not a profit target.
This is stock news, not investment advice. Timothy Sykes News delivers real-time stock market news focused on key catalysts driving short-term price movements. Our content is tailored for active traders and investors seeking to capitalize on rapid price fluctuations, particularly in volatile sectors like penny stocks. Readers come to us for detailed coverage on earnings reports, mergers, FDA approvals, new contracts, and unusual trading volumes that can trigger significant short-term price action. Some users utilize our news to explain sudden stock movements, while others rely on it for diligent research into potential investment opportunities.
Dive deeper into the world of trading with Timothy Sykes, renowned for his expertise in penny stocks. Explore his top picks and discover the strategies that have propelled him to success with these articles:
- Penny Stocks Trading Guide
- Best Penny Stocks Under $1 to Buy Today
- Top 8 Penny Stocks to Watch on Robinhood
Once you’ve got some stocks on watch, elevate your trading game with StocksToTrade the ultimate platform for traders. With specialized tools for swing and day trading, StocksToTrade will guide you through the market’s twists and turns.
Dig into StocksToTrade’s watchlists here:





Leave a reply