

ClearOne Inc. jumps on strong earnings and guidance upgrades, as stocks have been trading up by 52.6 percent.
Market Insights For Active Traders
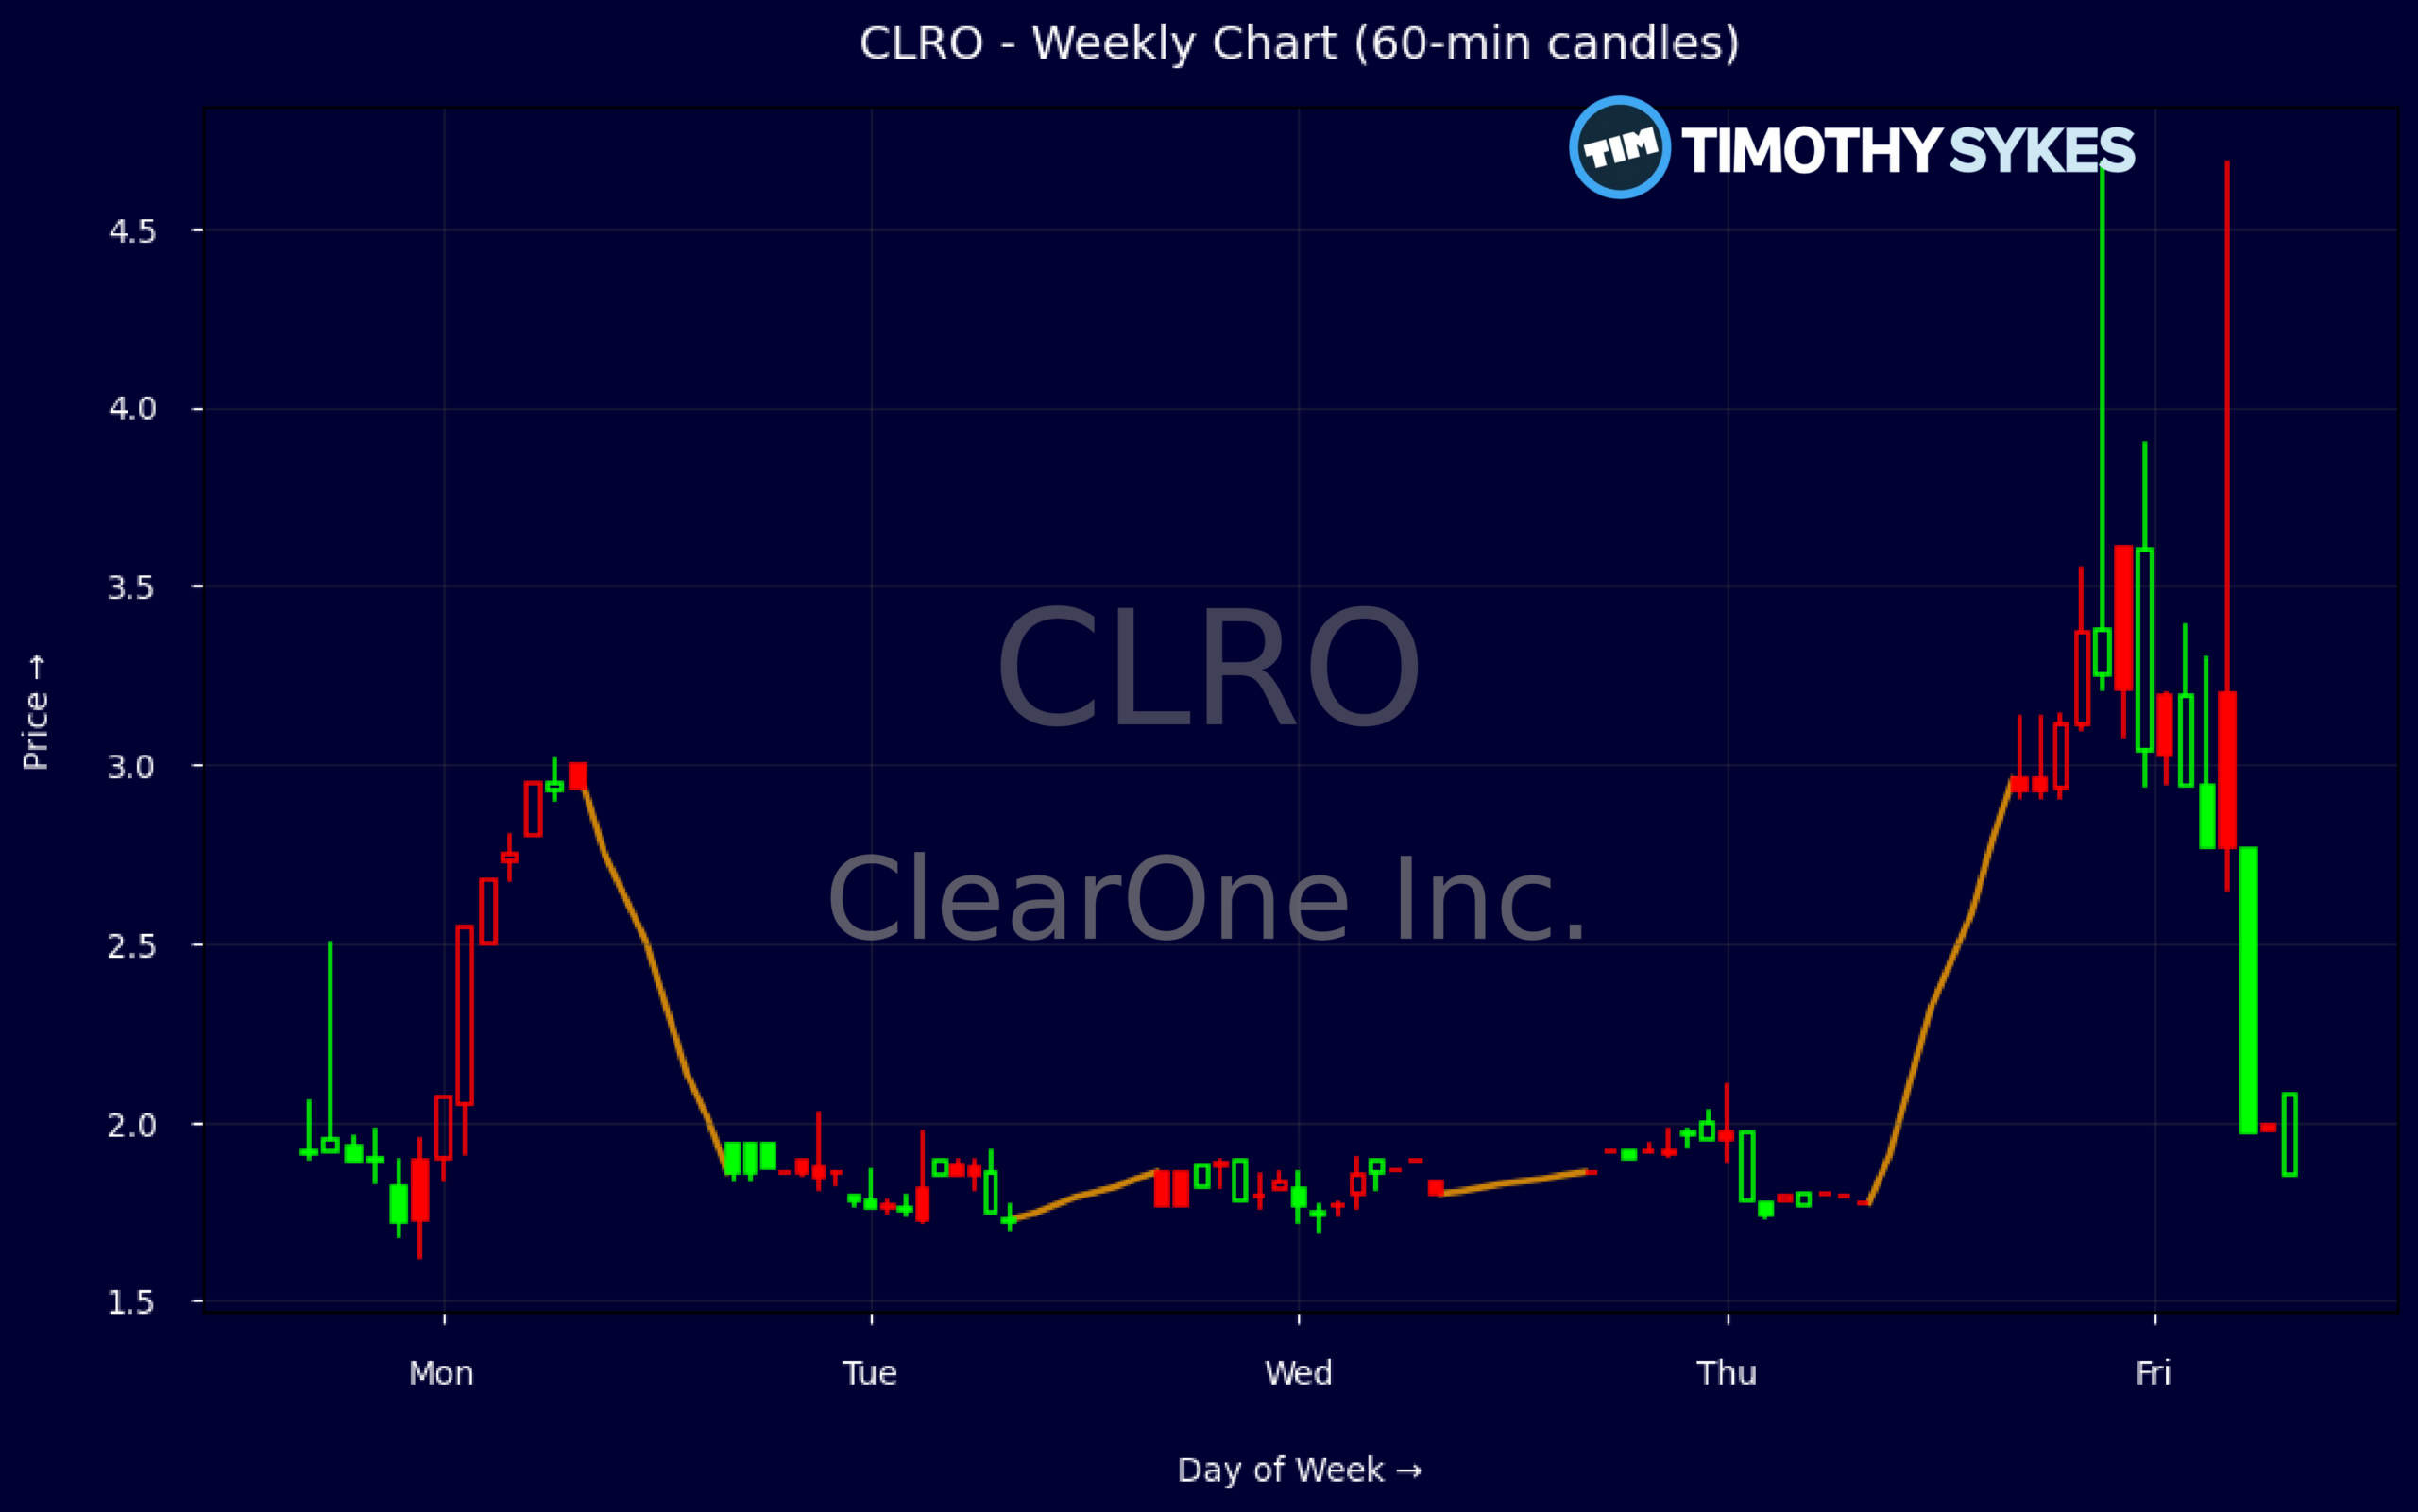
- Weekly chart shows CLRO exploding from under $2 to an intraday spike above $4.60 before closing back near $2.93, signaling aggressive speculative interest.
- Intraday move from $1.97 to $4.685 in a single 5‑minute candle highlights extreme volatility and thin liquidity risk.
- Financials show negative equity, weak margins, and ongoing losses, raising questions about sustainability despite short-term price spikes.
- Balance sheet relies on short-term debt and limited cash, forcing traders to respect downside risk even as momentum opportunities appear.
- Technical levels around $2.90‑$3.00 now act as a key battleground after the sharp reversal from the highs.
Weekly Update Oct 19 – Oct 23, 2026: On Sunday, October 25, 2026 ClearOne Inc. stock [NASDAQ: CLRO] is trending up by 52.6%! Discover the key drivers behind this movement as well as our expert analysis in the detailed breakdown below.
Technology industry expert:
Analyst sentiment – negative
ClearOne (CLRO) sits in a structurally weak market position: revenue has effectively collapsed (3- and 5-year revenue growth both -100), margins are sharply negative (EBITDA -$0.9M in Q2 with gross profit slightly negative), and ROE/ROA are deeply underwater (-275% / -160% LTM). The balance sheet shows negative equity (-$0.38M) and thin liquidity (current ratio 1.1, quick ratio 0.1), with $0.5M current debt recently raised just to fund operations. Free cash flow remains negative (-$0.17M) and working capital is minimal, highlighting going-concern risk despite a small enterprise value (~$9.1M).
Technically, CLRO just experienced an extreme volatility event: a spike from the high-$1.80s to an intraday high near $4.68 before closing the week at $2.93, following prior closes clustered around $1.80–1.95. That move likely reflected a short, illiquid squeeze rather than a sustained institutional bid, given the micro-cap float and typical low volume. The dominant trend is still sideways-to-down with a fresh speculative overshoot. For trading, $2.50 is the key actionable pivot: above it, momentum traders can target $3.50–4.00; a break and hold below $2.50 invites a retrace toward $1.90 support.
With no meaningful recent news flow or visible operational turnaround, CLRO materially underperforms Technology and Hardware & Equipment peers on growth, profitability, and balance sheet strength. The sector is capital-intensive and scale-driven; ClearOne lacks both, and negative tangible equity further constrains strategic options. Near term, resistance stands at $3.50 then $4.00, with strong support at $1.80–1.90. The risk/reward skews poorly for investors; this is a speculative trading vehicle only, not a viable long-term holding.
More Breaking News
Quick Financial Overview
ClearOne Inc. (CLRO) has shown highly unusual recent price action. Weekly data reveals a relatively quiet range under $2 followed by a sudden breakout week, with price jumping from an open near $1.86 to a high above $4.67 before closing around $2.93. For short-term traders, that kind of expansion in range usually signals a mix of momentum chasing and forced covering in a thinly traded name.
The intraday 5‑minute candle tells the same story in sharper focus. Price opened around $1.97 and ripped to $4.685 in one bar, then settled at $3.25. That is not normal, steady accumulation. That is a burst of demand colliding with low liquidity, creating a vertical move that can trap late buyers if they chase without a plan. CLRO now trades with a very wide recent range that traders must factor into position sizing and stop placement.
Under the hood, the fundamentals are strained. ClearOne Inc. reported quarterly net income of about -$0.91M with EBITDA also negative. Revenue is so weak that gross profit is slightly negative, and key ratios show a return on assets and equity deep in the red. The balance sheet shows total assets near $0.99M against total liabilities of about $1.37M, leaving stockholders’ equity at roughly -$0.38M. Current ratio near 1.1 and quick ratio around 0.1 suggest tight liquidity, with $0.5M in current debt and only $0.075M in cash.
Conclusion
ClearOne Inc. (CLRO) currently trades like a classic high-risk, high-volatility small-cap. The chart shows a violent squeeze from under $2 to above $4.60, then a hard fade back toward $3. That pattern often marks the start of a more active trading phase, where both day traders and short-term swing traders probe the name for repeatable setups. But the same volatility that creates opportunity also magnifies risk when the tape turns.
Financially, CLRO is operating from a weak base. Negative equity, negative margins, and ongoing losses mean the company has little cushion if conditions worsen. Cash is limited and short-term debt is meaningful relative to assets, which can put pressure on management to cut costs or raise capital. For traders, that backdrop argues for treating every setup as a trade, not a long-term anchor position.
The key near-term level is the recent close zone around $2.90‑$3.00, which may act as a pivot between failed breakout and potential base. A sustained hold above that area could keep momentum traders engaged, while a breakdown back toward the low $2s would signal fading interest. As millionaire penny stock trader and teacher Tim Sykes, says, “It’s better to go home at zero than to go home in the red.” That mindset reinforces the need to prioritize capital preservation over forcing trades in a name this volatile. As I often tell my students, “Stocks like CLRO can change your month in one good trade or one bad one — your edge isn’t predicting the story, it’s managing the risk while the story plays out.” This article is for educational and research purposes only.
“,”scores”:{“risk-level”:”high”},”trade”:”false
This is stock news, not investment advice. Timothy Sykes News delivers real-time stock market news focused on key catalysts driving short-term price movements. Our content is tailored for active traders and investors seeking to capitalize on rapid price fluctuations, particularly in volatile sectors like penny stocks. Readers come to us for detailed coverage on earnings reports, mergers, FDA approvals, new contracts, and unusual trading volumes that can trigger significant short-term price action. Some users utilize our news to explain sudden stock movements, while others rely on it for diligent research into potential investment opportunities.
Dive deeper into the world of trading with Timothy Sykes, renowned for his expertise in penny stocks. Explore his top picks and discover the strategies that have propelled him to success with these articles:
- Penny Stocks Trading Guide
- Best Penny Stocks Under $1 to Buy Today
- Top 8 Penny Stocks to Watch on Robinhood
Once you’ve got some stocks on watch, elevate your trading game with StocksToTrade the ultimate platform for traders. With specialized tools for swing and day trading, StocksToTrade will guide you through the market’s twists and turns.
Dig into StocksToTrade’s watchlists here:





Leave a reply