

Hornbeck Offshore Services Inc. stocks have been trading up by 8.07 percent amid bullish sentiment on offshore energy demand.
Market Insights For Active Traders
- Recent weekly action shows Hornbeck Offshore Services Inc. breaking above a tight range, with price lifting from the mid-$6 area toward $7.
- Intraday spike from around $6.55 to above $7, on a single 5-minute bar, signals aggressive buying and possible short-term momentum.
- Valuation for HOS sits near book value, suggesting the market is pricing the company close to its underlying asset base.
- Strong cash position and positive free cash flow give Hornbeck Offshore Services Inc. flexibility to ride out sector swings.
- Traders are watching whether the stock can hold above recent intraday highs to confirm a new leg higher.
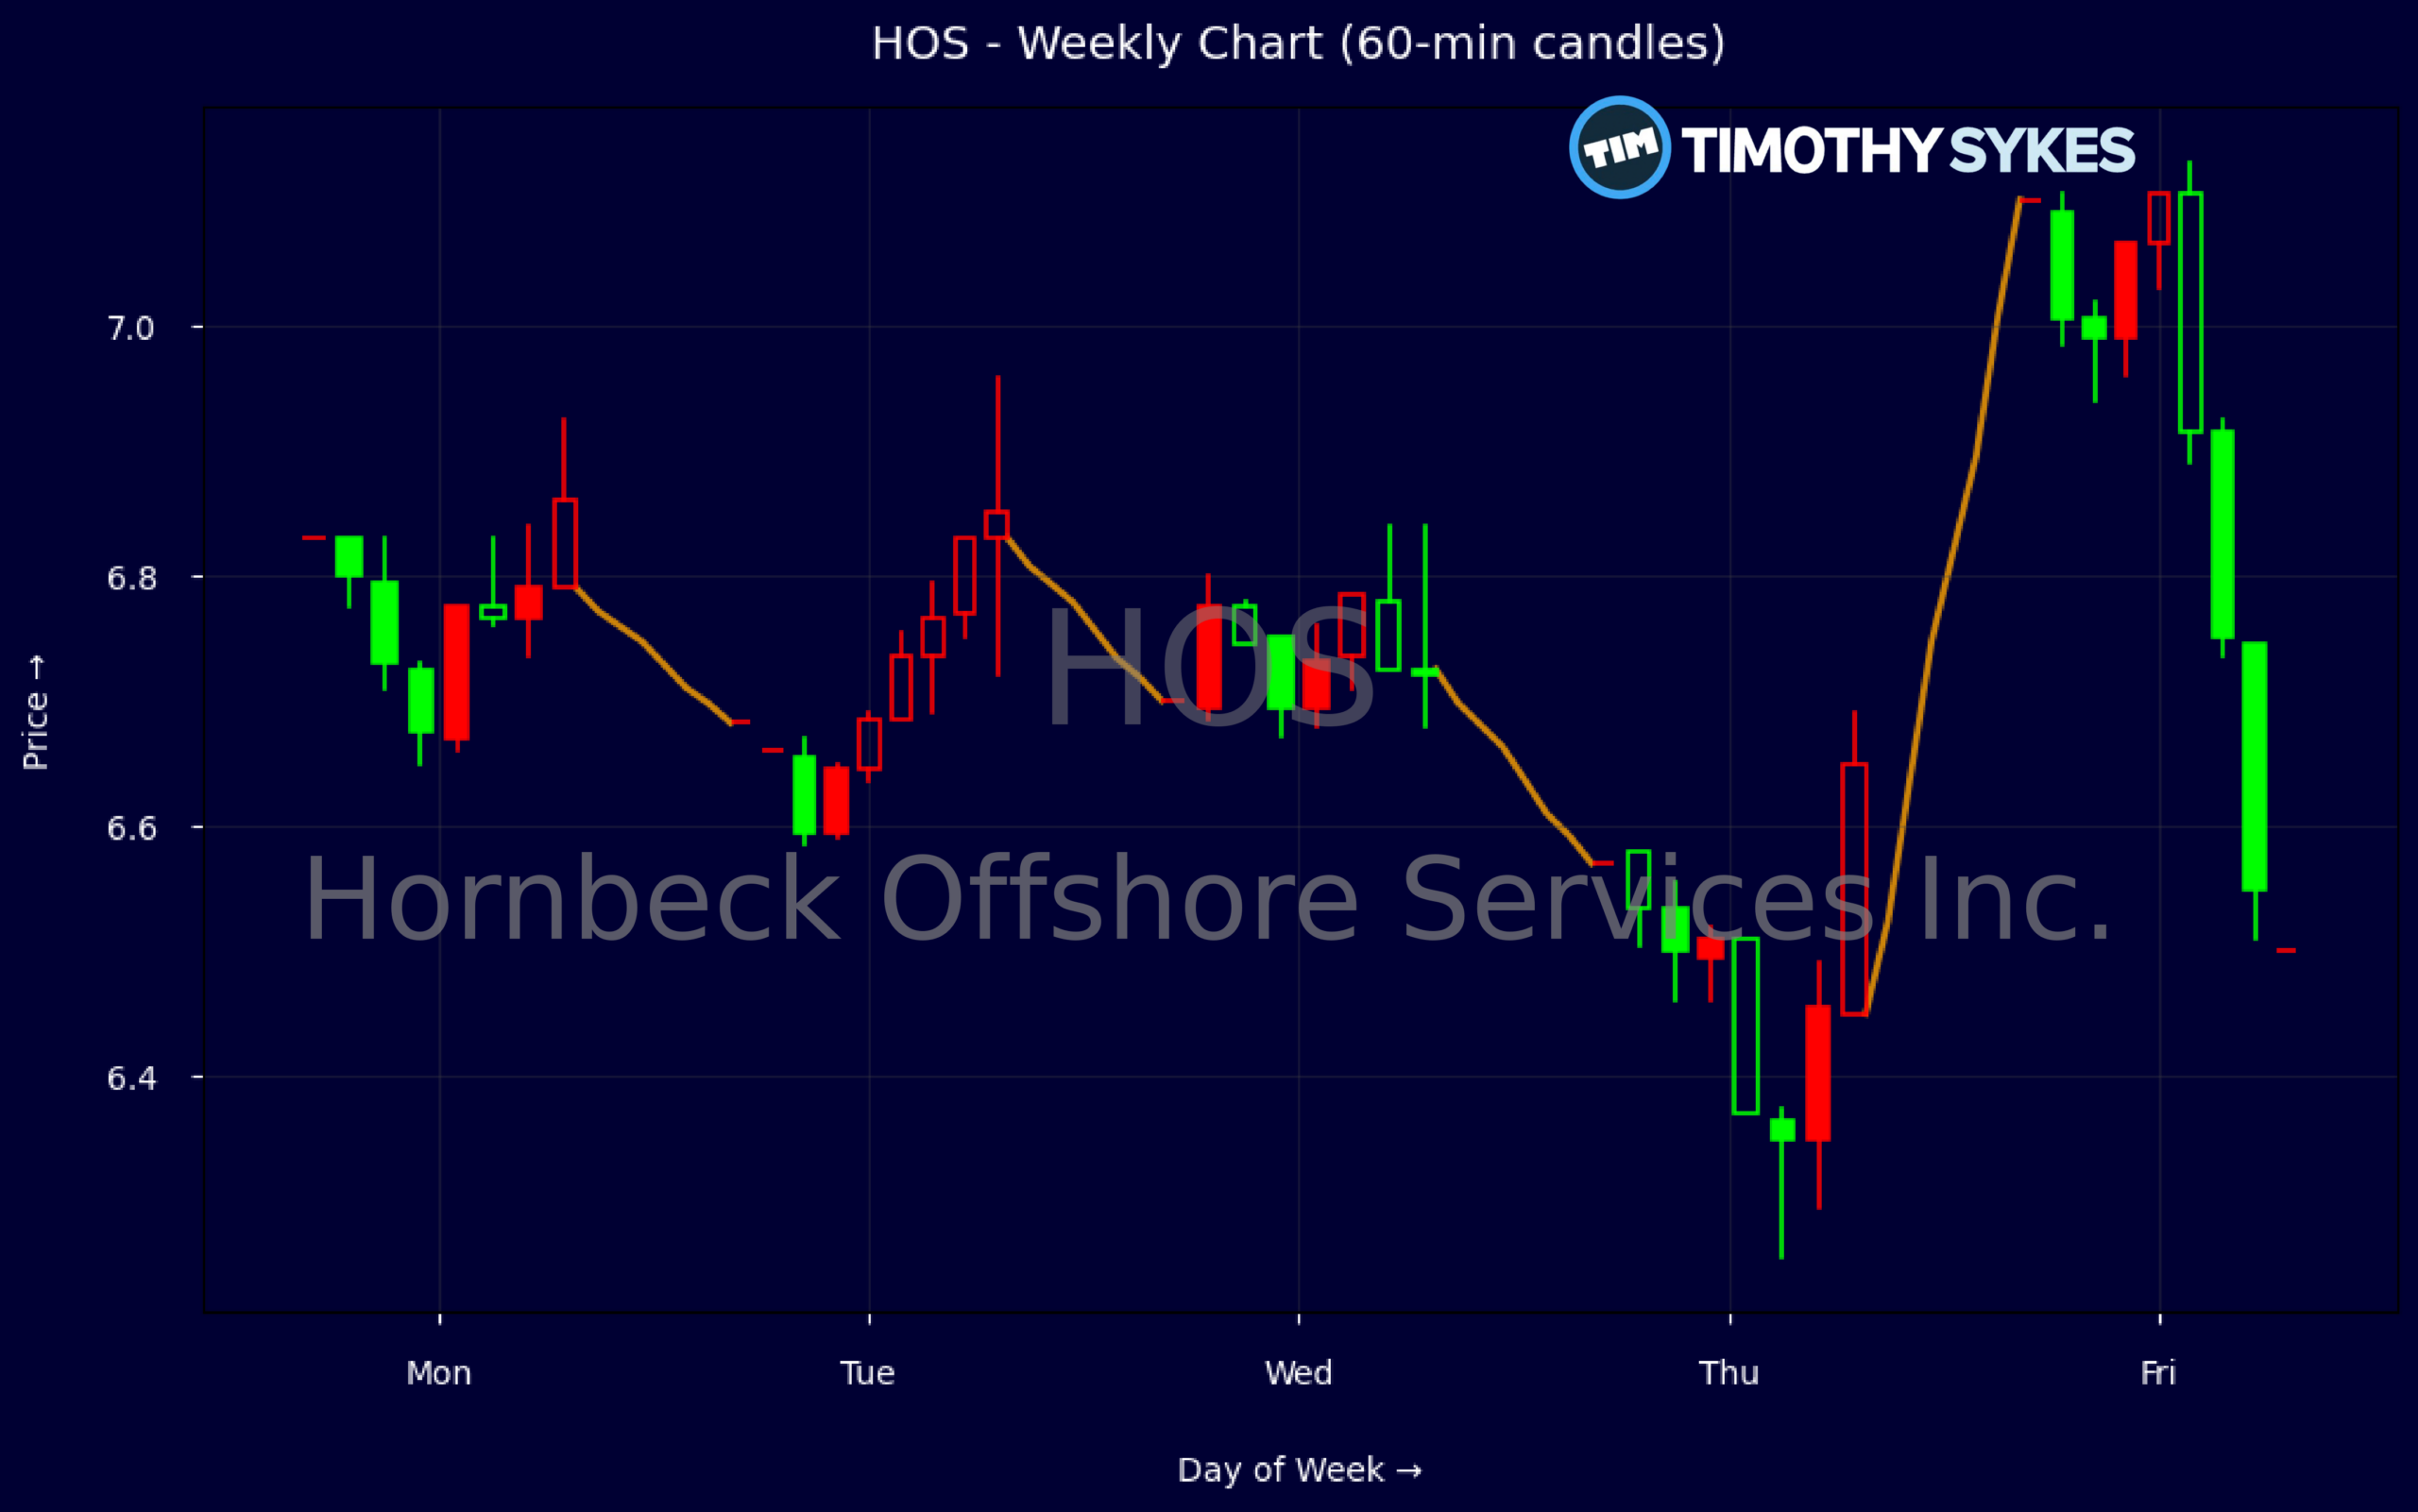
Weekly Update Oct 19 – Oct 23, 2026: On Saturday, October 24, 2026 Hornbeck Offshore Services Inc. stock [NYSE: HOS] is trending up by 8.07%! Discover the key drivers behind this movement as well as our expert analysis in the detailed breakdown below.
Energy industry expert:
Analyst sentiment – positive
Hornbeck Offshore Services (HOS) sits as a niche U.S. offshore service vessel operator with improving but still fragile fundamentals. TTM revenue of roughly $1.29 billion against an enterprise value of $1.54 billion yields a modest 1.27x EV/sales and 1.05x price/book, indicating the market is pricing in only a mid‑cycle recovery. Quarterly EBITDA of $55.3 million and operating income of $35.1 million imply an EBIT margin in the low‑teens, while free cash flow of $46.7 million and a large $652 million cash balance provide solid liquidity despite $536 million of debt and leases.
Technically, HOS shows a short, sharp upward rotation after prior compression: weekly closes stepped from 6.83 to 6.68, 6.70, 6.57, then a clean jump to 7.10, signaling renewed buying interest and a likely break from a low‑volatility base. Intraday 5‑minute candles confirm demand clustering above 6.70 with higher lows and rising volume into the 7.10 print. Dominant trend is now short‑term bullish; 6.60–6.70 is the key support zone and an actionable buy‑the‑dip level with a tight stop just below 6.50.
With no incremental news flow, HOS trades primarily as a leveraged play on offshore utilization and dayrates, which still lag pre‑downturn Energy and Fossil Fuels benchmarks. Versus peers, valuation at 7.7x cash flow and a 27.7x P/E looks full but not excessive if vessel demand tightens into 2027. My base‑case outlook is moderately constructive: accumulate between 6.60–6.90, initial resistance 7.75–8.00 and secondary target 8.75 over 6–12 months, assuming stable oil prices and no major contract setbacks.
More Breaking News
Quick Financial Overview
Hornbeck Offshore Services Inc. shows a tight but constructive weekly tape. Over the last five data points, HOS has moved from $6.83, dipped toward $6.57, and then pushed to $7.10. That progression tells traders the dip buyers stepped in around the mid-$6 range and managed to push price to a short-term closing high. When a stock makes a higher close after a brief pullback, it often signals early accumulation rather than distribution.
The intraday 5-minute candle is even more telling. Price opened near $6.55, flushed to $6.51, then ripped as high as $7.13 and closed around $7.10. That is a wide intraday range, with buyers clearly in control by the close. For short-term traders in HOS, that kind of one-bar impulse move often becomes a reference point: above the high suggests continuation; under the low warns the move may have been a blow-off.
On the fundamental side, Hornbeck Offshore Services Inc. is generating meaningful revenue, with about $1.29B in annual sales and a price-to-sales ratio near 1.27. A price-to-book ratio of roughly 1.05, on a book value per share around $7.13, means the stock is trading very close to its accounting equity. Earnings are positive, with a price-to-earnings near 27.67, which implies the market is willing to pay up for current profits and future potential. Free cash flow looks healthy relative to market value, supported by an enterprise value of about $1.54B.
Conclusion
Hornbeck Offshore Services Inc. Financial Setup For Traders
Hornbeck Offshore Services Inc. now sits in an interesting zone where the chart and the balance sheet line up. On the one hand, the weekly and intraday moves in HOS show clear demand stepping in around the mid-$6 level and pushing price toward and slightly above $7. On the other hand, the stock trades very close to book value while still carrying a mid-20s earnings multiple, suggesting the market respects both the asset base and the current profit stream. As millionaire penny stock trader and teacher Tim Sykes says, “Cut losses quickly, let profits ride, and don’t overtrade.”, and that principle lines up well with how traders should be thinking about this name at current levels.
For short-term traders, the key levels are straightforward. The recent 5-minute low near $6.51 marks a clear risk line: lose that with heavy volume, and the latest momentum burst may unwind. Hold above $7 and push through the intraday high, and Hornbeck Offshore Services Inc. can attract breakout and momentum players looking for continuation. With solid cash, positive operating cash flow, and manageable leverage, the company has room to navigate the usual volatility that hits cyclical, service-oriented names.
From a risk/reward point of view, traders should focus less on predicting the next headline and more on how price behaves around these technical pivot zones. As I tell my students when we study HOS and similar names, “The edge does not come from guessing the story; it comes from defining your levels, managing your risk, and letting the tape confirm the trend.”
This is stock news, not investment advice. Timothy Sykes News delivers real-time stock market news focused on key catalysts driving short-term price movements. Our content is tailored for active traders and investors seeking to capitalize on rapid price fluctuations, particularly in volatile sectors like penny stocks. Readers come to us for detailed coverage on earnings reports, mergers, FDA approvals, new contracts, and unusual trading volumes that can trigger significant short-term price action. Some users utilize our news to explain sudden stock movements, while others rely on it for diligent research into potential investment opportunities.
Dive deeper into the world of trading with Timothy Sykes, renowned for his expertise in penny stocks. Explore his top picks and discover the strategies that have propelled him to success with these articles:
- Penny Stocks Trading Guide
- Best Penny Stocks Under $1 to Buy Today
- Top 8 Penny Stocks to Watch on Robinhood
Once you’ve got some stocks on watch, elevate your trading game with StocksToTrade the ultimate platform for traders. With specialized tools for swing and day trading, StocksToTrade will guide you through the market’s twists and turns.
Dig into StocksToTrade’s watchlists here:





Leave a reply