

Positive clinical trial news has lifted sentiment around Genmab A/S, whose stocks have been trading up by 9.75 percent.
Market Insights For GMAB Traders
- Phase 3 RAINFOL-02 for Rina-S in platinum-resistant ovarian cancer hit both progression-free and overall survival goals, with strong risk reduction versus chemotherapy and a steady safety profile.
- Management now targets global regulators and broader gynecologic and solid tumor use, framing Rina-S as a possible new standard and multi-indication platform.
- Shares gained about $4 to $41.61, roughly a 6.8% move, after the data, confirming a strong bullish reaction.
- Royalties from Johnson & Johnson’s DARZALEX, based on about $4.24B Q3 2026 sales, give Genmab A/S a recurring cash engine.
- A fresh price target hike to $42 from $35 signals analysts are re-rating GMAB off recent clinical and royalty momentum.
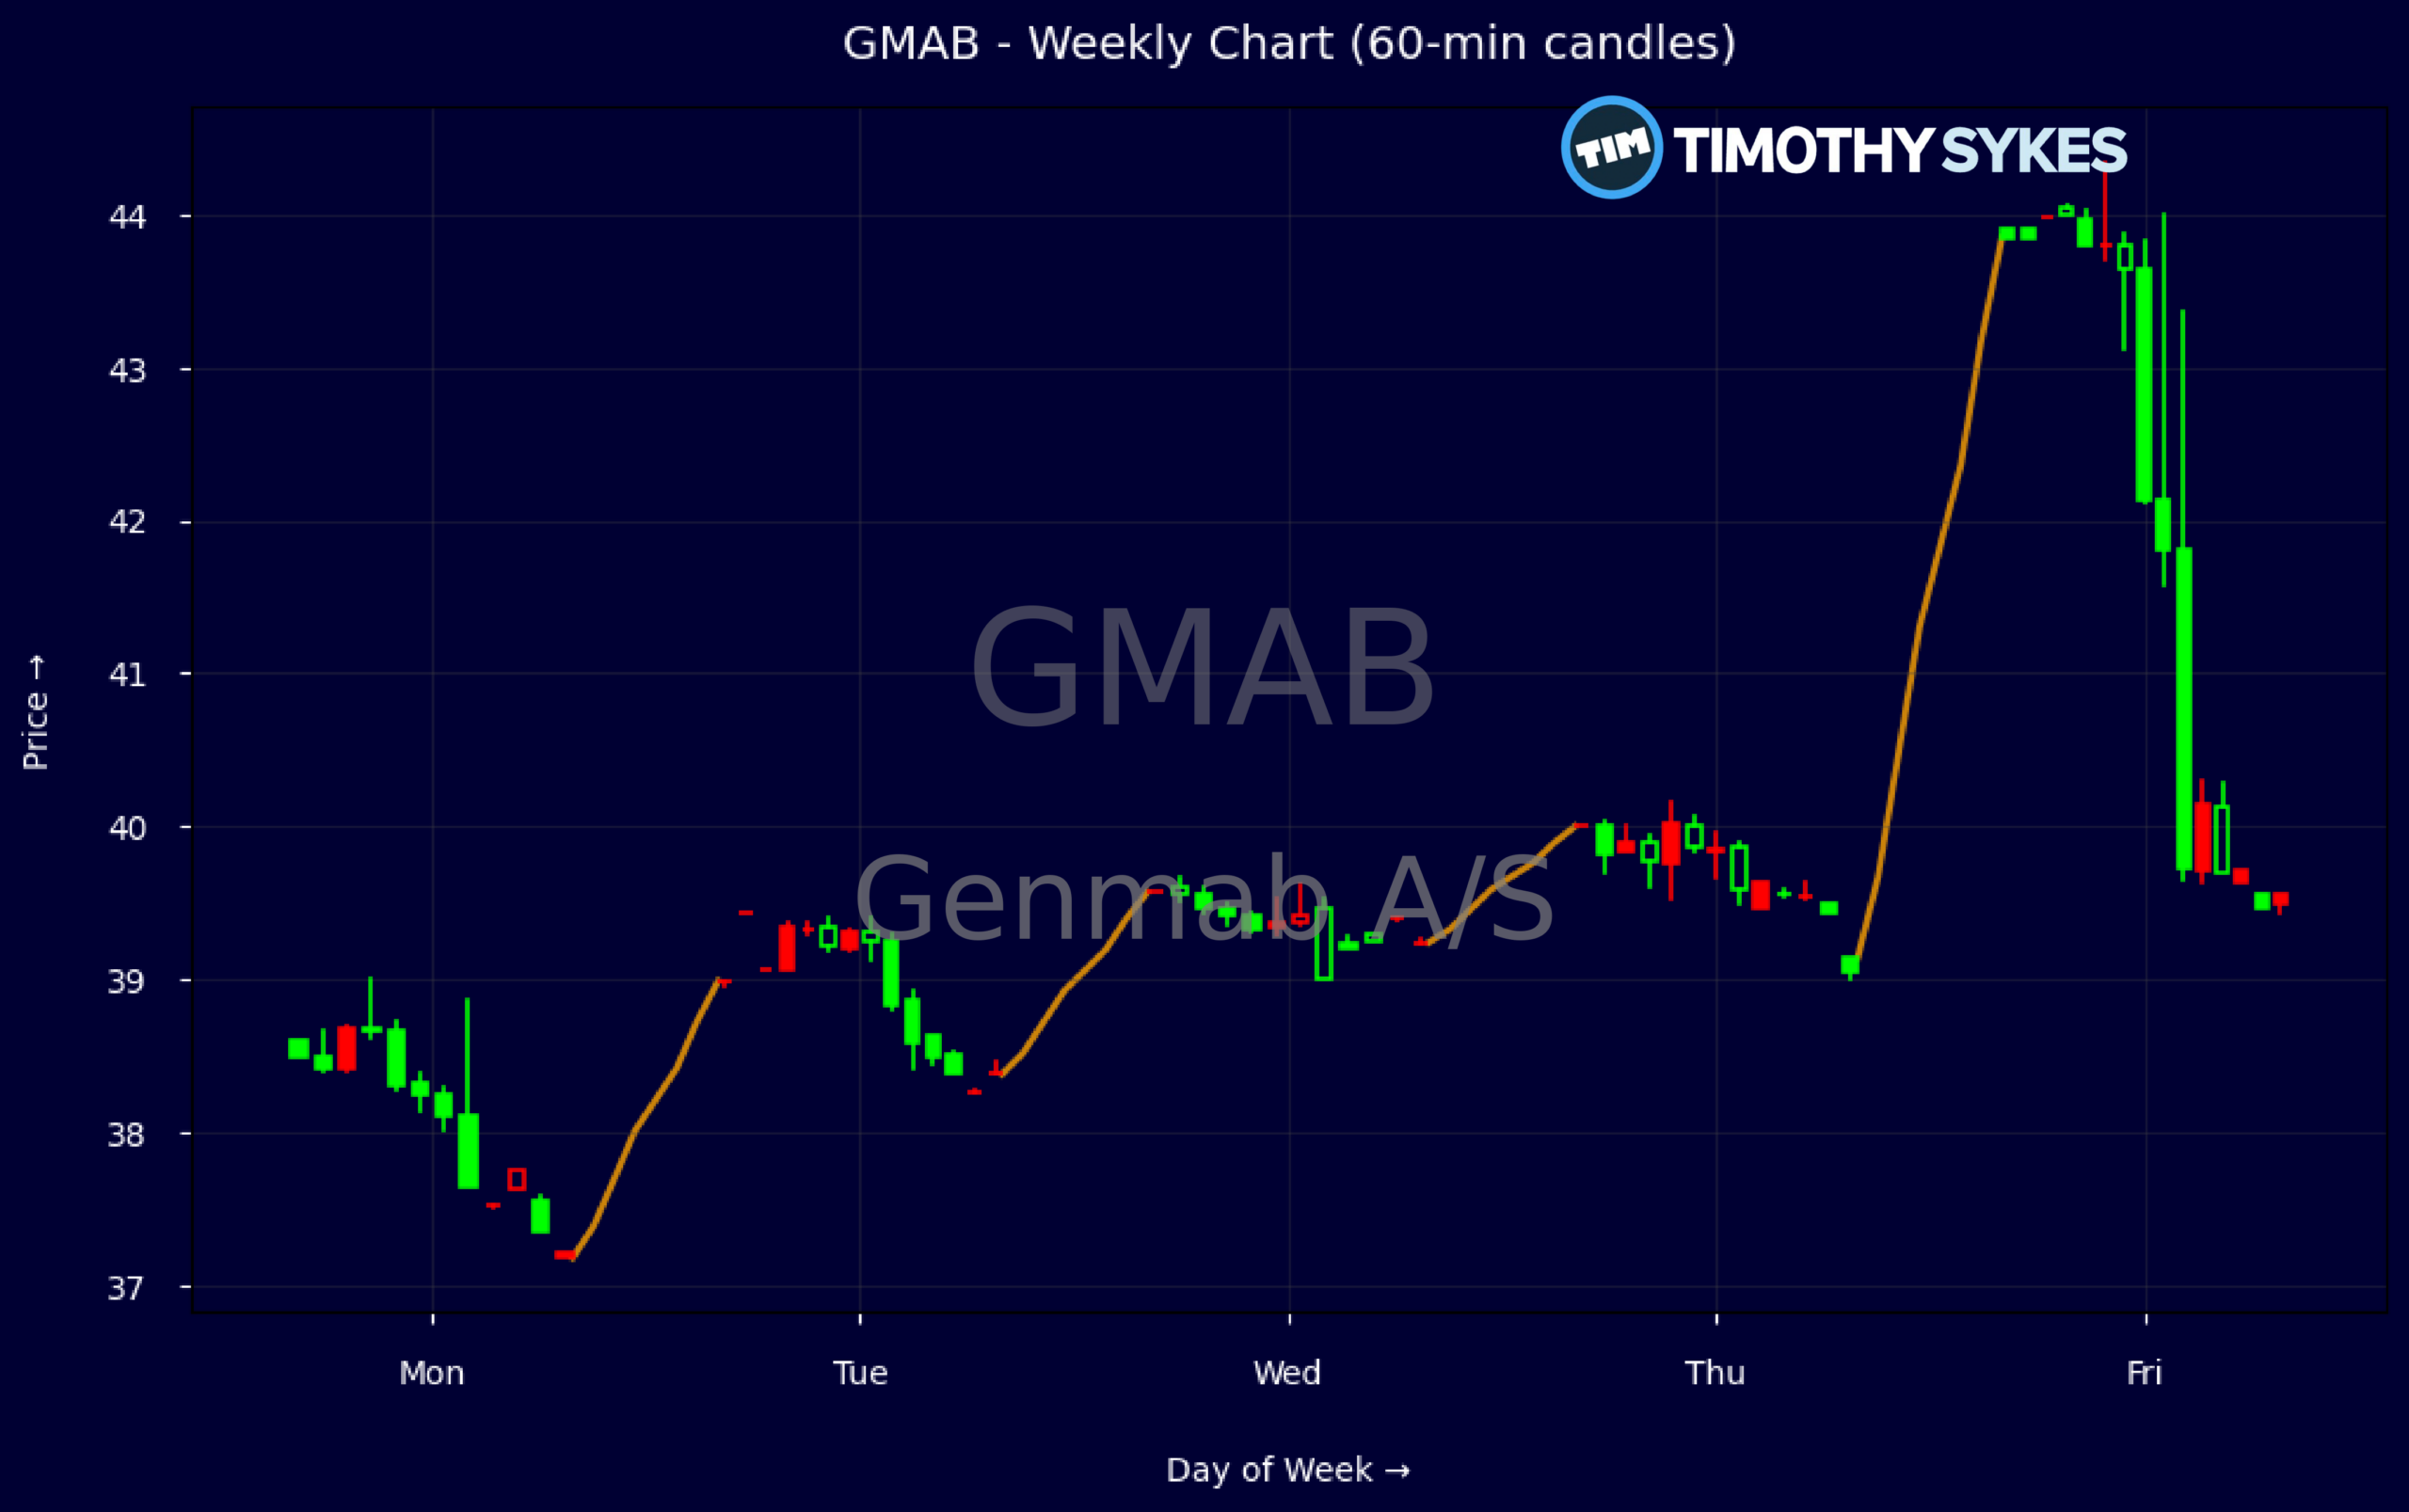
Weekly Update Oct 19 – Oct 23, 2026: On Sunday, October 25, 2026 Genmab A/S stock [NASDAQ: GMAB] is trending up by 9.75%! Discover the key drivers behind this movement as well as our expert analysis in the detailed breakdown below.
Healthcare industry expert:
Analyst sentiment – positive
Genmab (GMAB) sits in the top tier of mid‑cap oncology innovators, combining royalty leverage from Darzalex with an emerging wholly owned pipeline. Profitability is already attractive for a biotech, with pre‑tax margins above 55% and ROE of 6.9%, despite heavy R&D. The balance sheet is strong: DKK 1.7B cash against DKK 5.0B long‑term debt, leverage ratio 2.2x, and equity of DKK 5.8B. Valuation is rich (P/E ~155x, P/S ~40x, P/B ~25x), fully discounting further pipeline success.
Technically, GMAB has broken out decisively, with the weekly close jumping from roughly 38.6 to 43.9, including a gap and strong follow‑through after the Rina‑S data. The dominant trend is now bullish, confirmed by higher highs and no meaningful intraday rejection on the latest candles, with elevated volume on the up‑move. Immediate actionable level: 41.50–42.00 as first support; aggressive long entries on pullbacks toward that zone with a stop below 39.50 and upside into the mid‑40s.
Fundamentally, Rina‑S’s Phase 3 success in platinum‑resistant ovarian cancer is a step‑change asset, likely supporting global filings and expanding Genmab beyond its royalty base, while epcoritamab’s positive DLBCL data and new Incyte collaboration reinforce a diversified growth runway. Relative to healthcare and biotech peers, Genmab offers superior profitability, cleaner balance sheet, and more de‑risked late‑stage assets, justifying a premium. I see near‑term resistance at 45–46 and support at 41–42; 12‑month fair value is $48–50.
More Breaking News
Quick Financial Overview
Genmab A/S, trading under ticker GMAB, has just put a major clinical win on the board while the stock pushed from the high-$30s into the low-$40s. Weekly data show price grinding from about $38.5 early in the period to a spike near $44 on 2026/10/23 before settling around $43.9, which is classic breakout behavior after a strong catalyst. Intraday, the 5-minute candle shows a wide range from roughly $39.8 to $44.3 with a close near the high, a sign that buyers controlled the tape into the end of the move.
Under the hood, GMAB carries about DKK 21.53B in revenue (roughly $21.5B equivalent) and a very rich valuation profile. A price-to-sales ratio near 40.07 and a P/E around 155.11 say traders are paying up heavily for growth and pipeline success. Profitability is strong on paper, with a pretax margin of 55.7% and return on equity of 6.9%, supported by high-margin royalty streams like DARZALEX.
The balance sheet looks solid but not asset-light. Total assets sit around $12.87B with equity of about $5.85B and long-term debt of roughly $5.0B, giving a leverage ratio around 2.2 and long-term debt making up nearly half of capital. Cash and short-term investments of about $1.72B plus recurring royalties help fund R&D and dilute some clinical risk. For traders, that mix means GMAB is not a fragile early-stage biotech, but valuations leave little room for big clinical missteps.
Conclusion
This is stock news, not investment advice. Timothy Sykes News delivers real-time stock market news focused on key catalysts driving short-term price movements. Our content is tailored for active traders and investors seeking to capitalize on rapid price fluctuations, particularly in volatile sectors like penny stocks. Readers come to us for detailed coverage on earnings reports, mergers, FDA approvals, new contracts, and unusual trading volumes that can trigger significant short-term price action. Some users utilize our news to explain sudden stock movements, while others rely on it for diligent research into potential investment opportunities.
Dive deeper into the world of trading with Timothy Sykes, renowned for his expertise in penny stocks. Explore his top picks and discover the strategies that have propelled him to success with these articles:
- Penny Stocks Trading Guide
- Best Penny Stocks Under $1 to Buy Today
- Top 8 Penny Stocks to Watch on Robinhood
Once you’ve got some stocks on watch, elevate your trading game with StocksToTrade the ultimate platform for traders. With specialized tools for swing and day trading, StocksToTrade will guide you through the market’s twists and turns.
Dig into StocksToTrade’s watchlists here:





Leave a reply