

Neighborhood Intelligence Inc. surged as stocks have been trading up by 17.82 percent after unveiling a breakthrough AI analytics platform.
Market Insights For NXH Traders
- Reworked deal initially aimed to roll a roughly 38.8% tZERO stake, Medici funds, and GrainChain into Fathom, giving Neighborhood Intelligence Inc. a controlling role in a combined real estate–digital asset platform.
- Original share-for-share merger with Fathom was scrapped in favor of this asset-focused structure, shifting the story from full integration to a more targeted platform play.
- Shares of NXH popped about 7.6% after-hours when the market first got clearer visibility into its tZERO, Medici portfolio, and GrainChain holdings through the proposed Fathom structure.
- Later termination of the merger left NXH holding its blockchain and digital-asset portfolio outright, signaling management’s view that the market still undervalues these assets.
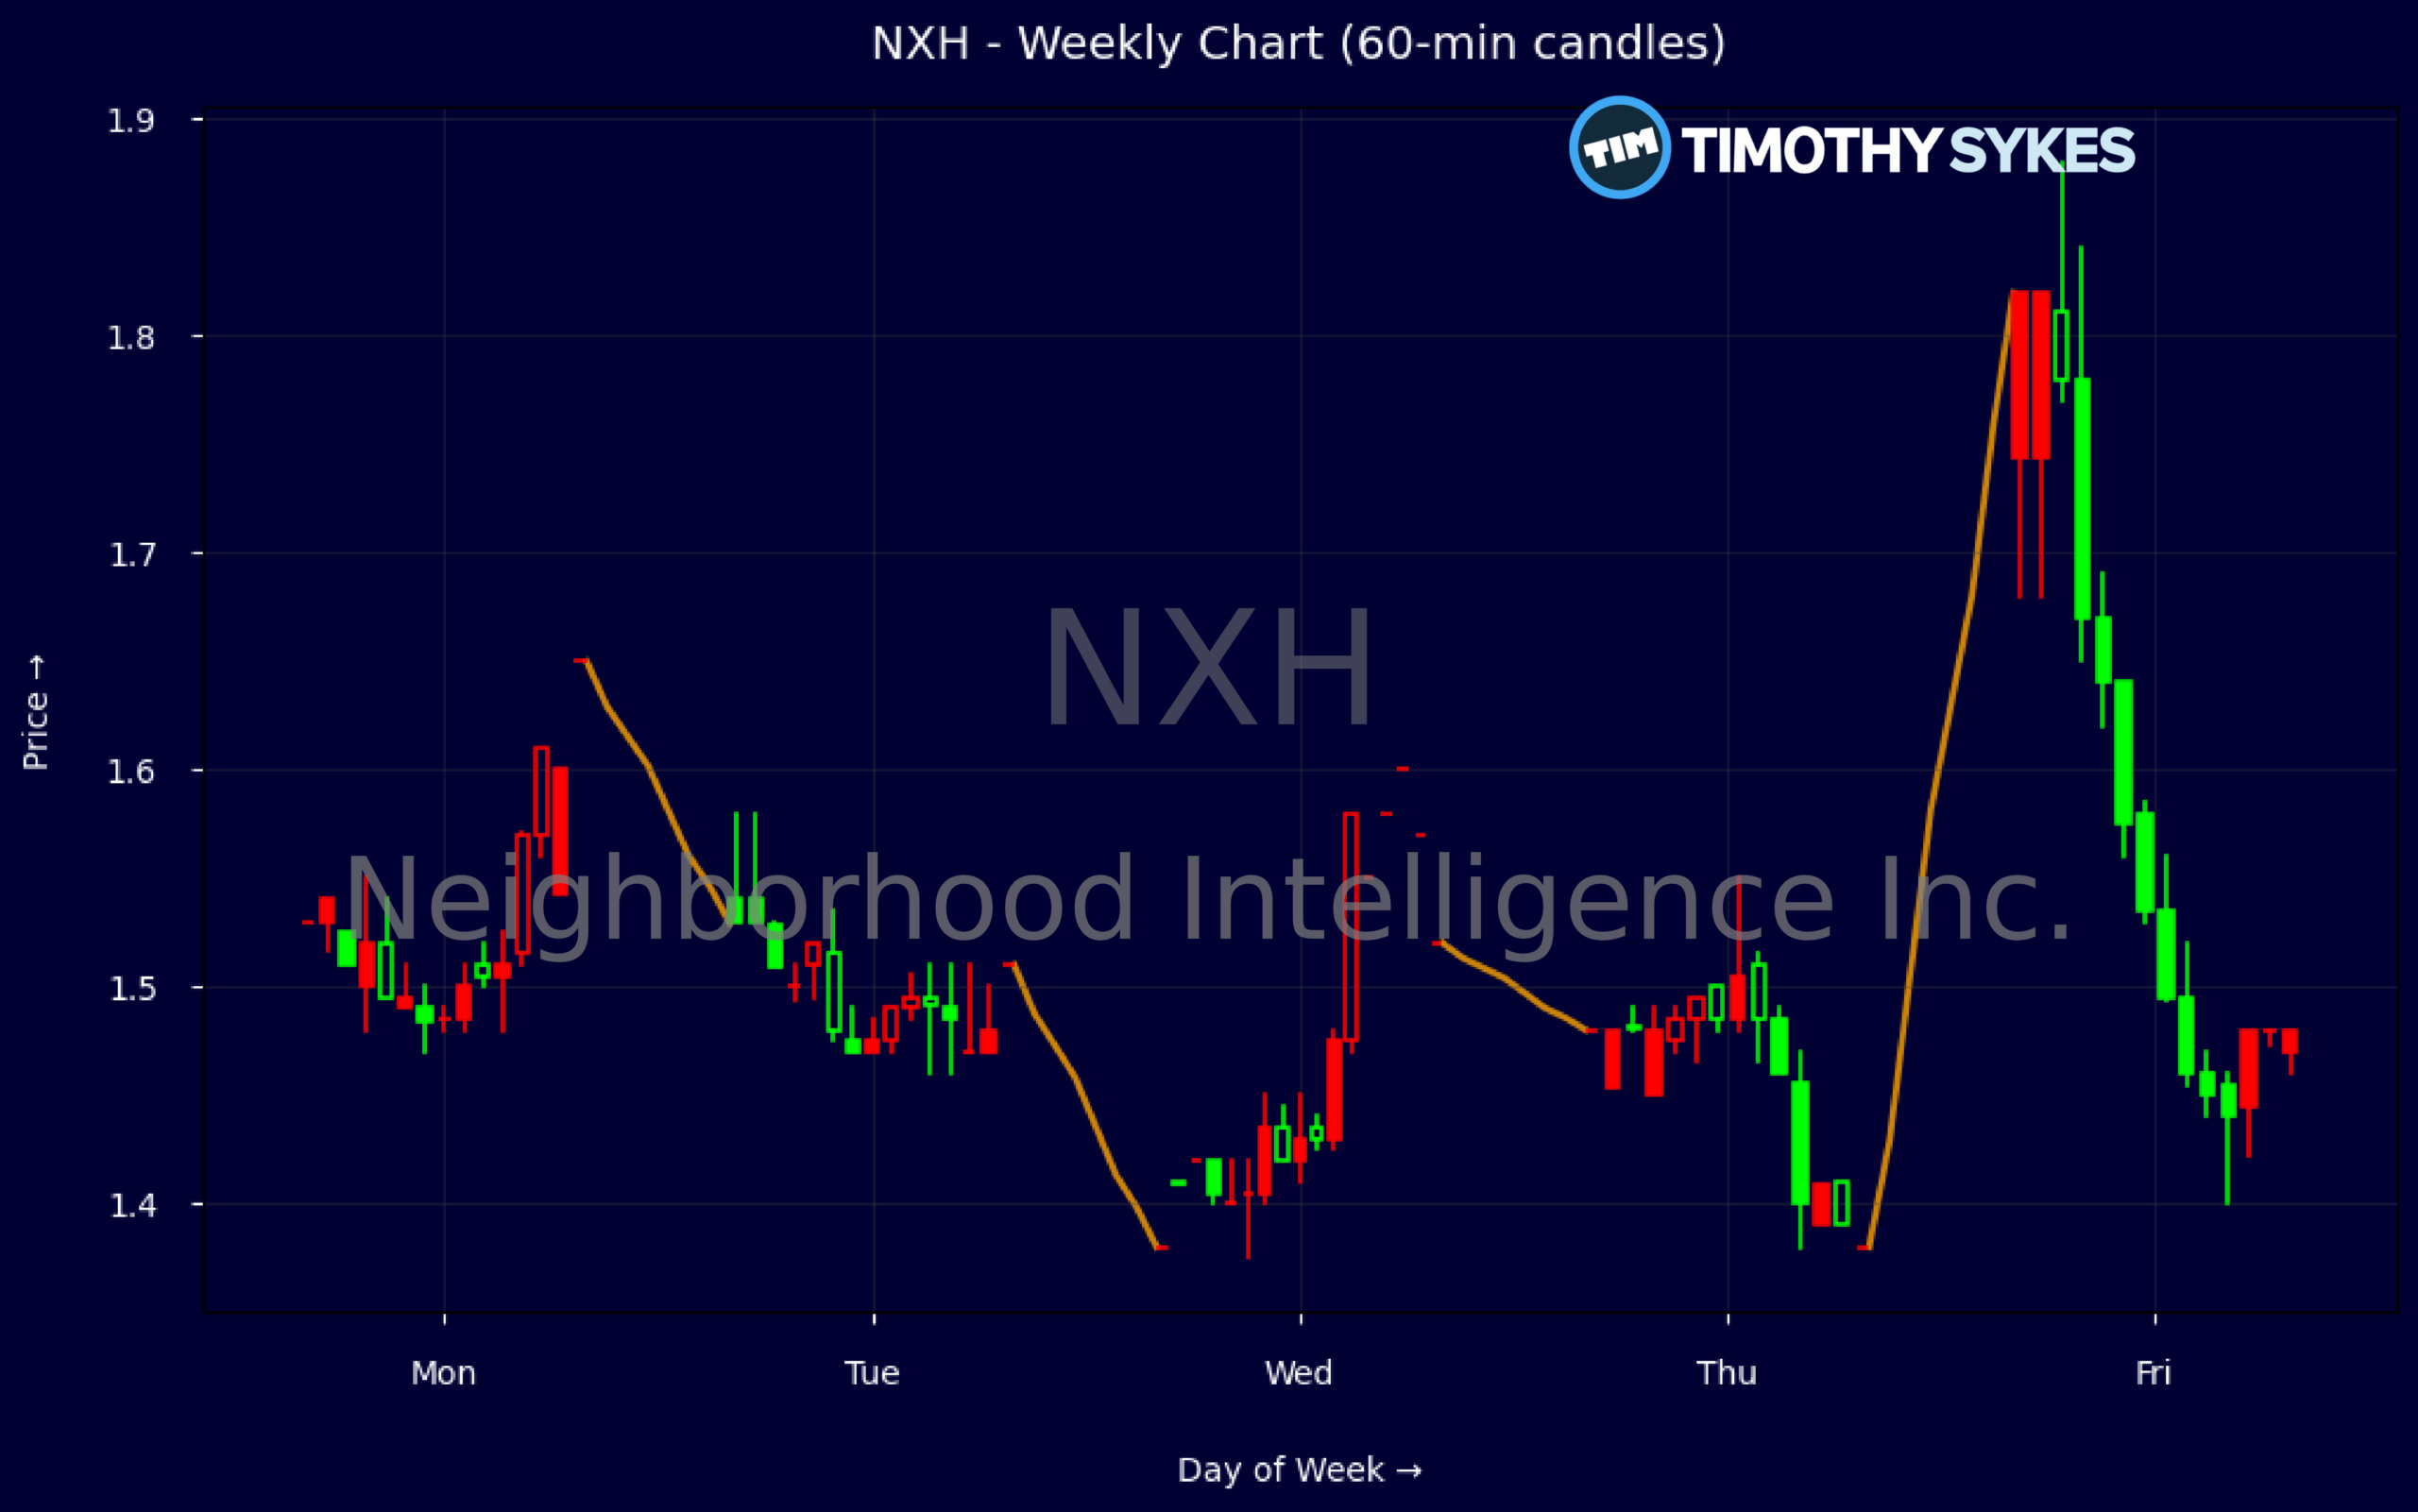
Weekly Update Oct 19 – Oct 23, 2026: On Saturday, October 24, 2026 Neighborhood Intelligence Inc. stock [NASDAQ: NXH] is trending up by 17.82%! Discover the key drivers behind this movement as well as our expert analysis in the detailed breakdown below.
Consumer Discretionary industry expert:
Analyst sentiment – neutral
Neighborhood Intelligence (NXH) remains a distressed special situation rather than a functioning Consumer Discretionary operator. Quarterly revenue of $361M (LTM ~$1.0B) sits against persistent operating losses (Q EBITDA -$34.8M, EBIT margin roughly -12%) and deeply negative free cash flow (-$43M in Q2). The balance sheet carries modest financial debt (~$23M current, $13M long term) but heavy lease obligations and negative retained earnings. Equity trades at only ~0.16x sales and ~0.9x book, reflecting skepticism about monetizing legacy assets and digital holdings.
Technically, NXH is rebounding from a depressed base. The weekly tape shows a pivot from tight trade around $1.50 to a sharp push toward $1.88, with the latest close at $1.74 and expanding ranges, signaling aggressive short-term accumulation. Intraday 5‑minute candles (and uptick in volume around $1.60–$1.70) confirm buyers absorbing supply on dips. Dominant trend is short‑term up within a longer basing structure; $1.50 is actionable support, with a tactical long entry above $1.60 and stop just below $1.48.
The restructured Fathom transaction refocuses NXH as a hybrid real estate–digital asset holding vehicle, crystallizing public‑equity exposure to tZERO, Medici, and GrainChain but also increasing dependence on high‑beta, hard‑to‑value assets. Versus Consumer Discretionary and Retail‑Discretionary peers, NXH has weaker fundamentals, higher strategic uncertainty, and a more optionality‑driven profile. Near term, I see $2.00–$2.10 as achievable resistance on deal momentum; failure of the Fathom structure would cap upside and return shares toward $1.50.
More Breaking News
Quick Financial Overview
Neighborhood Intelligence Inc. sits at the intersection of distressed legacy retail and speculative digital assets, and that mix shows up clearly in the numbers. The company generated about $1.04B in revenue over the trailing period, translating to roughly $9.50 in revenue per share, yet it still posted a quarterly net loss of about $39.5M and negative free cash flow of roughly $43.4M. For traders, that combination of solid top line and persistent losses means the stock trades more on story, balance sheet, and catalysts than on clean earnings.
On valuation, NXH looks optically cheap by traditional measures. A price-to-sales ratio around 0.16 and price-to-book near 0.87 both suggest the market is discounting the asset base, even before you layer in hard-to-value stakes like tZERO and the Medici-related funds. Book value per share sits near $1.95, while cash and short-term investments are close to $99.5M against total assets of about $634.2M, giving the company some liquidity but not enough to ignore the ongoing burn.
The chart reflects that tug-of-war between downside risk and speculative interest. On the weekly data, NXH has chopped between roughly $1.38 and $1.88, with a recent push from the mid-$1.40s to a close around $1.74 after the Fathom news cycle, echoing the 7.6% after-hours spike. Intraday, a 5-minute candle showing a move from $1.45 to a $1.64 close, with a dip to $1.40, signals aggressive dip-buying and active day-trader presence. That kind of intraday range can be a gift for disciplined short-term traders, but it punishes anyone who ignores risk controls.
Conclusion
Liquidity, Losses, And A Binary Story For NXH
Neighborhood Intelligence Inc. is now firmly a standalone, special-situation trade rather than a clean merger story. The back-and-forth with Fathom moved the stock, but the final outcome leaves NXH holding its tZERO stake, Medici-linked funds, and GrainChain while signaling that management believes the market has priced them too low. For traders, that means the core driver is perception of hidden value in those digital assets versus the drag from continuing operating losses and negative cash flow.
The weekly range between roughly $1.40 support and $1.80–$1.90 resistance is the key battlefield until new news hits. Strong revenue and modest enterprise value hint at upside if the market warms to the digital portfolio or if another structure with Fathom emerges, but a negative earnings profile and weak working capital keep the downside very real. NXH will likely trade headline to headline, with sharp moves around any update on tZERO, Medici, GrainChain, or fresh strategic talks.
For research-focused traders, this is a classic high-risk, high-volatility setup that demands tight sizing and clear levels. As I tell my students when they tackle names like NXH, “You don’t marry a speculative story stock — you date it, manage your risk, and let the chart prove you right.” As millionaire penny stock trader and teacher Tim Sykes says, “Embrace the journey, the ups and downs; each mistake is a lesson to improve your strategy.”
This is stock news, not investment advice. Timothy Sykes News delivers real-time stock market news focused on key catalysts driving short-term price movements. Our content is tailored for active traders and investors seeking to capitalize on rapid price fluctuations, particularly in volatile sectors like penny stocks. Readers come to us for detailed coverage on earnings reports, mergers, FDA approvals, new contracts, and unusual trading volumes that can trigger significant short-term price action. Some users utilize our news to explain sudden stock movements, while others rely on it for diligent research into potential investment opportunities.
Dive deeper into the world of trading with Timothy Sykes, renowned for his expertise in penny stocks. Explore his top picks and discover the strategies that have propelled him to success with these articles:
- Penny Stocks Trading Guide
- Best Penny Stocks Under $1 to Buy Today
- Top 8 Penny Stocks to Watch on Robinhood
Once you’ve got some stocks on watch, elevate your trading game with StocksToTrade the ultimate platform for traders. With specialized tools for swing and day trading, StocksToTrade will guide you through the market’s twists and turns.
Dig into StocksToTrade’s watchlists here:





Leave a reply