

Positive coverage of TNL Mediagene’s digital media expansion likely fuels investor optimism as stocks have been trading up by 35.74 percent.
Key Takeaways
- Shares of TNMG have slid from the $4.40 area to near $3.05, showing steady selling pressure on the daily chart.
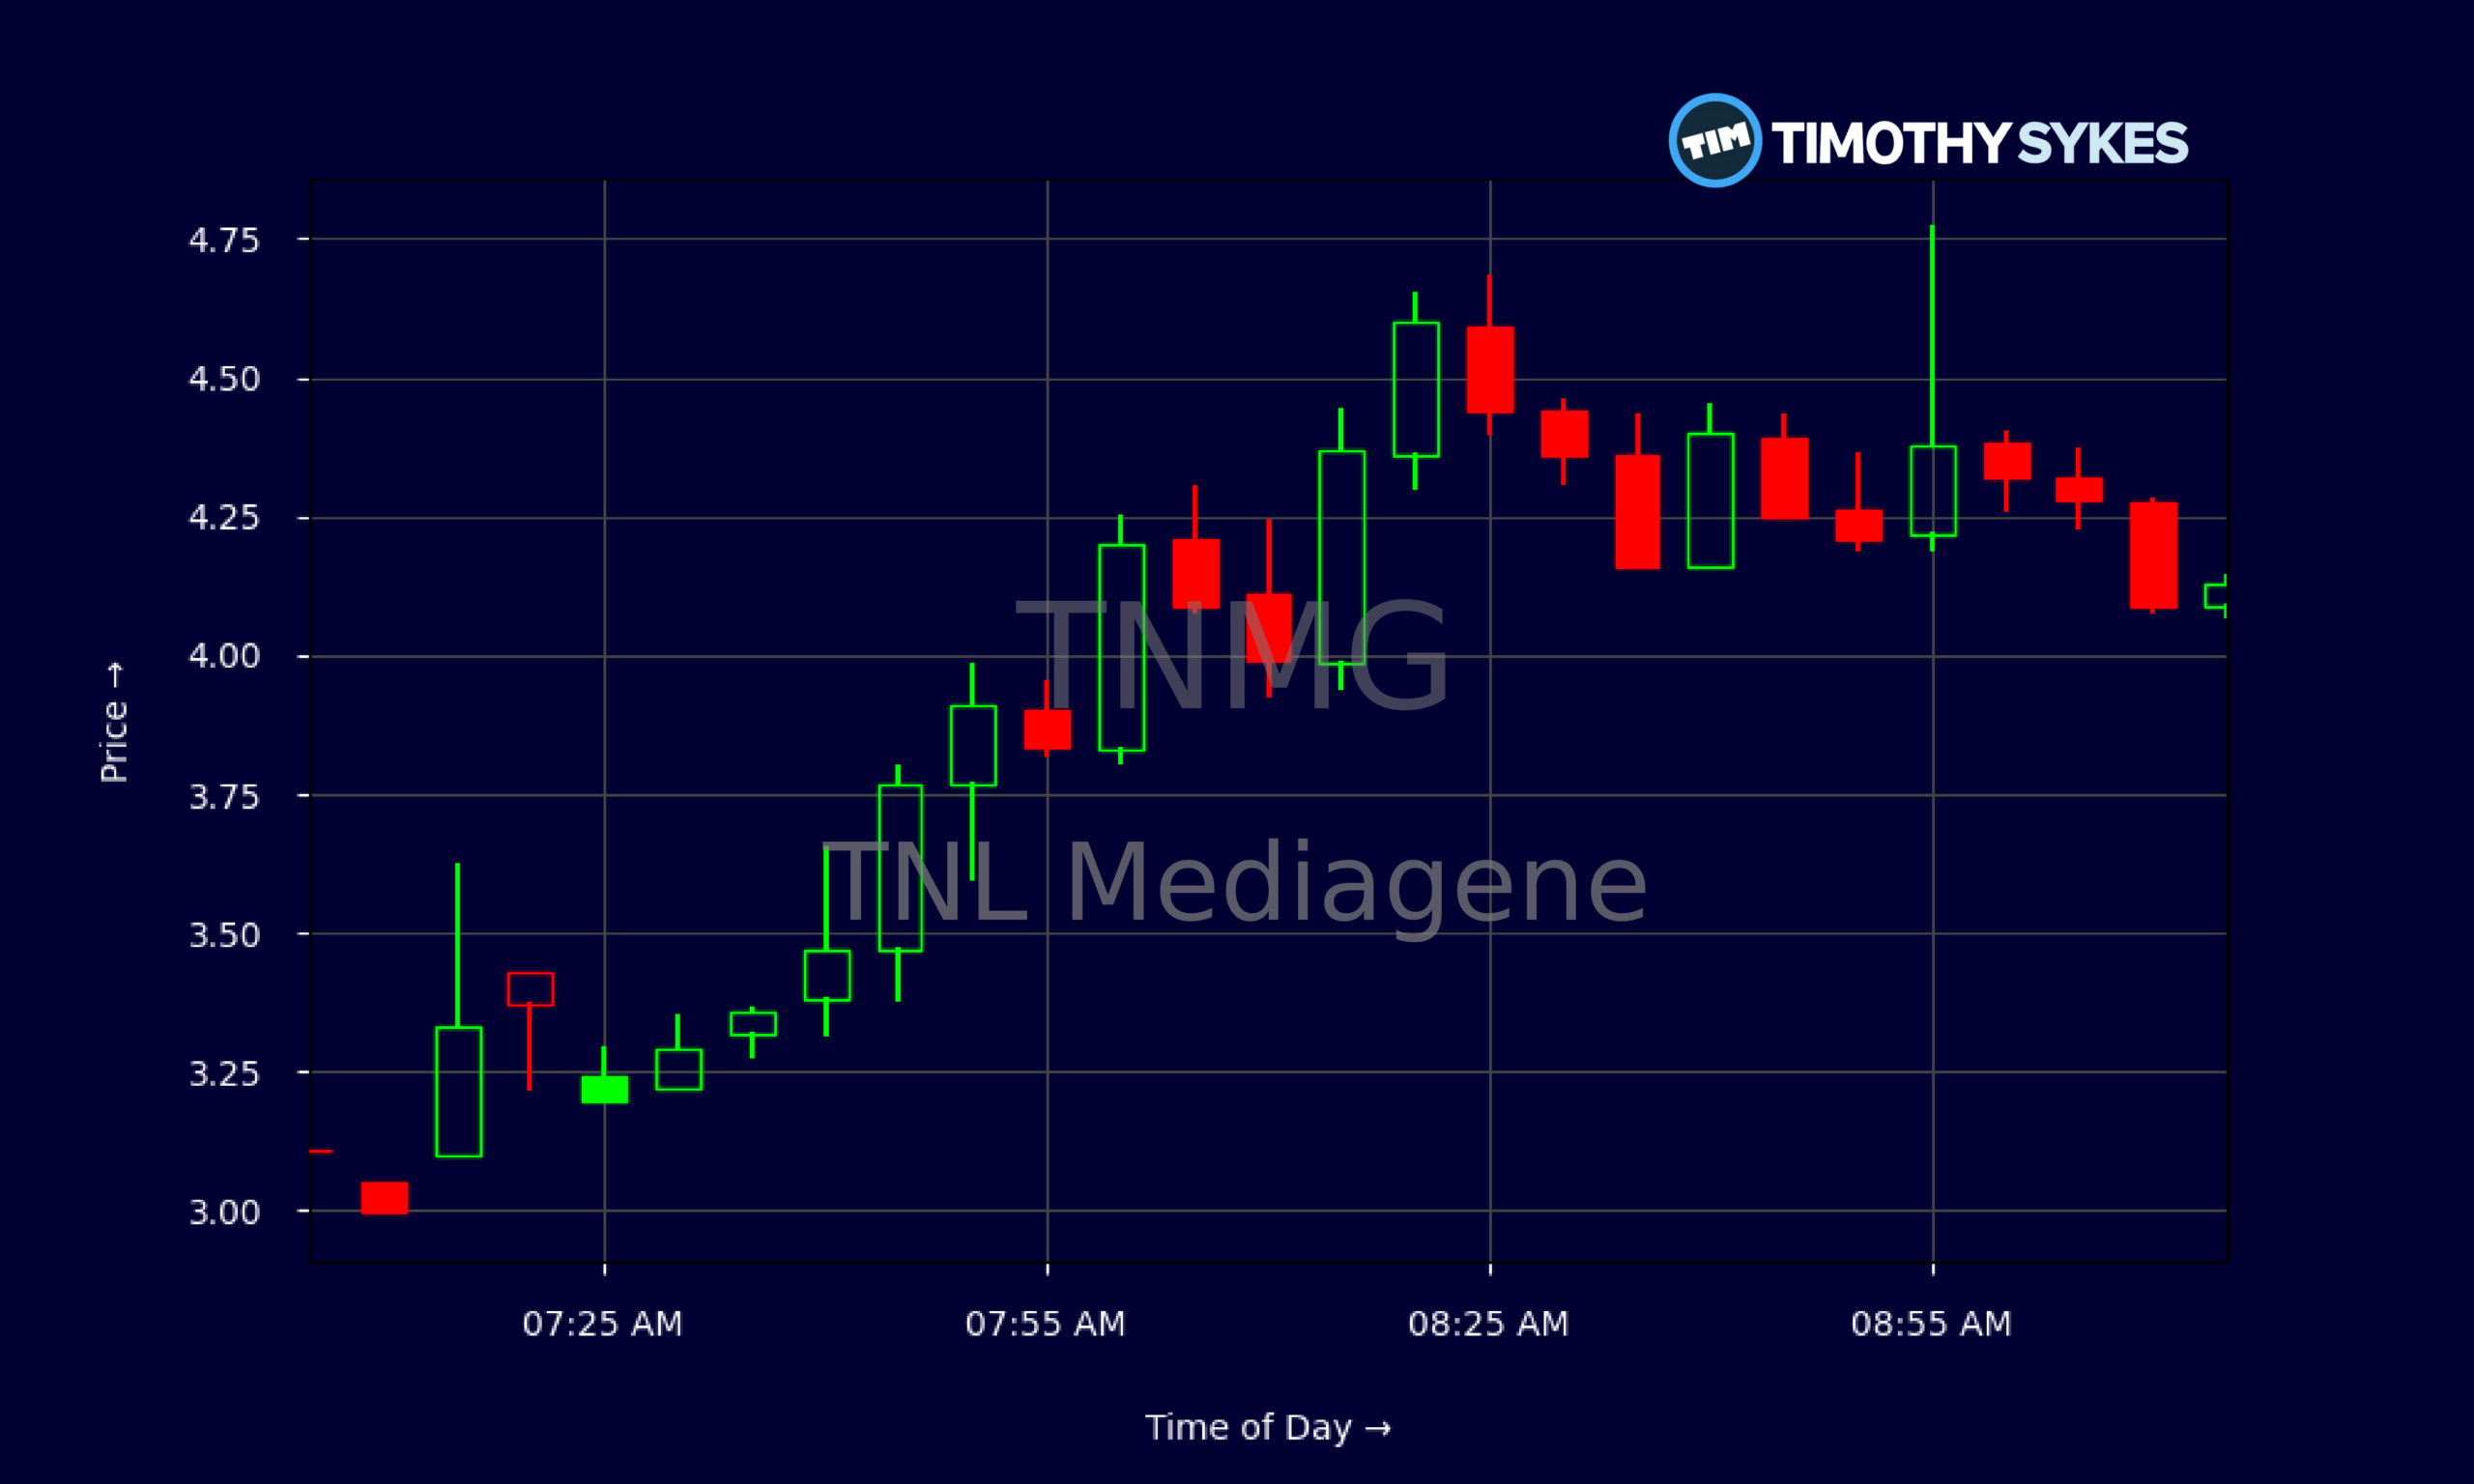
- Intraday action in TNMG recently featured a fast spike over $4.70 followed by a fade, signaling aggressive but fragile momentum trading.
- TNL Mediagene posts roughly $45.0M in annual revenue, yet trades at a very low price-to-sales ratio, catching value-focused traders’ attention.
- TNMG’s negative working capital and high leverage ratios highlight real balance sheet stress that short-term traders must respect.
Live Update At 09:19:32 EDT: On Friday, October 30, 2026 TNL Mediagene stock [NASDAQ: TNMG] is trending up by 35.74%! Discover the key drivers behind this movement as well as our expert analysis in the detailed breakdown below.
Quick Financial Overview
TNL Mediagene, trading under ticker TNMG, is a classic small-cap puzzle for active traders. On one hand, the company prints serious revenue for its size. Recent filings show about $45.0M in annual sales, which is solid for a name trading just above $3 per share. TNMG’s price-to-sales ratio sits around 0.06, telling traders the market is valuing those sales at only a small fraction of typical media or tech peers.
Book value per share is about $47.86, while TNMG stock trades at a tiny slice of that, with a price-to-book near 0.08. That kind of gap screams “deep discount,” but traders know it also often signals deep problems. The balance sheet confirms some of that stress. TNL Mediagene lists about $49.9M in total assets but roughly $49.0M in total liabilities, leaving only about $0.9M in equity and a leverage ratio over 54.
More Breaking News
Working capital is negative by about $17.5M, with current liabilities far above current assets. TNMG does have cash and short-term investments of roughly $2.9M, but current debt of about $14.2M and capital lease obligations stack pressure on the near term. For traders, TNMG is not a sleepy value play. It is a leveraged story where the chart can move fast in either direction.
Why Traders Are Watching TNMG Price Action
TNMG has been on a clear downtrend over the past few weeks, and that alone keeps short-term traders locked in. Earlier in the month, TNL Mediagene was trading in the $4.00–$4.65 range. On 261005, TNMG pushed as high as $4.65 before closing at $4.40. That marked a short-term peak. Since then, daily closes have stepped down: $4.14, $4.02, $3.76, then a grind lower into the low $3s. The latest close around $3.05 shows the stock has given back roughly 30% from those highs.
Intraday data paints an even clearer picture of TNMG’s volatility. At one point, premarket trading saw TNMG open around the mid-$3s, rip through $4.50, and briefly tag the $4.70 area before fading back under $4.20. That kind of whip is a magnet for momentum traders and scalpers. The range from $3.60s to $4.70s in under an hour shows how quickly TNL Mediagene can reward, or punish, anyone who chases.
The daily candles now show a series of lower highs and lower lows, with support near $2.90–$3.00 and former support around $3.40–$3.60 turning into resistance. For TNMG, those levels are the battlefield. Break under $2.90 with volume, and short-biased traders may press the downside. Hold $3 and reclaim $3.30–$3.40, and you could see a sharp short-covering bounce.
For active traders, TNMG is interesting precisely because the fundamentals are messy. The low valuation hints at potential mispricing, but the balance sheet risk and negative return on capital near -132% remind everyone that this is a speculation, not a safe harbor.
Conclusion
For TNL Mediagene, the story right now is all about price action versus balance sheet reality. TNMG delivers significant revenue and carries a book value that, on paper, massively exceeds its market price. Yet almost all of that book value is offset by heavy liabilities, thin equity, and negative working capital. That combination keeps long-term capital cautious while giving short-term traders plenty of volatility.
On the chart, TNMG has clearly shifted from a $4–$4.60 trading band down toward a $3–$3.30 zone. The strong intraday spikes into the mid-$4s show that buyers are still willing to take shots, but the repeated fades and the closing prices near the lows of the day tell you who has been in control lately. For now, TNMG looks like a classic “trade the range, don’t marry the stock” setup.
Traders watching TNL Mediagene should map out support near $2.90–$3.00 and resistance in the $3.40–$3.60 area, then let the volume show which side wins. As Tim Sykes loves to say, “The chart is the truth; everything else is noise.” As millionaire penny stock trader and teacher Tim Sykes, says, “Cut losses quickly, let profits ride, and don’t overtrade.”. For TNMG, that means respecting the trend, cutting losses fast, and letting the numbers on the screen lead the way. This analysis is for educational and research purposes only, and each trader must decide for themselves how, or whether, to trade TNMG.
This is stock news, not investment advice. Timothy Sykes News delivers real-time stock market news focused on key catalysts driving short-term price movements. Our content is tailored for active traders and investors seeking to capitalize on rapid price fluctuations, particularly in volatile sectors like penny stocks. Readers come to us for detailed coverage on earnings reports, mergers, FDA approvals, new contracts, and unusual trading volumes that can trigger significant short-term price action. Some users utilize our news to explain sudden stock movements, while others rely on it for diligent research into potential investment opportunities.
Dive deeper into the world of trading with Timothy Sykes, renowned for his expertise in penny stocks. Explore his top picks and discover the strategies that have propelled him to success with these articles:
- Penny Stocks Trading Guide
- Best Penny Stocks Under $1 to Buy Today
- Top 8 Penny Stocks to Watch on Robinhood
Once you’ve got some stocks on watch, elevate your trading game with StocksToTrade the ultimate platform for traders. With specialized tools for swing and day trading, StocksToTrade will guide you through the market’s twists and turns.
Dig into StocksToTrade’s watchlists here:





Leave a reply