
AXT Inc shares have been trading down by -5.27 percent amid reports of weakening demand in its semiconductor materials markets.
Key Takeaways
- AXTI shares have pulled back from the mid‑$80s toward the low‑$60s, but recent daily candles show buyers defending key support.
- The intraday tape on AXTI displays tight, grinding action around $60, signaling consolidation after a big prior run.
- AXT Inc posts roughly $88.3M in annual revenue with solid 32.2% gross margins but thin bottom‑line profits.
- AXTI carries minimal debt and a strong current ratio, giving the company room to weather volatility and fund operations.
- Traders are eyeing AXTI’s stretched valuation and recent trading range for the next momentum break, up or down.
Live Update At 09:18:51 EDT: On Thursday, October 29, 2026 AXT Inc stock [NASDAQ: AXTI] is trending down by -5.27%! Discover the key drivers behind this movement as well as our expert analysis in the detailed breakdown below.
Quick Financial Overview
AXT Inc is a classic “rich chart meets early‑stage fundamentals” story. Revenue sits around $88.3M a year, with AXTI turning about 32.2% of that into gross profit. That is healthy for a specialty materials name, and it shows AXTI can price its products with some power. But once you get past gross profit, the picture tightens fast.
Operating margin is just above 4%, and net margin runs in the low single digits. The headline P/E near 3,423 and price‑to‑sales around 35.8 tell traders one thing: the market is paying up for future growth, not current earnings. AXTI’s price‑to‑book near 5.1 and sky‑high price‑to‑free‑cash‑flow above 300 back that up.
More Breaking News
On the strength side, AXTI runs with very little leverage. Total debt‑to‑equity is roughly 0.1, with a current ratio close to 4.8 and a quick ratio near 3.6. That means AXT Inc has cash and liquid assets to cover near‑term bills multiple times over. For traders, AXTI is a high‑expectation, low‑debt growth play, where the chart often moves faster than the income statement.
Why Traders Are Watching AXTI Price Action
AXTI’s recent chart looks like the backside of a rollercoaster followed by a long, flat track. Earlier in the month, AXTI pushed into the high‑$80s, tagging an intraday high near $88.36 before momentum cooled. Since then, the stock has bled down into the low‑$60s, with closes around $64.38 on the latest daily bar.
Despite that pullback, AXTI has not cracked. Over several sessions, AXT Inc has held the low‑$50s to low‑$60s zone, staging bounces from roughly $51–$52 back into the upper‑$50s and low‑$60s. That creates a clear support band for traders. Break it, and you can see panic. Hold it, and you set up a potential squeeze as shorts lock in profits and late sellers get trapped.
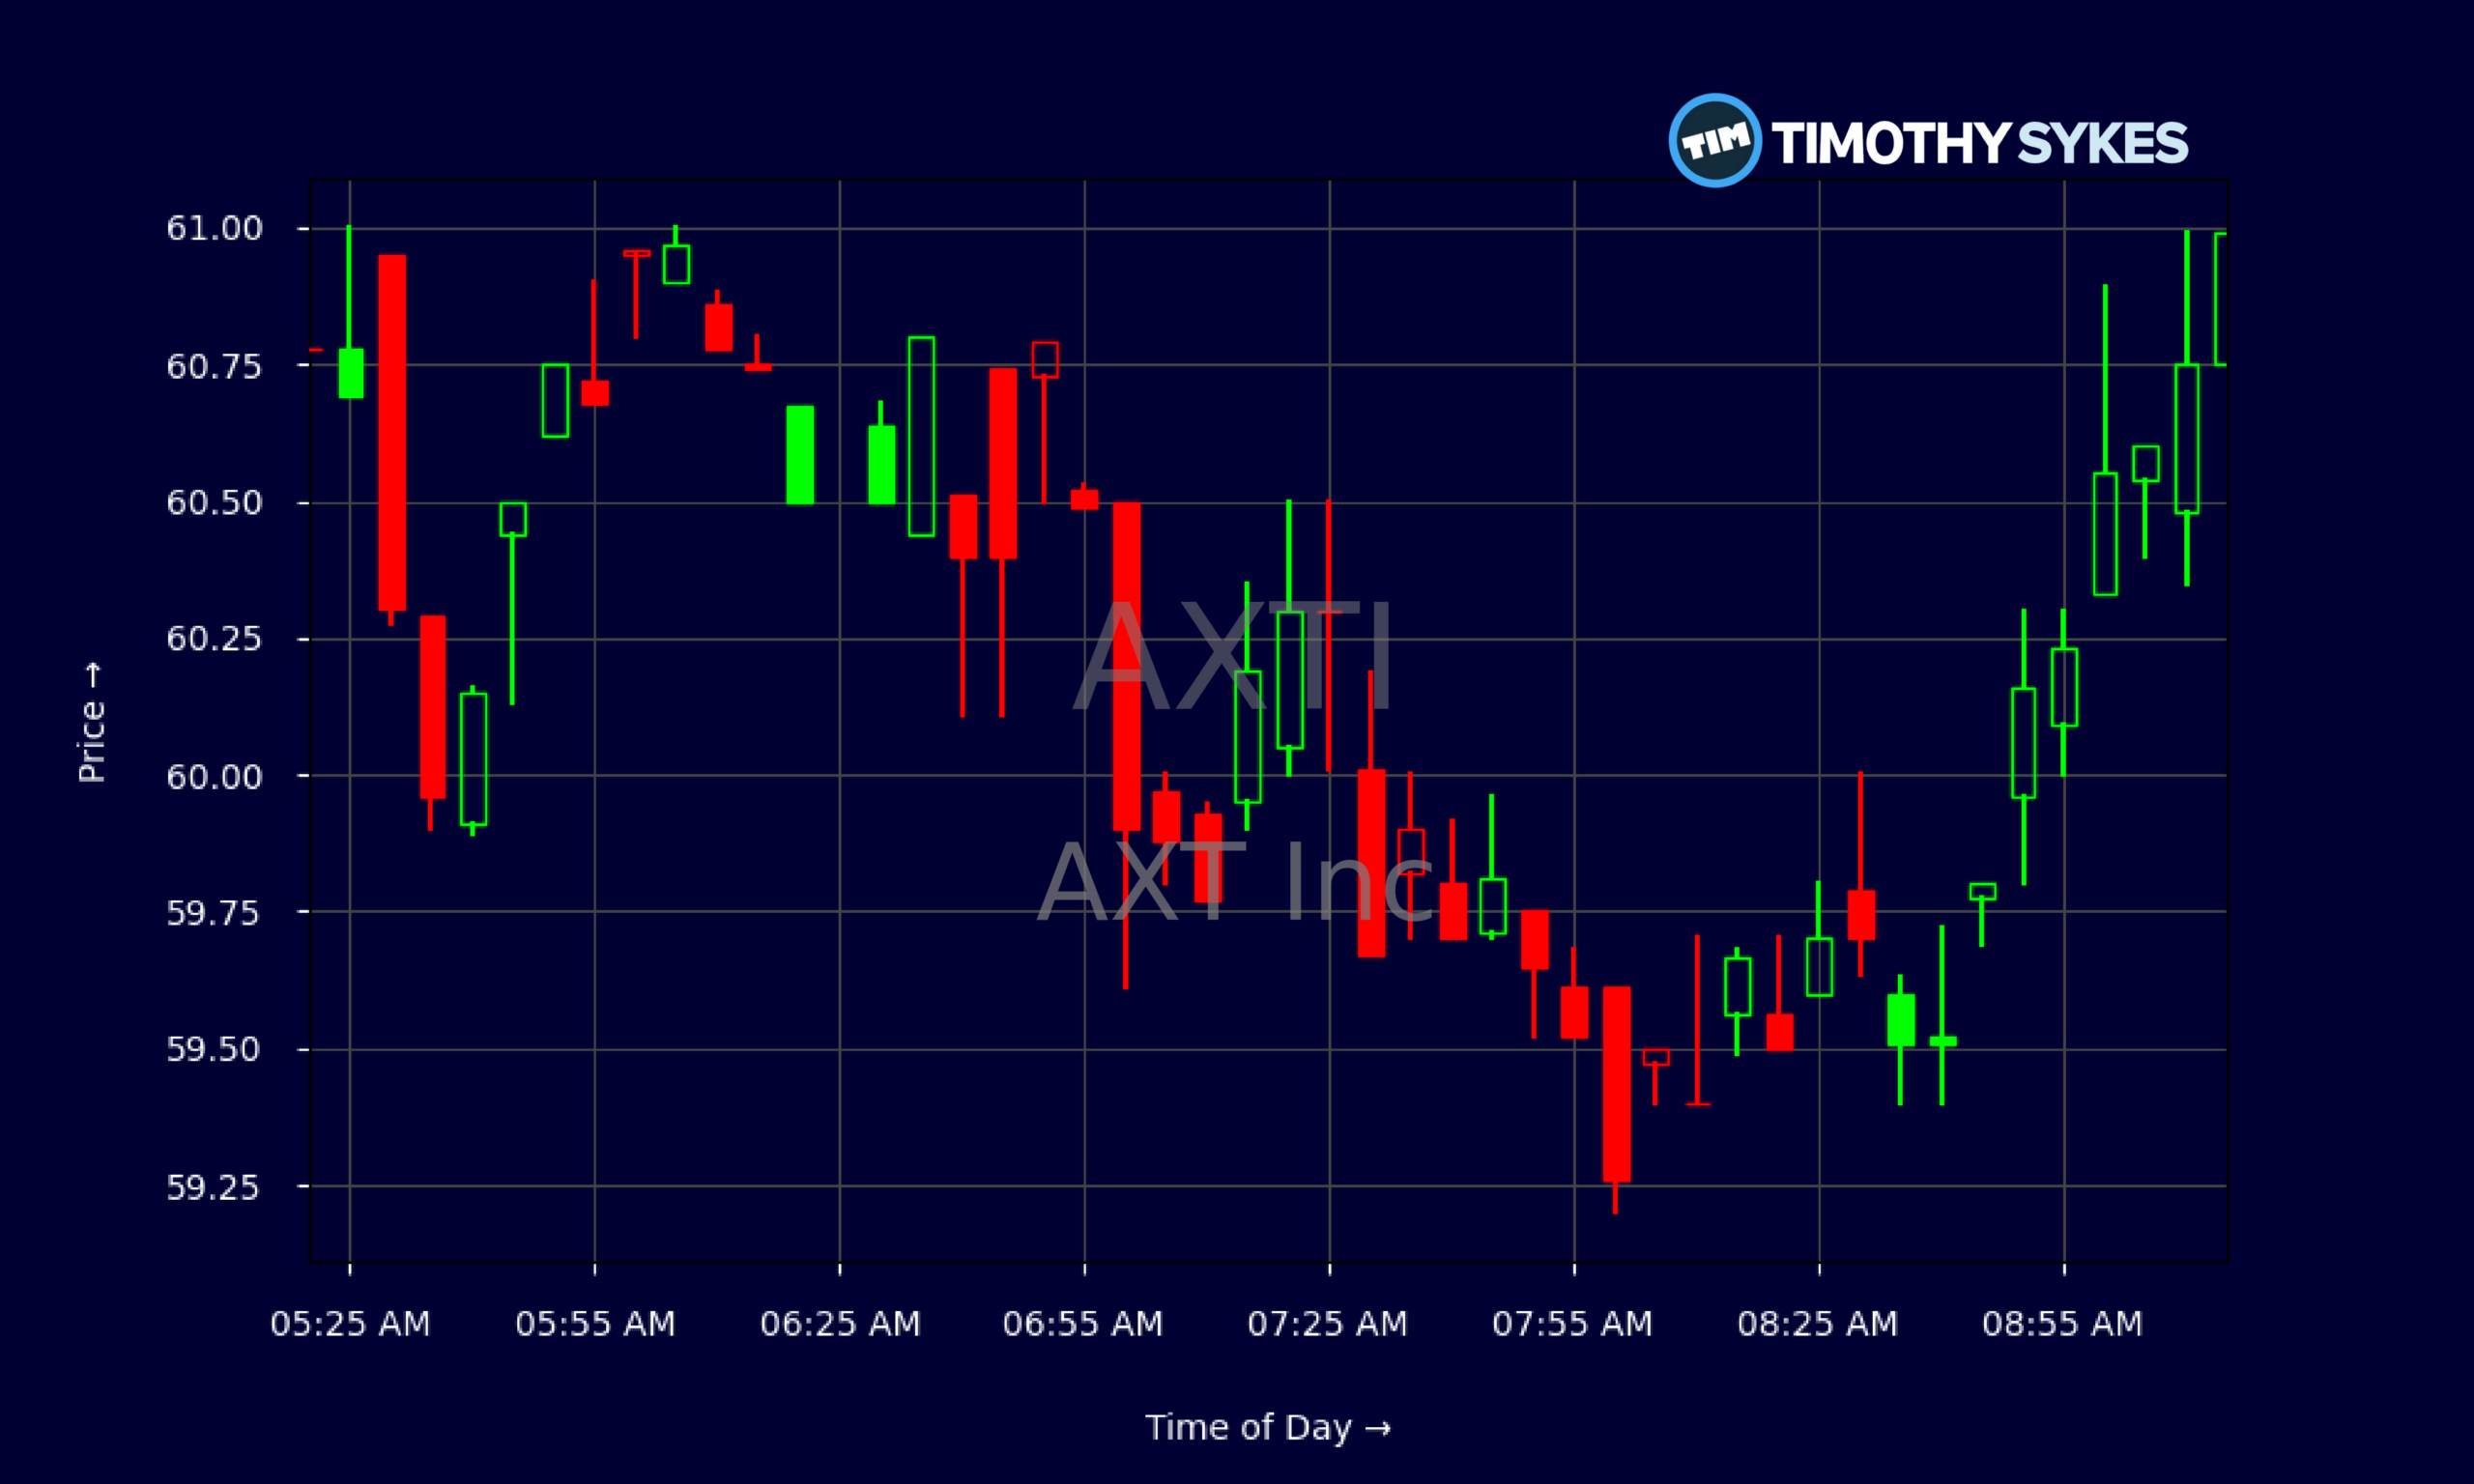
Zoom in to the intraday tape and you see AXTI trading like a stock catching its breath. From pre‑market through the open, AXTI has been chopping between roughly $59.2 and $61.4, with many five‑minute candles showing narrow ranges and closes clustering around $60. That type of sideways action after a big fade is classic consolidation.
For active traders, this is where planning matters. AXTI above $60 with rising volume can become a bounce play back toward prior resistance in the upper‑$60s and beyond. AXTI losing $59–$60 on heavy selling flips the script, opening the door for a retest of recent lows. The key is not guessing direction, but mapping the key levels and reacting as the stock shows its hand.
Conclusion
AXTI is the type of name that rewards prepared traders and punishes lazy ones. The fundamentals show a company with real revenue, strong gross margins, and a clean balance sheet, but thin profits and extreme valuation multiples. That combination means every shift in sentiment can trigger sharp trading swings, because the story is priced for strong growth.
On the chart, AXT Inc has already given a big move from the high‑$80s down into the low‑$60s. Now AXTI is stuck in a tight band around $60, with clear support below and overhead supply from recent bagholders above. This is the “study time” zone — when many traders get bored, but disciplined players dig into levels, volume, and risk.
AXTI will eventually resolve this range. Direction will show up first in the tape: a high‑volume break of $59–$60 or a strong reclaim of the mid‑$60s. Until then, smart traders stay patient, plan both scenarios, and size down if the liquidity thins out. This is exactly the type of slow, methodical process where, as millionaire penny stock trader and teacher Tim Sykes, says, “Small gains add up over time; focus on building wealth gradually, not chasing jackpots.” — a reminder that steady, repeatable trades in a choppy range can matter more than swinging for home runs.
As Tim Sykes likes to say, “The market rewards preparation, not prediction.” AXTI fits that mindset perfectly. Use AXT Inc as a case study in how to respect momentum, track key support and resistance, and keep risk tight. This is educational and research material only — not a buy or sell call — but it’s a live setup every serious trader can learn from.
This is stock news, not investment advice. Timothy Sykes News delivers real-time stock market news focused on key catalysts driving short-term price movements. Our content is tailored for active traders and investors seeking to capitalize on rapid price fluctuations, particularly in volatile sectors like penny stocks. Readers come to us for detailed coverage on earnings reports, mergers, FDA approvals, new contracts, and unusual trading volumes that can trigger significant short-term price action. Some users utilize our news to explain sudden stock movements, while others rely on it for diligent research into potential investment opportunities.
Dive deeper into the world of trading with Timothy Sykes, renowned for his expertise in penny stocks. Explore his top picks and discover the strategies that have propelled him to success with these articles:
- Penny Stocks Trading Guide
- Best Penny Stocks Under $1 to Buy Today
- Top 8 Penny Stocks to Watch on Robinhood
Once you’ve got some stocks on watch, elevate your trading game with StocksToTrade the ultimate platform for traders. With specialized tools for swing and day trading, StocksToTrade will guide you through the market’s twists and turns.
Dig into StocksToTrade’s watchlists here:





Leave a reply