

Aurora Innovation Inc. faces heightened pressure as regulatory setbacks spark investor concern, with stocks have been trading down by -11.69 percent.
Key Takeaways
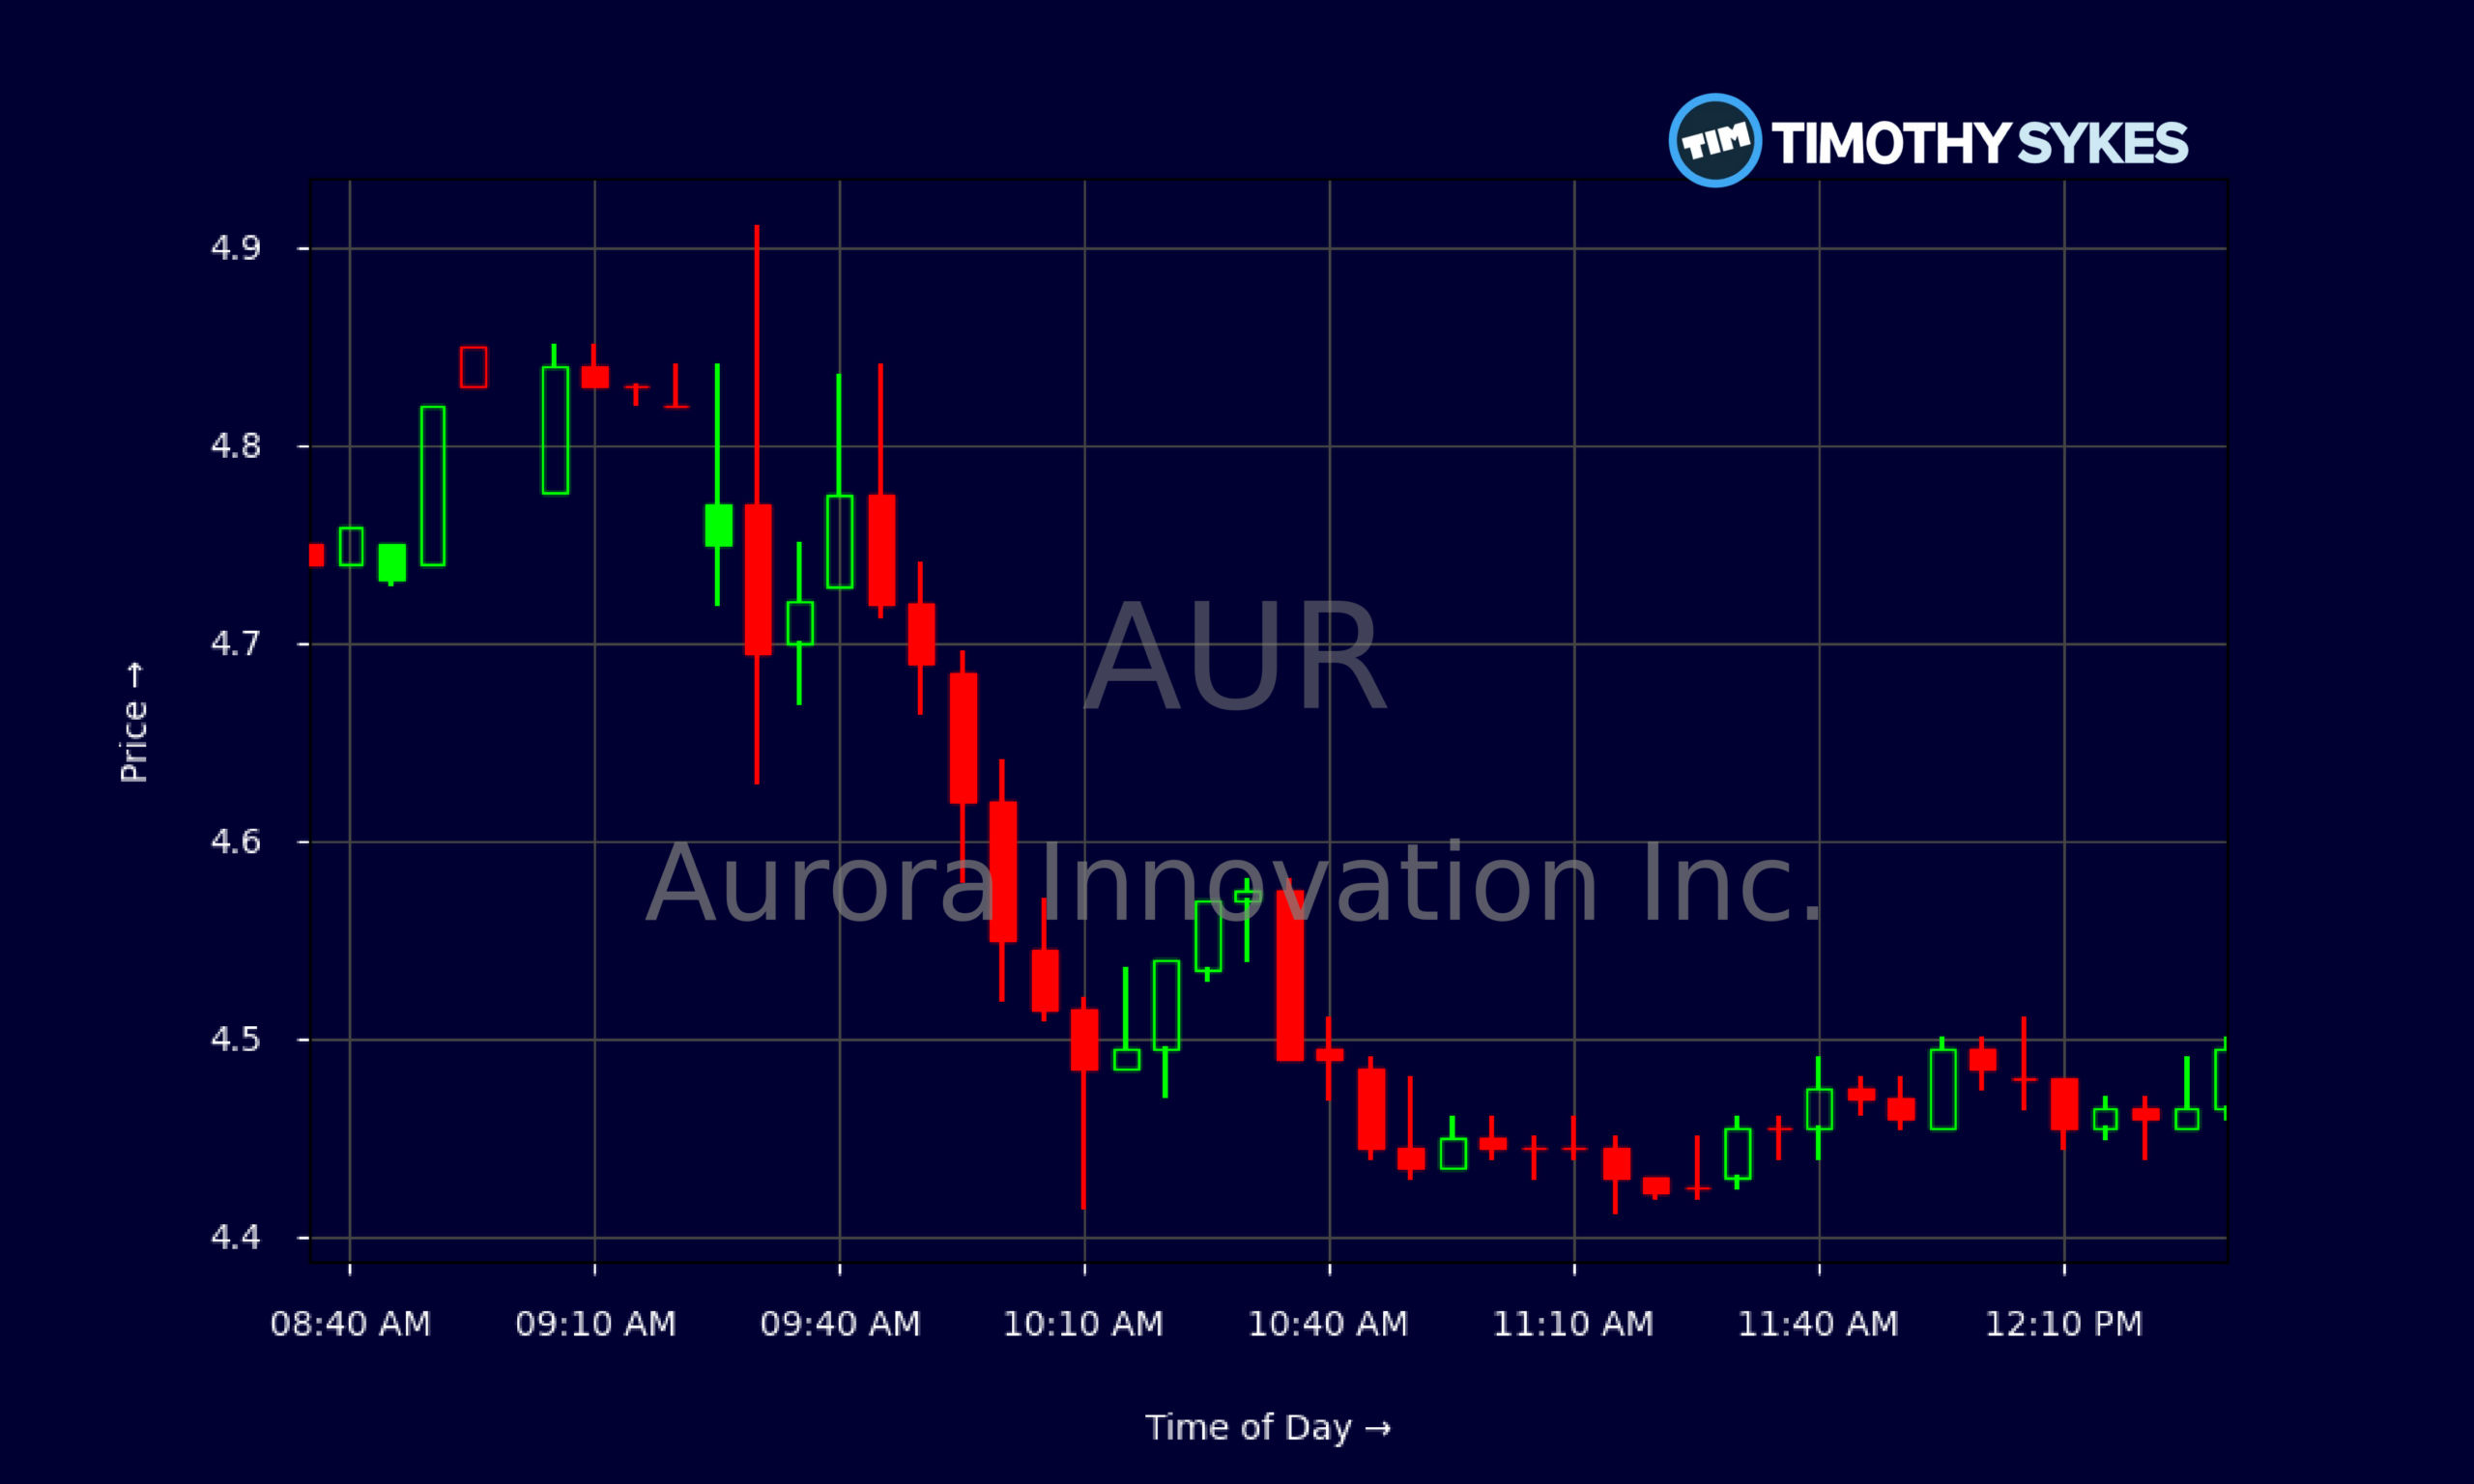
- AUR has pulled back from the mid-$5s to the mid-$4s, with recent trading showing a clear downtrend and intraday consolidation near $4.50.
- Aurora Innovation Inc. is generating only about $3.0M in quarterly revenue while posting losses above $200M, a classic high-burn pre-revenue story.
- A deep cash pile around $1.0B and minimal debt give AUR meaningful runway despite steep negative margins and heavy R&D spending.
- Traders are watching whether AUR can hold the $4.40–$4.50 zone or if the stock breaks lower toward prior support levels.
Live Update At 12:32:25 EDT: On Thursday, October 29, 2026 Aurora Innovation Inc. stock [NASDAQ: AUR] is trending down by -11.69%! Discover the key drivers behind this movement as well as our expert analysis in the detailed breakdown below.
Quick Financial Overview
Aurora Innovation Inc., trading under ticker AUR, sits in that tough early-stage zone: huge losses, tiny revenue, and a lot of hope priced in. The latest report shows just $3.0M in quarterly revenue against roughly $260.0M in total expenses. That’s why AUR is printing a net loss of about $234.0M and EBITDA of -$221.0M. The business is spending heavily to build its autonomous driving platform long before serious revenue shows up.
Margins tell the same story. AUR’s gross margin is around -400%, and profitability ratios are deeply negative across the board. That means the current business model is nowhere near breakeven. But the balance sheet looks better than the income statement. Aurora Innovation Inc. holds about $1.03B in cash and short-term investments, against only about $70.0M in long-term debt and roughly $10.0M in current debt. A current ratio above 11 shows strong near-term liquidity.
More Breaking News
For traders, this setup screams “speculative growth.” AUR has runway, but the clock is ticking as free cash flow runs about -$206.0M for the quarter. The market has to keep believing in future autonomy revenue for the stock to hold up.
Why Traders Are Watching AUR Price Support
On the chart, AUR has clearly lost altitude. Earlier in the month, Aurora Innovation Inc. shares were closing around $5.70–$5.80. Now the daily close sits near $4.50. That’s a drop of roughly 20% over a few weeks, with a pattern of lower highs and lower lows. For momentum traders, that’s a textbook short-term downtrend.
The intraday 5‑minute chart sharpens the picture. AUR opened near $4.77, tried to push toward $4.91 in the first minutes, then faded and never came close to reclaiming the open range high. Through the morning, Aurora Innovation Inc. kept grinding lower, with bounces sold off and a tight band forming around $4.45–$4.50. That kind of action signals supply overhead and a lack of aggressive dip buyers.
Zooming out, the daily data show repeated failures above $5.00 over the past couple of weeks. AUR printed highs in the $5.60s and then the $5.40s, only to roll back each time. That’s classic distribution as traders use strength to exit. Now the key battleground is the mid-$4s. If Aurora Innovation Inc. loses the $4.40–$4.45 zone with range expansion, traders will start eyeing the low-$4s or even prior major support levels.
At the same time, the huge valuation versus tiny revenue is a constant overhang. AUR’s price-to-sales ratio above 2,000 means the stock trades almost entirely on expectations. Any slip in sentiment on autonomy timelines, even at the sector level, can weigh heavily on Aurora Innovation Inc. That’s why many short-term traders are treating this as a technical chart play, not a fundamentals-driven swing.
Conclusion
Aurora Innovation Inc. is exactly the kind of name that tempts aggressive traders: big story, cutting‑edge tech, and wild numbers. AUR burns a lot of cash, posts deep losses, and still earns a multi‑billion‑dollar enterprise value. The balance sheet offers comfort for now, with more than $1.0B in liquidity and very low leverage. But the income statement reminds everyone that profitability is nowhere in sight yet.
From a trading perspective, the price action deserves respect. AUR has broken down from the $5.70–$5.80 area and is now battling to hold the mid-$4s. Intraday, Aurora Innovation Inc. shows steady selling pressure, with pops getting stuffed and VWAP acting as resistance. That favors short-biased setups and quick flips until the chart proves otherwise.
For those studying AUR, the key is to let the price guide you, not the story. As Tim Sykes likes to say, “The market doesn’t care about your opinion, only your discipline. Trade the chart, not the hype.” As millionaire penny stock trader and teacher Tim Sykes, says, “The goal is not to win every trade but to protect your capital and keep moving forward.”. Aurora Innovation Inc. will stay on many watchlists as long as volatility and volume remain elevated. The job now is to map your levels, define your risk, and remember that this is for education and research only—not a signal to buy or sell.
This is stock news, not investment advice. Timothy Sykes News delivers real-time stock market news focused on key catalysts driving short-term price movements. Our content is tailored for active traders and investors seeking to capitalize on rapid price fluctuations, particularly in volatile sectors like penny stocks. Readers come to us for detailed coverage on earnings reports, mergers, FDA approvals, new contracts, and unusual trading volumes that can trigger significant short-term price action. Some users utilize our news to explain sudden stock movements, while others rely on it for diligent research into potential investment opportunities.
Dive deeper into the world of trading with Timothy Sykes, renowned for his expertise in penny stocks. Explore his top picks and discover the strategies that have propelled him to success with these articles:
- Penny Stocks Trading Guide
- Best Penny Stocks Under $1 to Buy Today
- Top 8 Penny Stocks to Watch on Robinhood
Once you’ve got some stocks on watch, elevate your trading game with StocksToTrade the ultimate platform for traders. With specialized tools for swing and day trading, StocksToTrade will guide you through the market’s twists and turns.
Dig into StocksToTrade’s watchlists here:





Leave a reply