

Netcapital Inc. stocks have been trading up by 47.07 percent amid heightened investor optimism following recent growth-focused developments
Key Takeaways
- NCPL has dropped from the $2s to near $1, showing sharp recent selling and a clear downtrend on the daily chart.
- Intraday, Netcapital Inc. is stabilizing around the mid‑$1.50s, with tight trading ranges signaling short‑term consolidation.
- Netcapital Inc. posted about $94,000 in quarterly revenue against heavy losses, highlighting a tiny top line with major operating costs.
- NCPL’s current ratio near 0.3 and negative working capital point to real liquidity pressure that active traders must track.
- Chart volatility in NCPL, mixed with weak fundamentals, creates opportunity for nimble traders who respect risk.
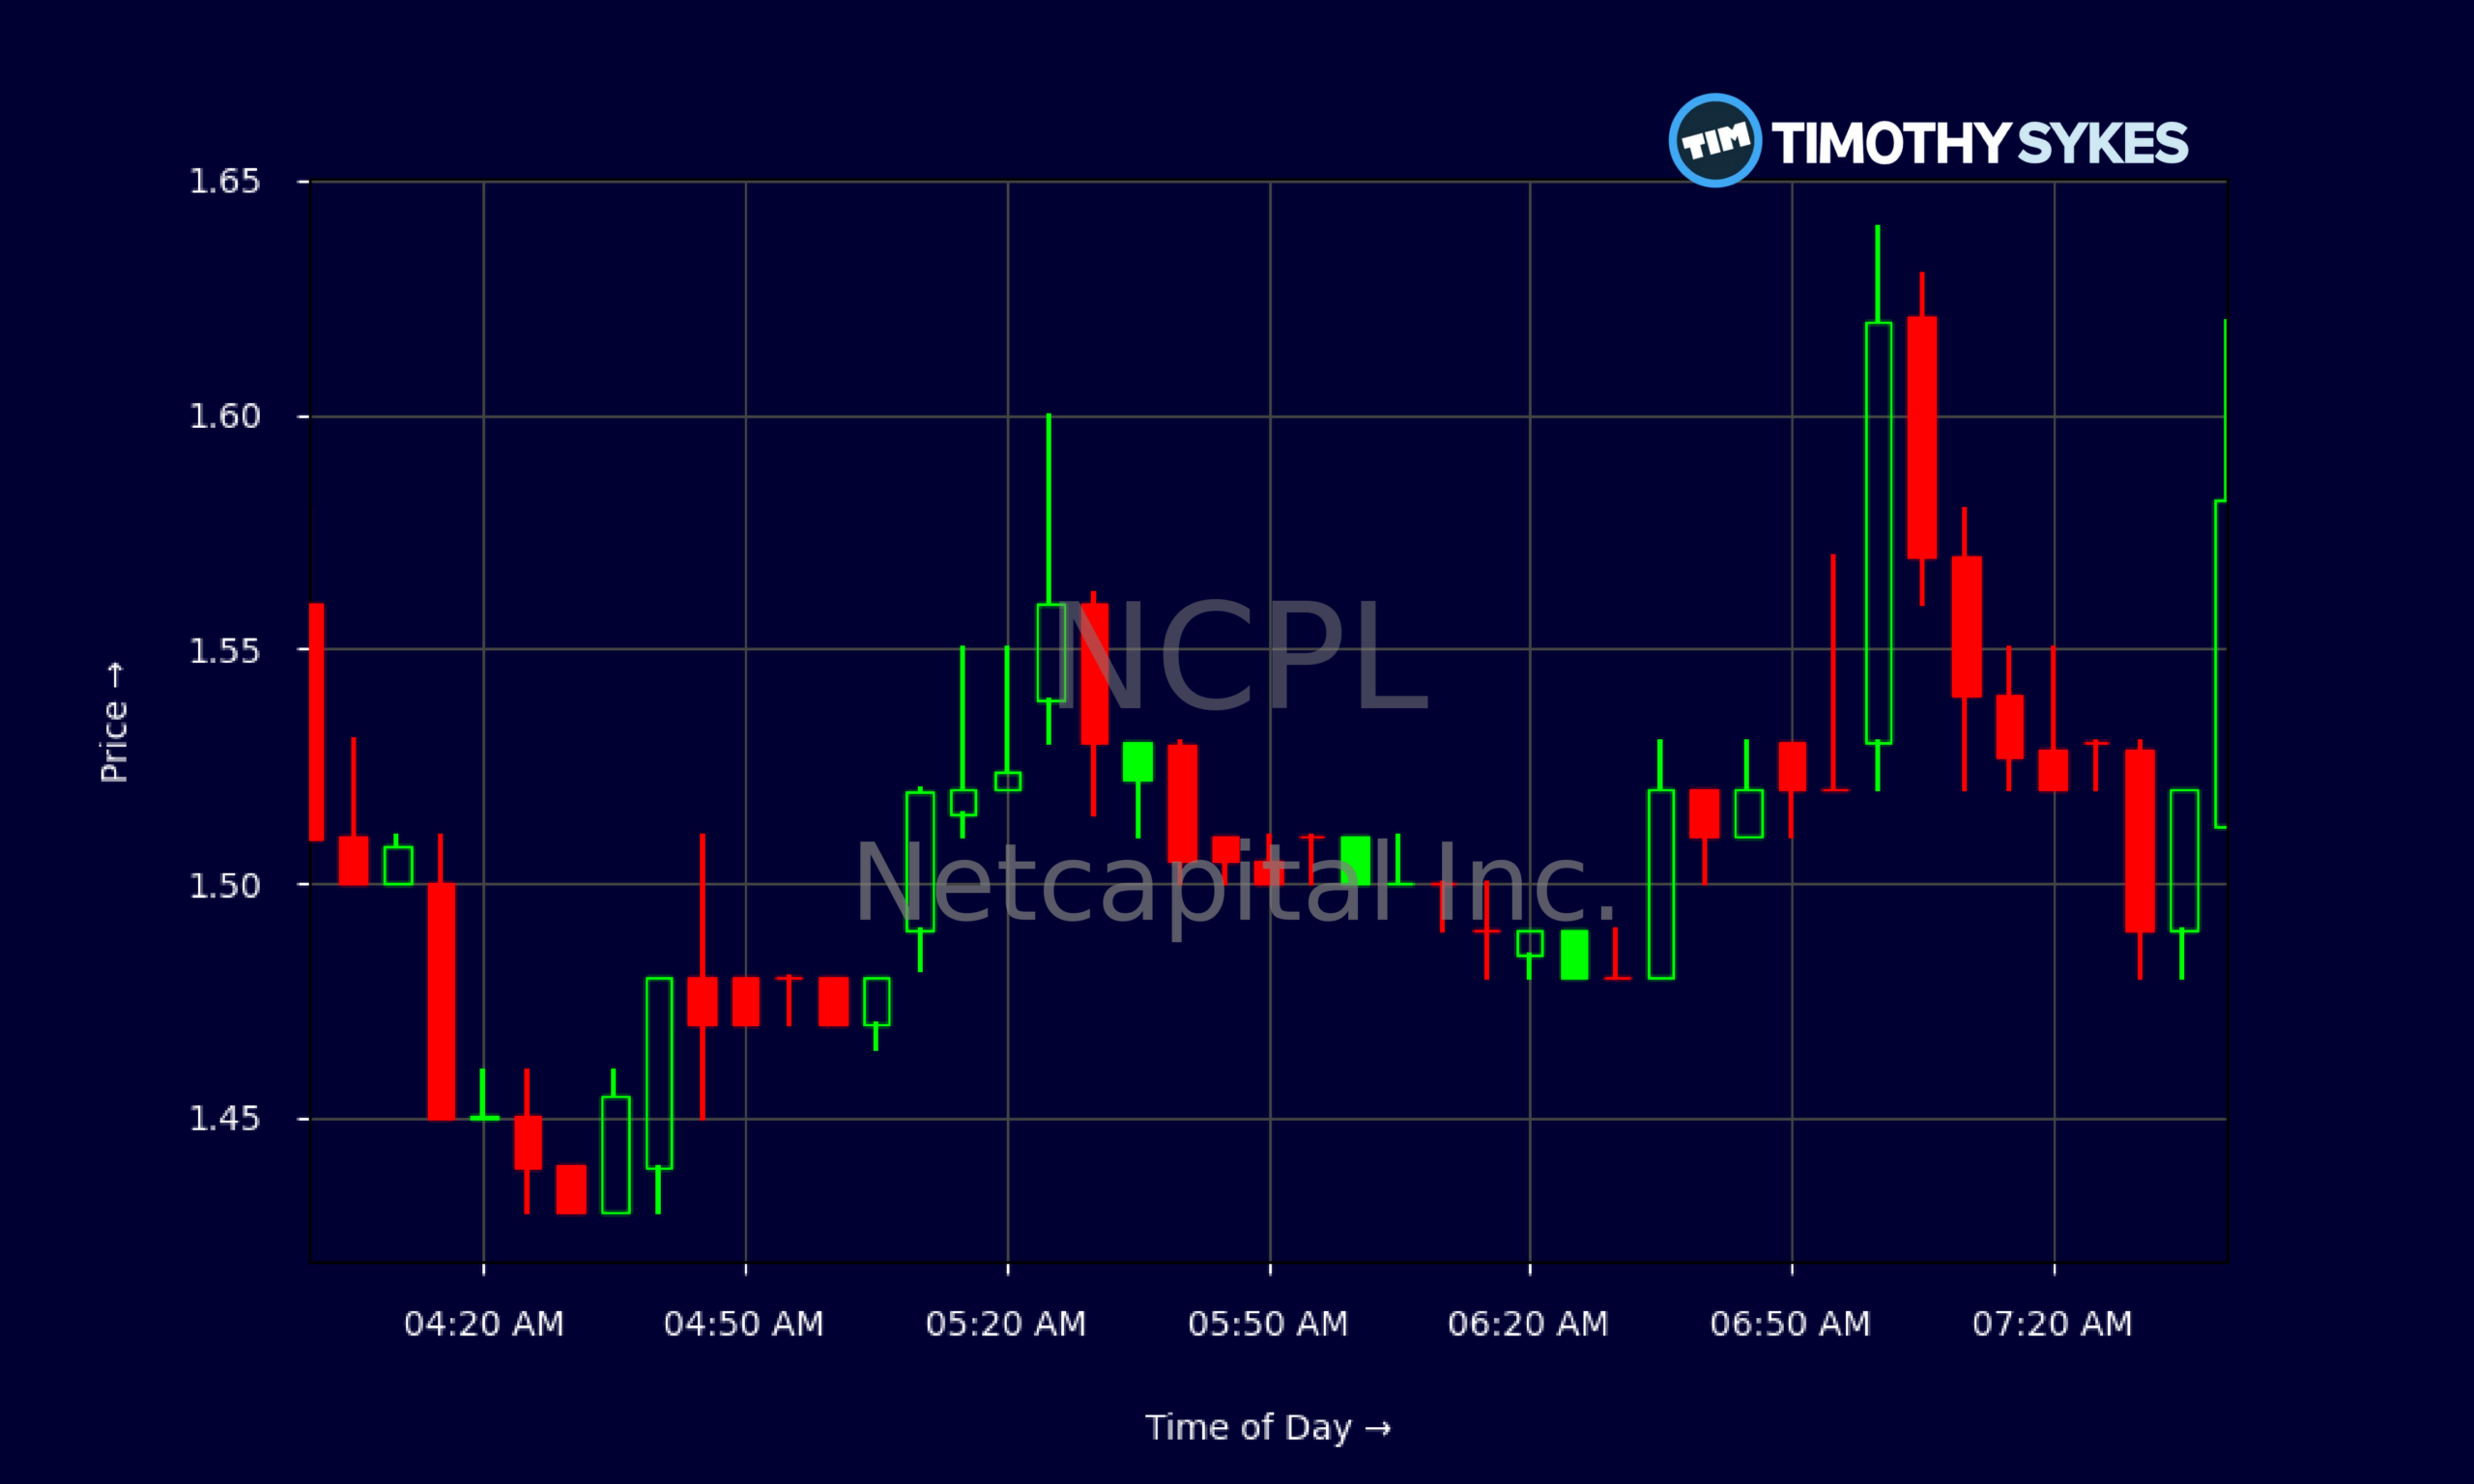
Live Update At 07:47:51 EDT: On Thursday, October 29, 2026 Netcapital Inc. stock [NASDAQ: NCPL] is trending up by 47.07%! Discover the key drivers behind this movement as well as our expert analysis in the detailed breakdown below.
Quick Financial Overview
NCPL is trading like a classic micro-cap battleground. On the daily chart, Netcapital Inc. slipped from a recent close of $2.23 on 2026/10/22 down toward the low $1s, with a close near $1.10 on 2026/10/28. That is roughly a 50% slide in a week of trading. For short-term traders, NCPL is a live example of why you never marry a penny stock trend.
Under the hood, Netcapital Inc. reported quarterly revenue of about $94,000, a tiny figure for a listed company. Against that, NCPL logged roughly $2.32M in total expenses and a net loss of about $1.81M. Profit margins are deeply negative, and key return ratios such as return on equity and return on assets are both sharply below zero. This tells traders the core business is far from breakeven.
More Breaking News
The balance sheet shows around $715,000 in cash and total assets near $26.1M, but current liabilities around $4.0M produce negative working capital of roughly -$2.9M. For NCPL, that combination — high cash burn, small revenue base, and tight liquidity — explains why the market slaps on a speculative price and why volatility stays high.
Why Traders Are Watching NCPL Price Action
NCPL draws day traders because the chart moves. Over the last several sessions, Netcapital Inc. has swung from intraday highs in the mid‑$2s down to lows close to $1.05. That kind of range is fertile ground for momentum trading, but it punishes anyone who overstays a move. The daily candles on NCPL show repeated long wicks, signaling emotional trading and aggressive stop‑hunting on both sides.
Look at the progression. NCPL closed at $2.17 on 2026/10/16, then slid to $1.59 by 2026/10/14 earlier in the series, then ripped back into the $2s, and now has faded again. Netcapital Inc. keeps offering short bursts of strength followed by heavy profit‑taking. That pattern usually reflects a stock driven more by trading flow than by fundamental conviction.
On the intraday 5‑minute chart, NCPL is now churning between roughly $1.48 and $1.63. The candles show a slow grind higher from the mid‑$1.40s to low $1.60s with many small-bodied bars. For Netcapital Inc. traders, that hints at consolidation after the big daily washout. If volume returns, NCPL can break that range and offer a new trend leg — up or down.
Fundamentally, the story keeps the pressure on. Netcapital Inc. has a price‑to‑sales ratio around 12x on less than $1M in annual revenue, plus a current ratio of about 0.3. Those numbers tell traders that NCPL relies on the market staying open and optimistic. Any hint of financing or dilution chatter often becomes a trading catalyst in names with this profile, which is why active traders monitor NCPL levels so closely.
Conclusion
For active traders, NCPL is a textbook example of a speculative small-cap where the chart controls the narrative. Netcapital Inc. has strong gross margins on paper, but the absolute revenue base is tiny and the losses are huge. Cash outflows of roughly $0.87M from operations in the latest quarter, against only about $715,000 left in cash, give NCPL limited runway without some form of capital raise or sharp business improvement.
That tension shows up in price action. NCPL has flushed from the $2s down toward $1 while intraday trading now tightens around the mid‑$1.50s. Netcapital Inc. can still attract big percentage moves off this base, but every spike will tempt short‑term traders to lock in gains quickly. For disciplined players, the key is focusing on clear intraday levels and honoring stops when NCPL fails to hold them.
As millionaire penny stock trader and teacher Tim Sykes, says, “Preparation plus patience leads to big profits.”. Tim Sykes likes to remind traders, “Patterns repeat, but you won’t be around to profit if you blow up ignoring risk.” NCPL fits that lesson perfectly. Netcapital Inc. offers volatility, liquidity, and clean intraday levels — exactly what many day traders seek. But the weak financials and cash pressure mean NCPL is a trade, not a long-term comfort blanket. Treat Netcapital Inc. as a vehicle for practice and precision, not hope.
This is stock news, not investment advice. Timothy Sykes News delivers real-time stock market news focused on key catalysts driving short-term price movements. Our content is tailored for active traders and investors seeking to capitalize on rapid price fluctuations, particularly in volatile sectors like penny stocks. Readers come to us for detailed coverage on earnings reports, mergers, FDA approvals, new contracts, and unusual trading volumes that can trigger significant short-term price action. Some users utilize our news to explain sudden stock movements, while others rely on it for diligent research into potential investment opportunities.
Dive deeper into the world of trading with Timothy Sykes, renowned for his expertise in penny stocks. Explore his top picks and discover the strategies that have propelled him to success with these articles:
- Penny Stocks Trading Guide
- Best Penny Stocks Under $1 to Buy Today
- Top 8 Penny Stocks to Watch on Robinhood
Once you’ve got some stocks on watch, elevate your trading game with StocksToTrade the ultimate platform for traders. With specialized tools for swing and day trading, StocksToTrade will guide you through the market’s twists and turns.
Dig into StocksToTrade’s watchlists here:





Leave a reply