

T1 Energy Inc. stocks have been trading up by 9.05 percent after securing a multi‑year LNG supply contract.
Key Takeaways
- TE has rebounded from a sharp slide, climbing from the low $2s to near $2.87 as T1 Energy Inc. finds short-term buyers.
- Recent intraday trading shows tight consolidation, hinting at a potential next leg once TE breaks out of its $2.70–$2.90 range.
- T1 Energy Inc. posts strong revenue near $755.3M but runs deep losses, with negative margins and heavy leverage pressuring TE longer term.
- Cash on hand and decent liquidity give TE some runway, but negative free cash flow keeps T1 Energy Inc. in “show me” mode.
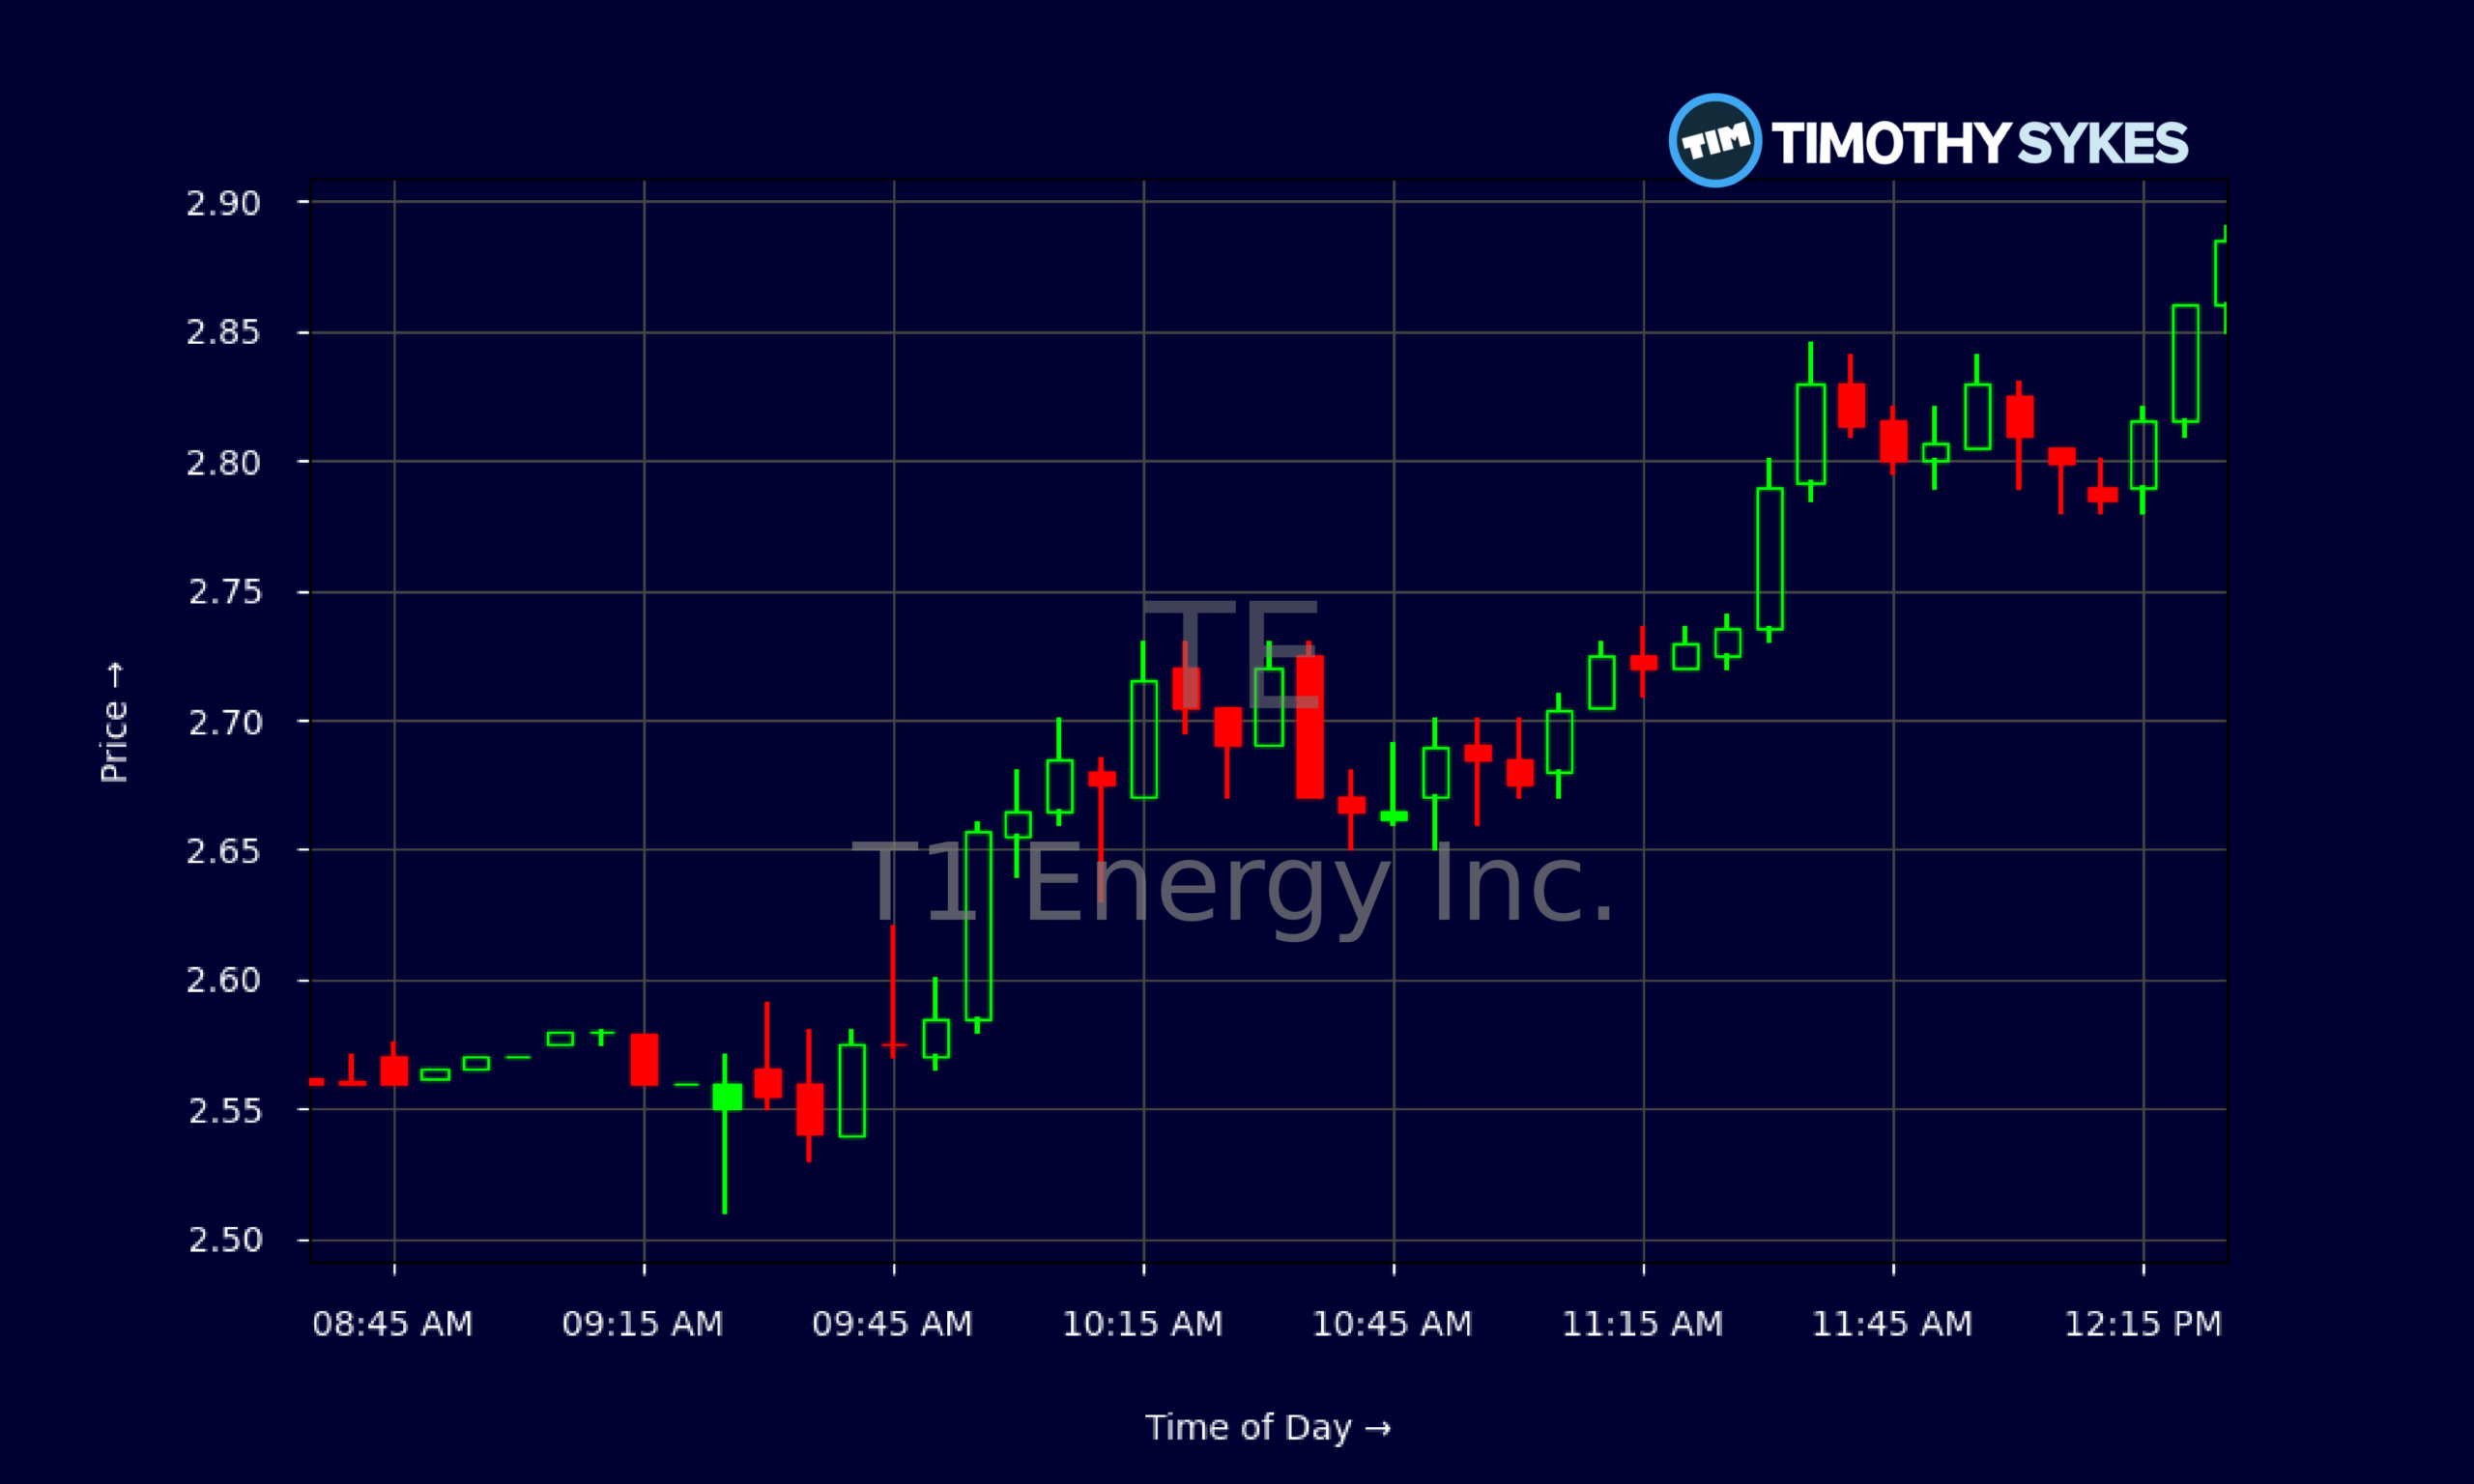
Live Update At 12:32:05 EDT: On Thursday, October 29, 2026 T1 Energy Inc. stock [NYSE: TE] is trending up by 9.05%! Discover the key drivers behind this movement as well as our expert analysis in the detailed breakdown below.
Quick Financial Overview
TE is a classic high-risk, high-reward story. On the surface, T1 Energy Inc. is not small, with revenue around $755.3M over the last year. But the quality of those sales is weak. Gross margin sits at only 8.4%, and after operating costs and interest, profit margins fall deep into the red. TE shows an EBIT margin near -28.8% and a net margin worse than -30%. That tells traders the core business is not yet self-sustaining.
The balance sheet of T1 Energy Inc. is also stretched. TE carries total liabilities of roughly $1.37B against only about $275.3M of equity, for a leverage ratio around 6. Long-term debt and lease obligations together exceed $700M, while cash and equivalents stand near $79.1M. Liquidity is mixed: a current ratio of 1.3 suggests TE can handle near-term bills, but a quick ratio of 0.3 shows heavy dependence on inventory.
More Breaking News
Cash flow paints the same story. Recent quarterly free cash flow for T1 Energy Inc. came in around -$131.2M, driven by large capital spending and negative operating cash flow. TE is still burning cash to grow and maintain operations, which keeps the stock firmly in speculative territory for active trading.
Why Traders Are Watching TE Price Action
Despite those ugly fundamentals, traders care about what TE is doing right now on the chart. Over the past few weeks, T1 Energy Inc. has pulled back hard from the mid-$3s. TE topped near $3.90–$4.00 and then slid steadily, printing lower highs until buyers finally stepped in around $2.08–$2.12. That low became a pivot. From there, T1 Energy Inc. has bounced, with TE now trading back near $2.87.
The daily chart shows that TE is trying to build a base. After that $2.08 washout, T1 Energy Inc. put together several green days in a row, moving from $2.12 to $2.63, and then to $2.87. Each push higher is coming with higher lows. For momentum traders, that pattern matters more than the income statement in the short term.
The intraday 5‑minute chart backs this up. TE opened the day around $2.56 and held that premarket level, then climbed steadily into the high $2.80s. T1 Energy Inc. traded in a tight band between roughly $2.70 and $2.89 for most of the session. That kind of controlled grind higher is what you see when dip buyers quietly accumulate shares and shorts get cautious.
The key technical zone now is the recent resistance band around $2.90–$3.00. If TE can push through that level with volume, T1 Energy Inc. has room to retest the earlier $3.20–$3.40 area. If it fails, traders will watch support near $2.60 and then $2.30. For now, the message from the tape is simple: T1 Energy Inc. is off the lows, but not out of the woods.
Conclusion
For active traders, TE is a lesson in the clash between fundamentals and price action. On one side, T1 Energy Inc. shows weak profitability, heavy leverage, and negative free cash flow. That backdrop usually caps how far a rally can run before the market demands real progress. On the other side, the chart is sending a different, shorter‑term message. TE has clearly bounced from its lows, and T1 Energy Inc. is building a tight consolidation zone where breakouts and breakdowns can happen fast.
This is exactly the type of setup the trading community around TE tends to study. Clear levels. Strong prior trend. Real volatility. The downside is also obvious: if broader energy sentiment cools or funding becomes harder, T1 Energy Inc. has little margin for error.
The way to handle a name like TE is to stay data‑driven and disciplined. Respect the chart, but never forget the balance sheet. As Tim Sykes loves to remind traders, “Cut losses quickly, that’s how you survive.” As millionaire penny stock trader and teacher Tim Sykes, says, “Small gains add up over time; focus on building wealth gradually, not chasing jackpots.”. With T1 Energy Inc., that means using tight risk levels, focusing on liquid moves, and treating every trade as an educational opportunity rather than a long‑term promise. This article is for educational and research purposes only, and TE remains a speculative trading vehicle, not a comfort stock.
This is stock news, not investment advice. Timothy Sykes News delivers real-time stock market news focused on key catalysts driving short-term price movements. Our content is tailored for active traders and investors seeking to capitalize on rapid price fluctuations, particularly in volatile sectors like penny stocks. Readers come to us for detailed coverage on earnings reports, mergers, FDA approvals, new contracts, and unusual trading volumes that can trigger significant short-term price action. Some users utilize our news to explain sudden stock movements, while others rely on it for diligent research into potential investment opportunities.
Dive deeper into the world of trading with Timothy Sykes, renowned for his expertise in penny stocks. Explore his top picks and discover the strategies that have propelled him to success with these articles:
- Penny Stocks Trading Guide
- Best Penny Stocks Under $1 to Buy Today
- Top 8 Penny Stocks to Watch on Robinhood
Once you’ve got some stocks on watch, elevate your trading game with StocksToTrade the ultimate platform for traders. With specialized tools for swing and day trading, StocksToTrade will guide you through the market’s twists and turns.
Dig into StocksToTrade’s watchlists here:





Leave a reply