

SoFi Technologies Inc. stocks have been trading up by 3.67 percent after strong earnings and upbeat guidance lifted investor confidence.
Key Takeaways Traders Need To Know
- Q3 results from SoFi Technologies crushed expectations on both adjusted EPS and revenue, as SOFI continued to add members and products across its digital finance platform.
- Management raised its FY26 outlook, targeting $5.04B in adjusted revenue, $1.66B in adjusted EBITDA, and $840M in adjusted net income, signaling confidence in SOFI’s profit ramp.
- Longer term, SOFI issued FY27 guidance above Street estimates, with $6.4B in revenue, $0.90 in adjusted EPS, and margin expansion across the board.
- Major Wall Street firms including Citi, Scotiabank, StoneX, and Monness Crespi boosted price targets on SoFi Technologies after the quarter, citing record performance and an inflection in earnings power.
- The company also pushed deeper into fintech innovation and cross‑sell by integrating Prudential life insurance into the SOFI app and launching SoFi Earn, a tokenized, FDIC‑backed deposit paying 4.40% APY.
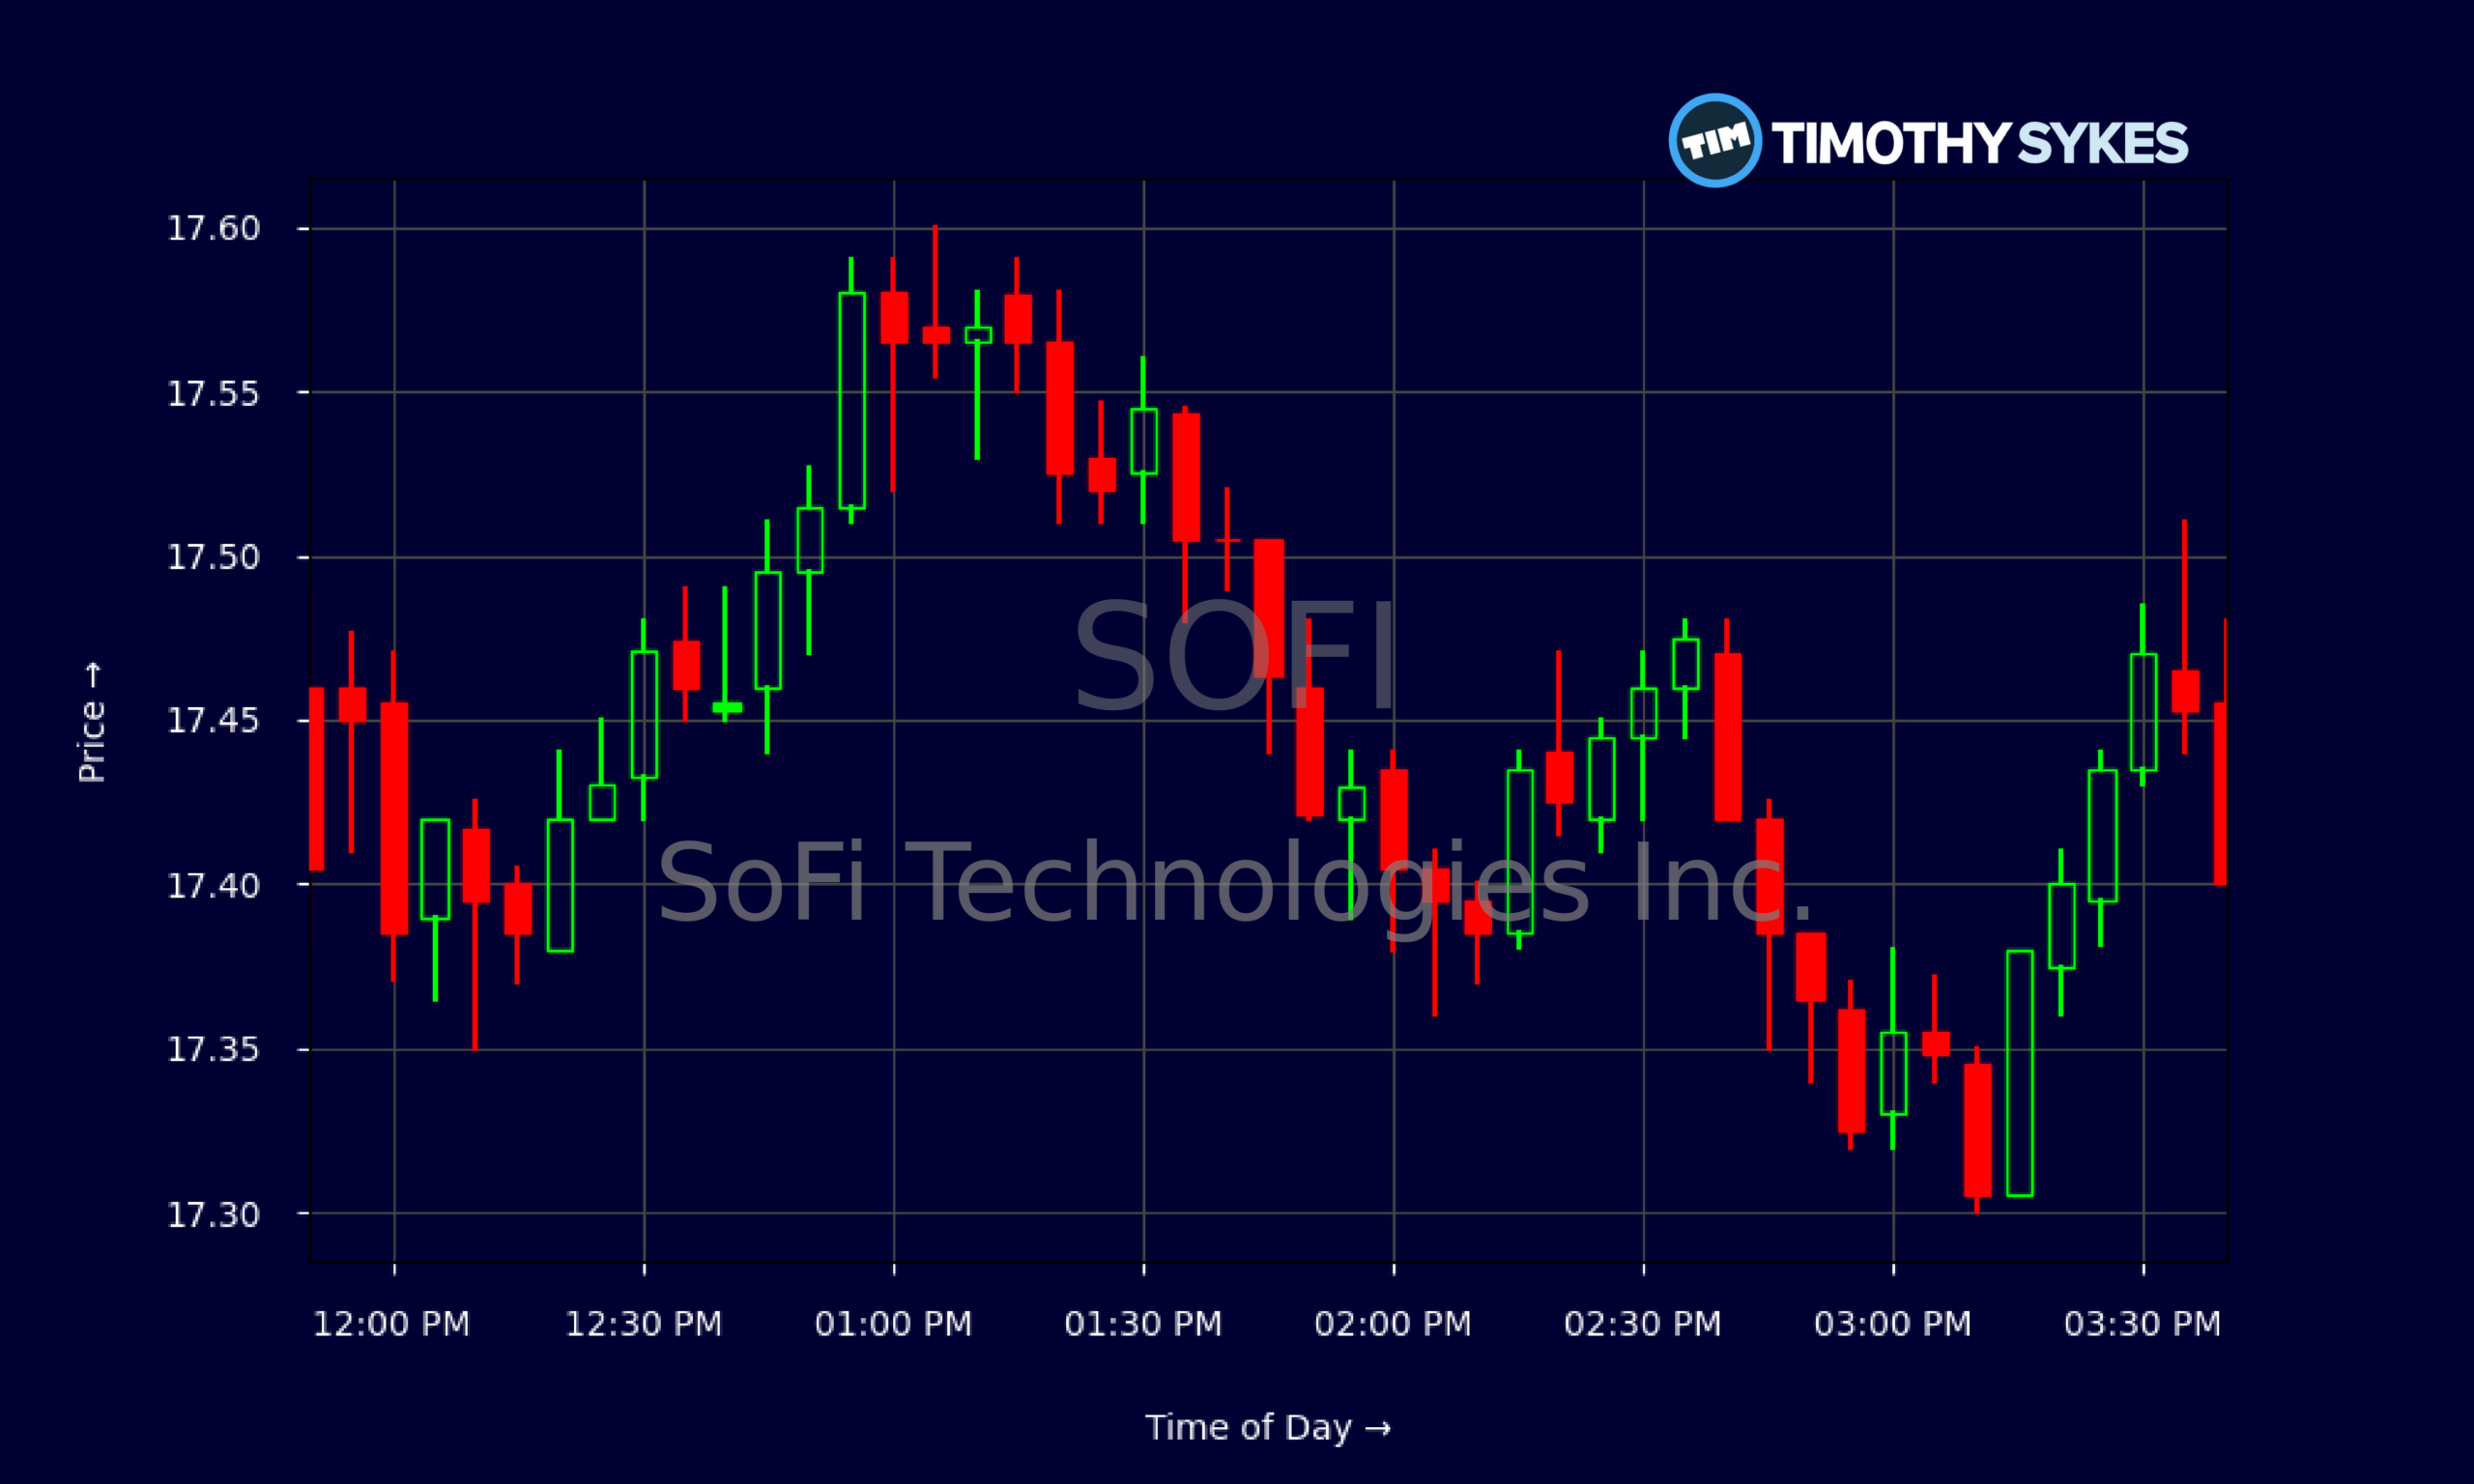
Live Update At 15:47:08 EST: On Wednesday, November 04, 2026 SoFi Technologies Inc. stock [NASDAQ: SOFI] is trending up by 3.67%! Discover the key drivers behind this movement as well as our expert analysis in the detailed breakdown below.
Quick Financial Overview
SOFI has been trading like a momentum name, but the latest numbers show there is real substance behind the move. In Q3, SoFi Technologies reported adjusted EPS of $0.18, ahead of the $0.16–$0.17 consensus range, and revenue of roughly $1.385B–$1.39B versus expectations near $1.25B–$1.26B. That is a meaningful beat on both the top and bottom line, and it comes with continued member and product growth inside the SOFI ecosystem.
Over the last few weeks, the daily chart shows SOFI grinding higher from the mid‑$14s to above $17. On 2026/11/04, SOFI closed near $17.39 after touching an intraday high of $17.74, extending a multi‑day uptrend from its 2026/10/16 low around $14.55. That is a strong percentage move in a short window.
Intraday, the 5‑minute chart is showing tight consolidation between roughly $17.30 and $17.50 for much of the afternoon, a classic digestion pattern after a run. For active traders, that kind of sideways action at higher prices often sets up the next push if volume returns.
More Breaking News
Fundamentally, SoFi Technologies is now generating about $3.61B in annual revenue with revenue growth above 30% over three years. A price‑to‑sales ratio around 4.7 and a P/E near 32.2 tell traders the market is already paying up for growth and a growing profit profile. Leverage looks manageable with total debt‑to‑equity of 0.31, and return on equity above 7% shows SOFI’s banking model is starting to translate scale into earnings.
Why Traders Are Watching SOFI Right Now
The SOFI story in late 2026 is all about a shift from “can they ever make money?” to “how far can margins go?” That shift is powering the latest breakout in SoFi Technologies stock. Q3 was the catalyst: SOFI beat on adjusted EPS at $0.18 and revenue near $1.39B, then immediately raised its 2026 outlook and laid out fresh 2027 targets.
For 2026, SoFi Technologies now expects $5.04B in adjusted revenue, about 40% year‑over‑year growth, paired with $1.66B in adjusted EBITDA, a 33% margin. Management is also guiding to around $840M in adjusted net income and $0.61 in adjusted EPS, modestly above prior Street models. For traders, that guidance matters more than the beat itself; it says management is willing to be judged on higher numbers.
Then SOFI went a step further. For 2027, SoFi Technologies is projecting $6.4B in revenue, ~27% annual growth, and adjusted EPS of $0.90 versus roughly $0.82 expected. Targeted adjusted EBITDA margins of ~35% and adjusted net income margins near 20% put SOFI into “scaled fintech” territory if delivered.
The market’s reaction has been loud. Following the earnings beat and guidance hike, SoFi Technologies jumped more than 10%, on top of a prior 13.4% surge, and still showed an additional 0.6% premarket gain the next session. That is aggressive repricing.
Analysts have lined up behind the move. Citi reiterated a Buy on SOFI with a $30 price target, flagging resilient credit performance even with high rates and growth beyond pure balance‑sheet lending. Scotiabank called it a record quarter, bumped its target to $26, and highlighted accelerating revenue and stronger credit metrics. StoneX raised its SoFi Technologies target from $25 to $27 and labeled early 2027 guidance an “inflection point,” while Monness Crespi pushed its target to $22 after the beats and multi‑year outlook. For short‑term traders, that kind of broad Wall Street support often acts as fuel for momentum.
At the same time, SoFi Technologies keeps widening its product moat. The integration of Prudential’s SimplyTerm life insurance into the SOFI app plugs 15.8M members directly into term life quotes and purchases in minutes, boosting monetization per user. The launch of SoFi Earn, a tokenized, FDIC‑backed deposit (SOFIE) paying 4.40% APY and convertible 1:1 into SoFiUSD for crypto and blockchain transfers, shows SoFi Technologies leaning into the overlap of traditional banking and digital assets. That blend of growth, guidance, and product innovation explains why SOFI is on so many trading screens.
Conclusion
For active traders, SOFI is now a textbook example of what happens when a crowded story finally delivers on profits. SoFi Technologies has moved from hope to execution: a clean Q3 beat on both revenue and adjusted EPS, higher 2026 guidance, and 2027 numbers that forced analysts to rewrite their spreadsheets. The price action — double‑digit gains followed by steady consolidation above prior resistance — reflects that reset.
But elevated expectations cut both ways. With Wall Street targets on SoFi Technologies now stretching from the low‑$20s up to $30, the bar for future quarters is higher. Any stumble on credit quality, growth, or margins will matter more than it did a year ago. That is why traders in the Tim Sykes community focus so much on charts and liquidity around catalysts like this. As millionaire penny stock trader and teacher Tim Sykes, says, “It’s not about how much money you make; it’s about how much money you keep.” — a reminder that trade planning, cutting losses quickly, and locking in gains matter just as much as catching the hot ticker.
SOFI’s expanding ecosystem — from Prudential life insurance inside the app to the SoFi Earn tokenized deposit product — gives the company more levers to drive revenue per member and keep users inside the SoFi Technologies funnel. That sort of “super‑app” strategy can support the long‑term story, but the tape remains the final judge in the short term.
As Tim Sykes likes to remind traders, “The market doesn’t care about your opinion, only about price action and risk management.” With SOFI, the price action is bullish, the story is hot, and the risk is that the crowd now expects near‑perfect execution. For educational and research purposes, this is exactly the kind of setup worth studying — strong numbers, strong narrative, and a chart that’s finally backing it all up.
This is stock news, not investment advice. Timothy Sykes News delivers real-time stock market news focused on key catalysts driving short-term price movements. Our content is tailored for active traders and investors seeking to capitalize on rapid price fluctuations, particularly in volatile sectors like penny stocks. Readers come to us for detailed coverage on earnings reports, mergers, FDA approvals, new contracts, and unusual trading volumes that can trigger significant short-term price action. Some users utilize our news to explain sudden stock movements, while others rely on it for diligent research into potential investment opportunities.
Dive deeper into the world of trading with Timothy Sykes, renowned for his expertise in penny stocks. Explore his top picks and discover the strategies that have propelled him to success with these articles:
- Penny Stocks Trading Guide
- Best Penny Stocks Under $1 to Buy Today
- Top 8 Penny Stocks to Watch on Robinhood
Once you’ve got some stocks on watch, elevate your trading game with StocksToTrade the ultimate platform for traders. With specialized tools for swing and day trading, StocksToTrade will guide you through the market’s twists and turns.
Dig into StocksToTrade’s watchlists here:





Leave a reply