
Curis Inc. stocks have been trading up by 142.33 percent amid heightened optimism from its most promising clinical trial developments.
Key Takeaways
- Curis Inc. filed a preliminary proxy statement (Form PRE 14A) for an upcoming shareholder meeting.
- The CRIS proxy lays out routine governance items, including director elections and compensation approvals.
- The filing may also ask shareholders to approve changes to share authorization.
- Traders are watching CRIS price action as the stock breaks out from sub‑$1 levels on heavy volatility.
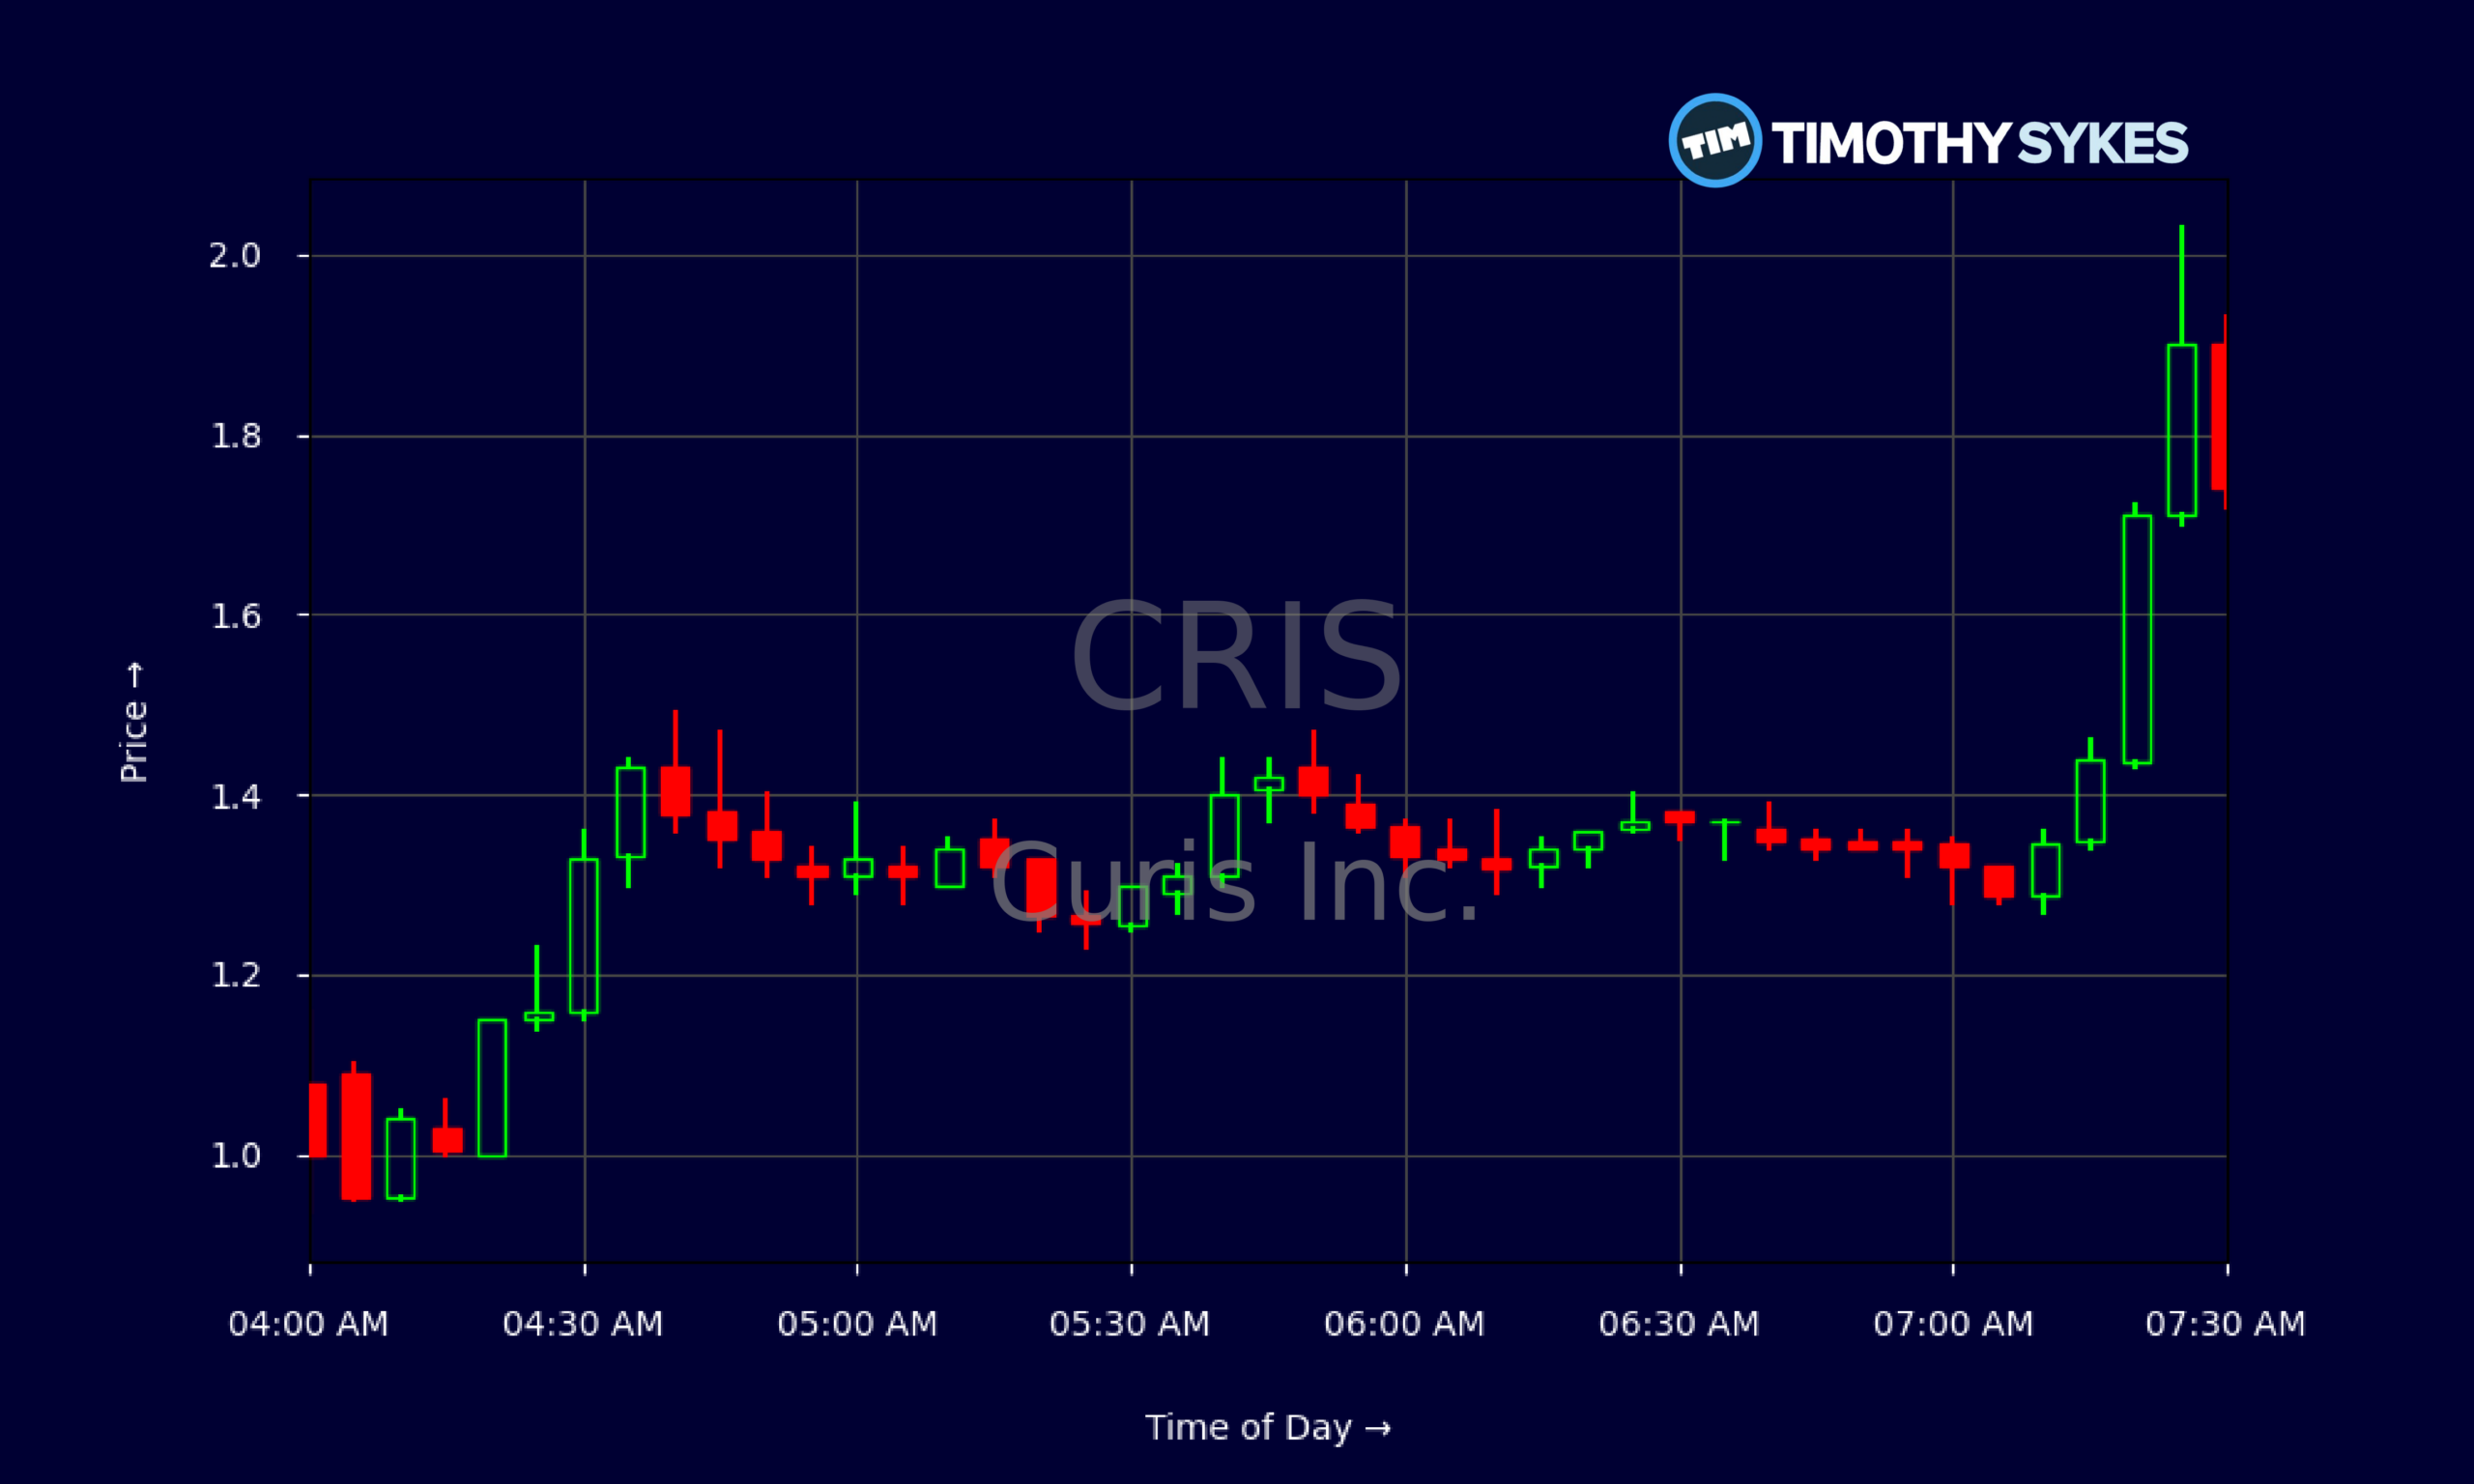
Live Update At 07:32:46 EST: On Wednesday, November 04, 2026 Curis Inc. stock [NASDAQ: CRIS] is trending up by 142.33%! Discover the key drivers behind this movement as well as our expert analysis in the detailed breakdown below.
Quick Financial Overview
CRIS has turned into a classic low‑priced battleground name. On the daily chart, Curis Inc. spent most of the recent stretch grinding under $0.70, then ripped to an intraday high of $1.50 on 2026/11/03 before closing near $0.71. That’s wild expansion in both range and volume, and it tells traders that CRIS has become a momentum playground.
From a fundamentals angle, Curis Inc. is still deep in the red. Recent quarterly revenue sits around $9.4M, but CRIS carries profit margins near negative 490%. In plain English, the company is burning far more cash than it brings in. The latest quarter shows net income of about -$8.6M and operating cash flow around -$9.6M, with ending cash near $5.6M. That gives CRIS a limited runway unless new funding shows up.
More Breaking News
The balance sheet is tight. Curis Inc. has roughly $18.9M in total assets, $14.3M in liabilities, and negative working capital of about -$6.9M. Liquidity ratios around 0.5 on the current ratio and 0.4 on the quick ratio warn that CRIS has little cushion. For traders, this mix — weak fundamentals, low float pricing, and violent price swings — screams “trading vehicle,” not long‑term safety.
Why Traders Are Watching CRIS Governance Moves
The headline news is not a flashy drug result or buyout rumor. Curis Inc. simply filed a preliminary proxy statement, the Form PRE 14A, ahead of its next shareholder meeting. On paper, that sounds boring. But for active traders who live in names like CRIS, these governance filings can quietly set the stage for big moves later.
The Curis Inc. proxy lays out the menu of items shareholders will vote on: electing directors, approving compensation plans, and other routine corporate housekeeping. None of that changes the science pipeline tomorrow. However, CRIS may also include requests to adjust share authorization. That’s where traders perk up. More authorized shares often hint at future capital raises or strategic flexibility — both critical for a cash‑hungry biotech like Curis Inc.
Combine that with the chart. CRIS exploded from roughly $0.40–$0.60 in mid‑October to a spike high of $1.50 before fading. Pre‑market intraday data shows CRIS surging from around $1.00 at 04:10 to above $1.90 by 07:30, with constant 5‑minute swings of $0.05–$0.20. That’s textbook volatility for day trading.
Governance news alone is neutral. But when a stock like Curis Inc. already trades near the bottom of its historical range, every hint of a funding path or structural change feeds the narrative. Momentum traders don’t wait for confirmation from fundamentals; they react to price, liquidity, and headlines. CRIS now has all three in play — a fresh PRE 14A, visible dilution risk, and a breakout chart that rewards tight risk management.
Conclusion
CRIS sits at the crossroads of governance housekeeping and high‑octane trading. Curis Inc. is running heavy losses, burning around $9M in operating cash in the latest quarter and holding only about $5.6M in cash. Negative working capital and weak liquidity ratios show that Curis Inc. likely needs more capital down the road. That’s exactly why the Form PRE 14A matters — any tweak to share authorization tells traders how CRIS might refill the tank.
At the same time, the chart is doing what traders dream about. CRIS has jumped from sub‑$0.50 levels to intraday prints near $1.50 and pre‑market spikes close to $2.00, all within a tight window. That kind of range rewards disciplined entries and punishes hesitation. Curis Inc. is showing that even routine filings can become narrative fuel once price starts moving.
For active traders, the play is not about predicting where CRIS will be in three years. It’s about respecting the volatility, understanding the funding overhang signaled by the proxy, and trading the pattern — not the story. As Tim Sykes likes to say, “Patterns repeat, but you’ve got to be prepared to strike when they appear.” As millionaire penny stock trader and teacher Tim Sykes says, “Preparation plus patience leads to big profits.” CRIS is giving that pattern right now; the rest is up to your planning, rules, and discipline. This is educational and research content only, not investment advice.
This is stock news, not investment advice. Timothy Sykes News delivers real-time stock market news focused on key catalysts driving short-term price movements. Our content is tailored for active traders and investors seeking to capitalize on rapid price fluctuations, particularly in volatile sectors like penny stocks. Readers come to us for detailed coverage on earnings reports, mergers, FDA approvals, new contracts, and unusual trading volumes that can trigger significant short-term price action. Some users utilize our news to explain sudden stock movements, while others rely on it for diligent research into potential investment opportunities.
Dive deeper into the world of trading with Timothy Sykes, renowned for his expertise in penny stocks. Explore his top picks and discover the strategies that have propelled him to success with these articles:
- Penny Stocks Trading Guide
- Best Penny Stocks Under $1 to Buy Today
- Top 8 Penny Stocks to Watch on Robinhood
Once you’ve got some stocks on watch, elevate your trading game with StocksToTrade the ultimate platform for traders. With specialized tools for swing and day trading, StocksToTrade will guide you through the market’s twists and turns.
Dig into StocksToTrade’s watchlists here:





Leave a reply