
OneConstruction Group Limited stocks have been trading up by 88.99 percent amid strong investor optimism from recent positive construction sector headlines.
Market Insights For ONEG Traders
- Price exploded intraday from below $0.90 to a $1.79 high, signaling aggressive short-term momentum.
- Weekly chart shows a sharp move from a tight $0.78–$0.82 range into a $1.85 spike, then a pullback to $1.48.
- Revenue of about $49.36M against an enterprise value near $25.51M suggests the market still prices in execution risk.
- Thin equity of $0.28M versus $36.62M in liabilities makes leverage and cash collection key risk points.
- Traders are watching whether recent gains hold above prior $0.80 consolidation.
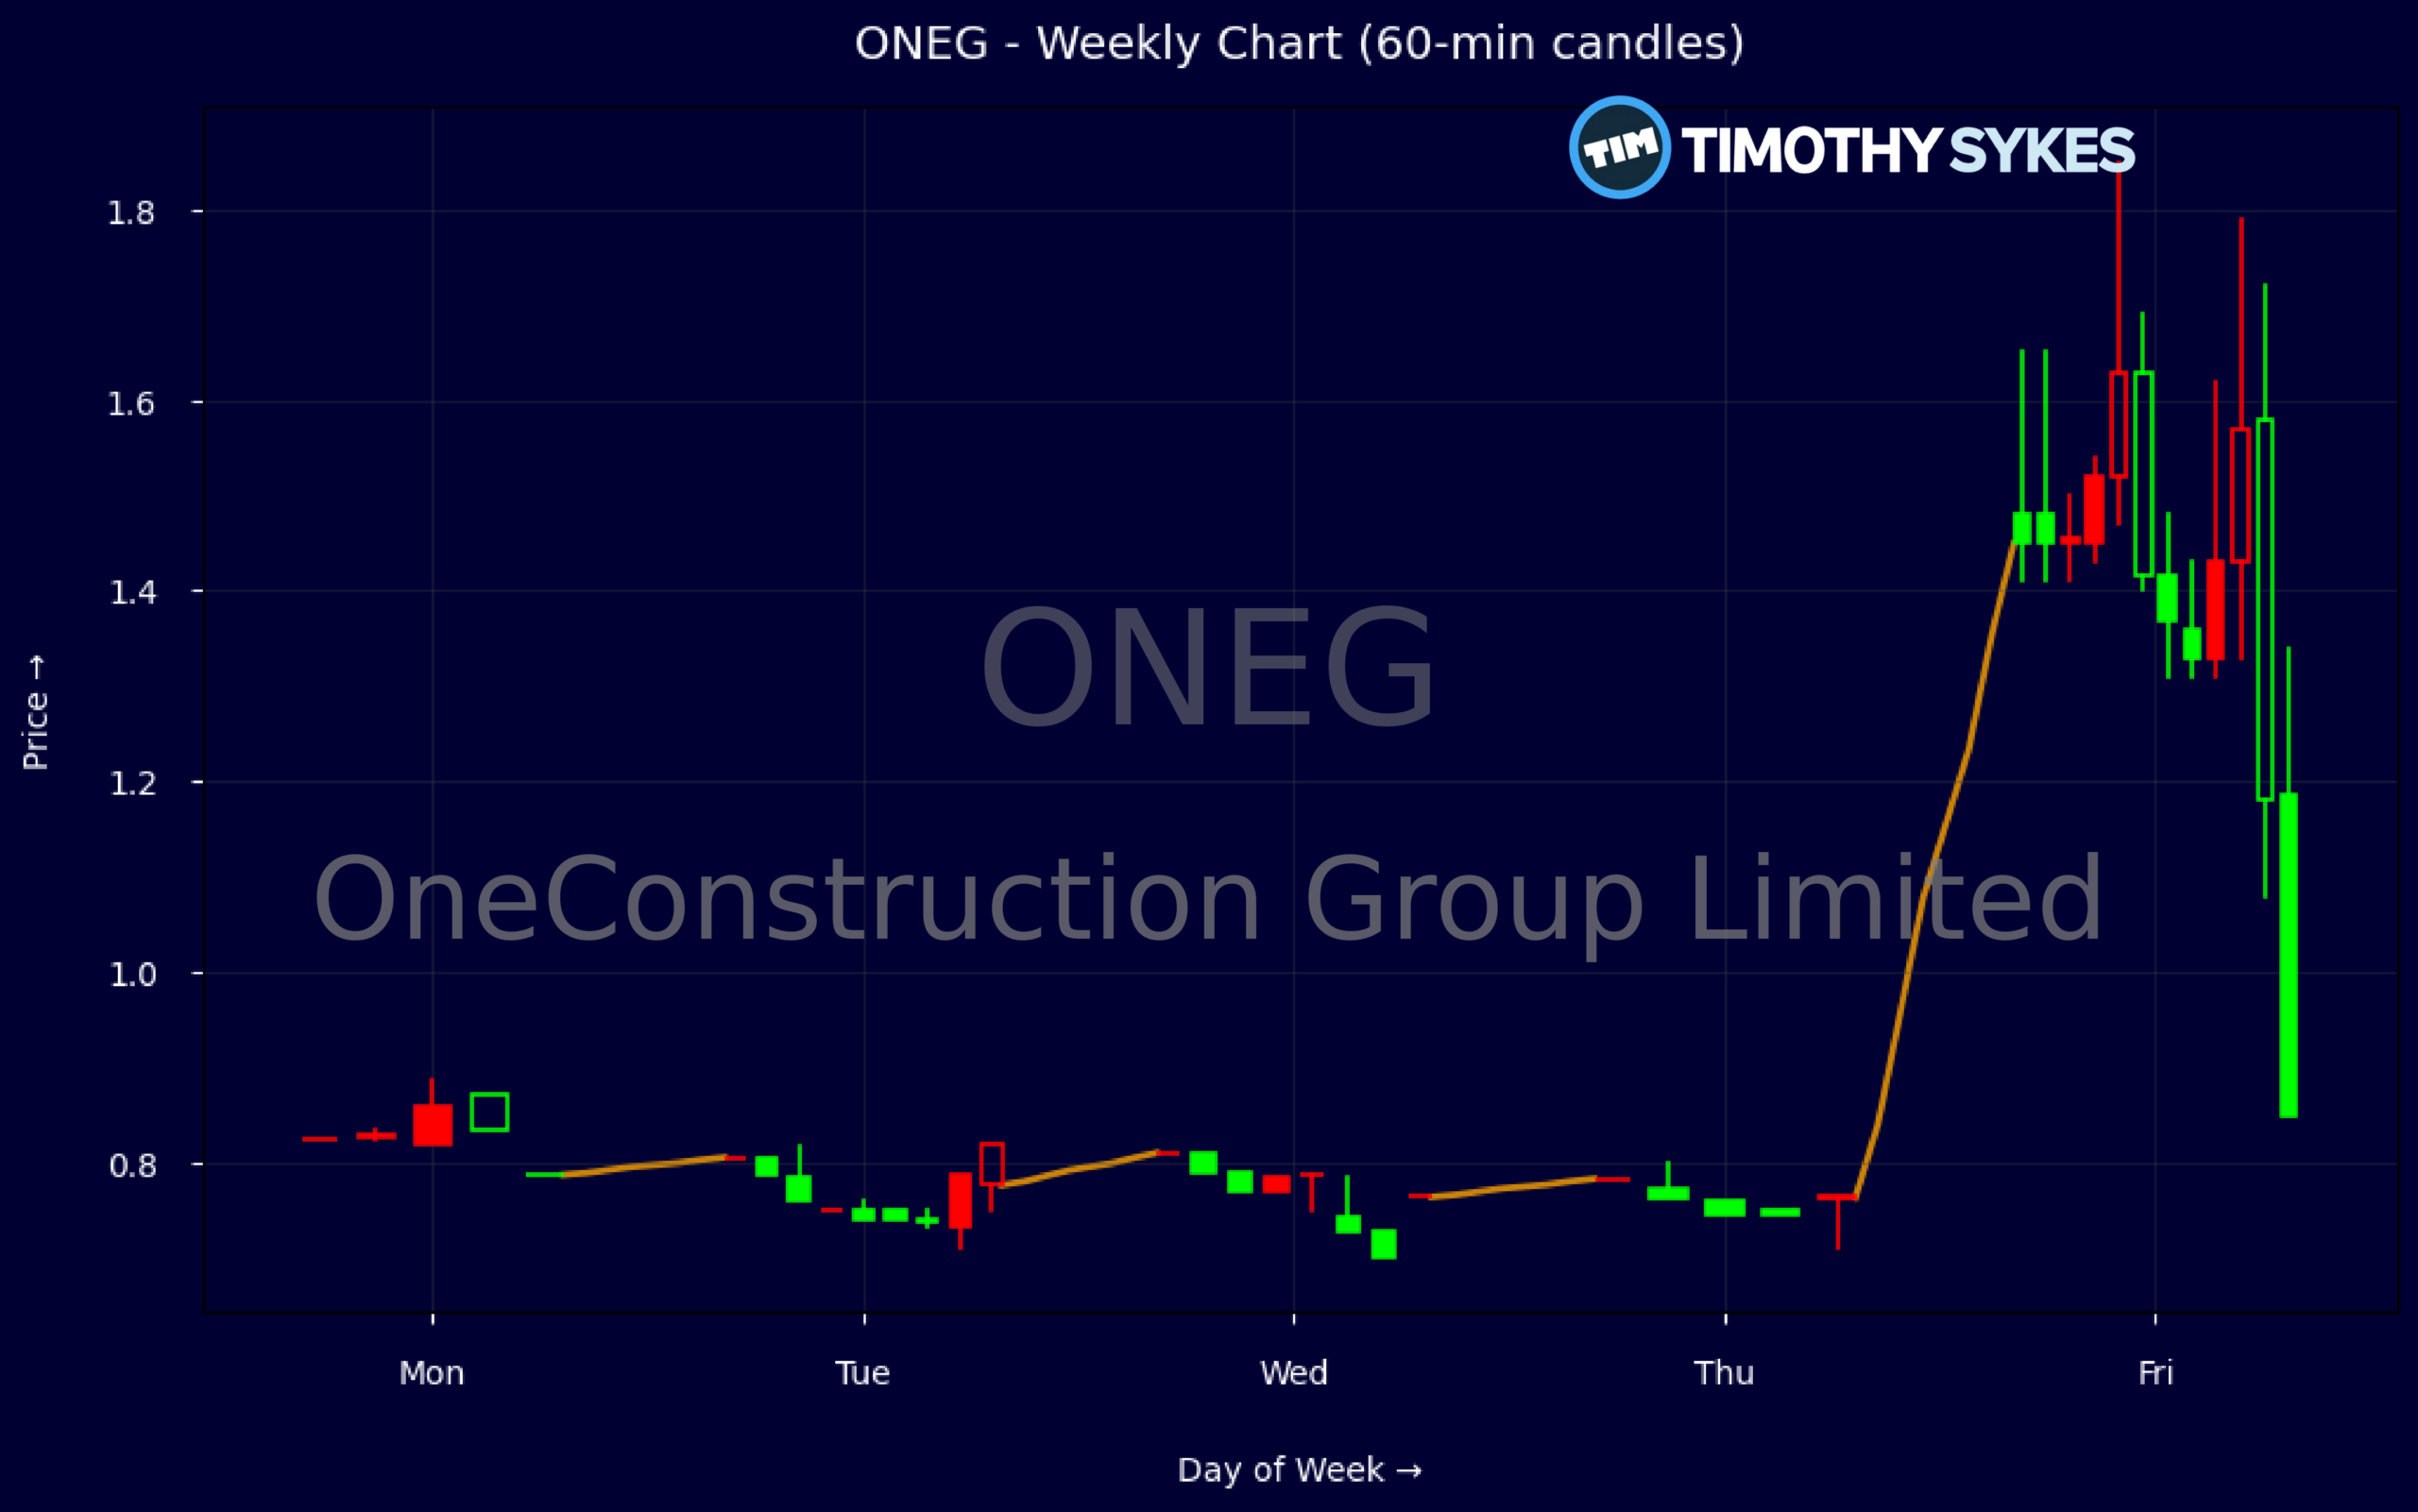
Weekly Update Oct 26 – Oct 30, 2026: On Saturday, October 31, 2026 OneConstruction Group Limited stock [NASDAQ: ONEG] is trending up by 88.99%! Discover the key drivers behind this movement as well as our expert analysis in the detailed breakdown below.
Industrials industry expert:
Analyst sentiment – negative
ONEG operates as a distressed micro-cap in the Industrials/Construction space, with revenue of ~$49.4m but an extremely thin equity cushion of only ~$0.3m against $36.6m of liabilities, implying leverage of ~4.1x and a highly stressed balance sheet. Receivables dominate assets (~$34.3m), signaling material collection and counterparty risk. ROA is effectively zero and ROIC of ~5.9% is inadequate versus risk profile. Price/sales at 0.3x and price/book of 1.3x look optically cheap but reflect legitimate solvency concerns.
Price action is illiquid and volatile, with several days trading essentially one print, then an explosive move from the low $0.80s to an intraday high of $1.85 before closing at $1.48. That spike, on likely elevated but concentrated volume, shifts the short-term bias to bullish but unstable. The key actionable level is $1.40: above it, momentum traders can target $1.80–1.90; a sustained break back below $0.80 would invalidate the long setup and signal renewed distribution.
With no substantive news flow or operational disclosures, this recent re-rating appears purely technical/speculative rather than fundamentally driven. Versus broader Industrials and Construction benchmarks, ONEG carries far higher balance-sheet risk, weaker profitability, and inferior business quality, justifying a deep discount multiple. My stance is decisively negative for investors; only short-horizon traders should engage. Near-term resistance sits at $1.80–1.90, support at $1.00 then $0.80, with downside bias toward sub-$0.70 if the recent spike fails.
More Breaking News
Quick Financial Overview
OneConstruction Group Limited (ONEG) just printed a notable volatility burst after weeks of quiet trading. The weekly data show the stock sitting around $0.78–$0.82 for several sessions, then suddenly gapping to an intraday high near $1.85 before closing the week at $1.48. That kind of range expansion often marks a shift in control from passive holders to active traders. On the intraday chart, a single 5-minute candle runs from roughly $0.86 to $1.79, then settles at $1.63, confirming a strong rush of buying interest.
Fundamentals paint a mixed picture. ONEG reports revenue of about $49.36M, with revenue per share around $3.08, while the enterprise value sits near $25.51M. A price-to-sales ratio of 0.3 looks cheap on the surface, but traders must pair that with balance sheet quality and cash timing. Book value per share is roughly $0.76, and the price-to-book at 1.31 shows the market is only assigning a modest premium to net assets.
The balance sheet explains that caution. Total assets are about $36.90M, but receivables alone are roughly $34.25M, meaning most of the asset base depends on clients paying on time. Total liabilities sit near $36.62M, leaving common equity at only about $0.28M. The leverage ratio of 4.1 and retained earnings of about -$6.71M flag that the company has a thin capital buffer. Still, working capital of around $21.97M and cash near $1.69M give OneConstruction Group Limited some near-term breathing room if receivables convert efficiently.
Conclusion
This is stock news, not investment advice. Timothy Sykes News delivers real-time stock market news focused on key catalysts driving short-term price movements. Our content is tailored for active traders and investors seeking to capitalize on rapid price fluctuations, particularly in volatile sectors like penny stocks. Readers come to us for detailed coverage on earnings reports, mergers, FDA approvals, new contracts, and unusual trading volumes that can trigger significant short-term price action. Some users utilize our news to explain sudden stock movements, while others rely on it for diligent research into potential investment opportunities.
Dive deeper into the world of trading with Timothy Sykes, renowned for his expertise in penny stocks. Explore his top picks and discover the strategies that have propelled him to success with these articles:
- Penny Stocks Trading Guide
- Best Penny Stocks Under $1 to Buy Today
- Top 8 Penny Stocks to Watch on Robinhood
Once you’ve got some stocks on watch, elevate your trading game with StocksToTrade the ultimate platform for traders. With specialized tools for swing and day trading, StocksToTrade will guide you through the market’s twists and turns.
Dig into StocksToTrade’s watchlists here:





Leave a reply