
Marvell Technology Inc. stocks have been trading down by -6.19 percent after guidance disappointment overshadowed otherwise solid earnings.
Key Takeaways
- Recent MRVL trading shows a pullback from the mid‑$260s into the low‑$220s, signaling momentum cooling after a strong run.
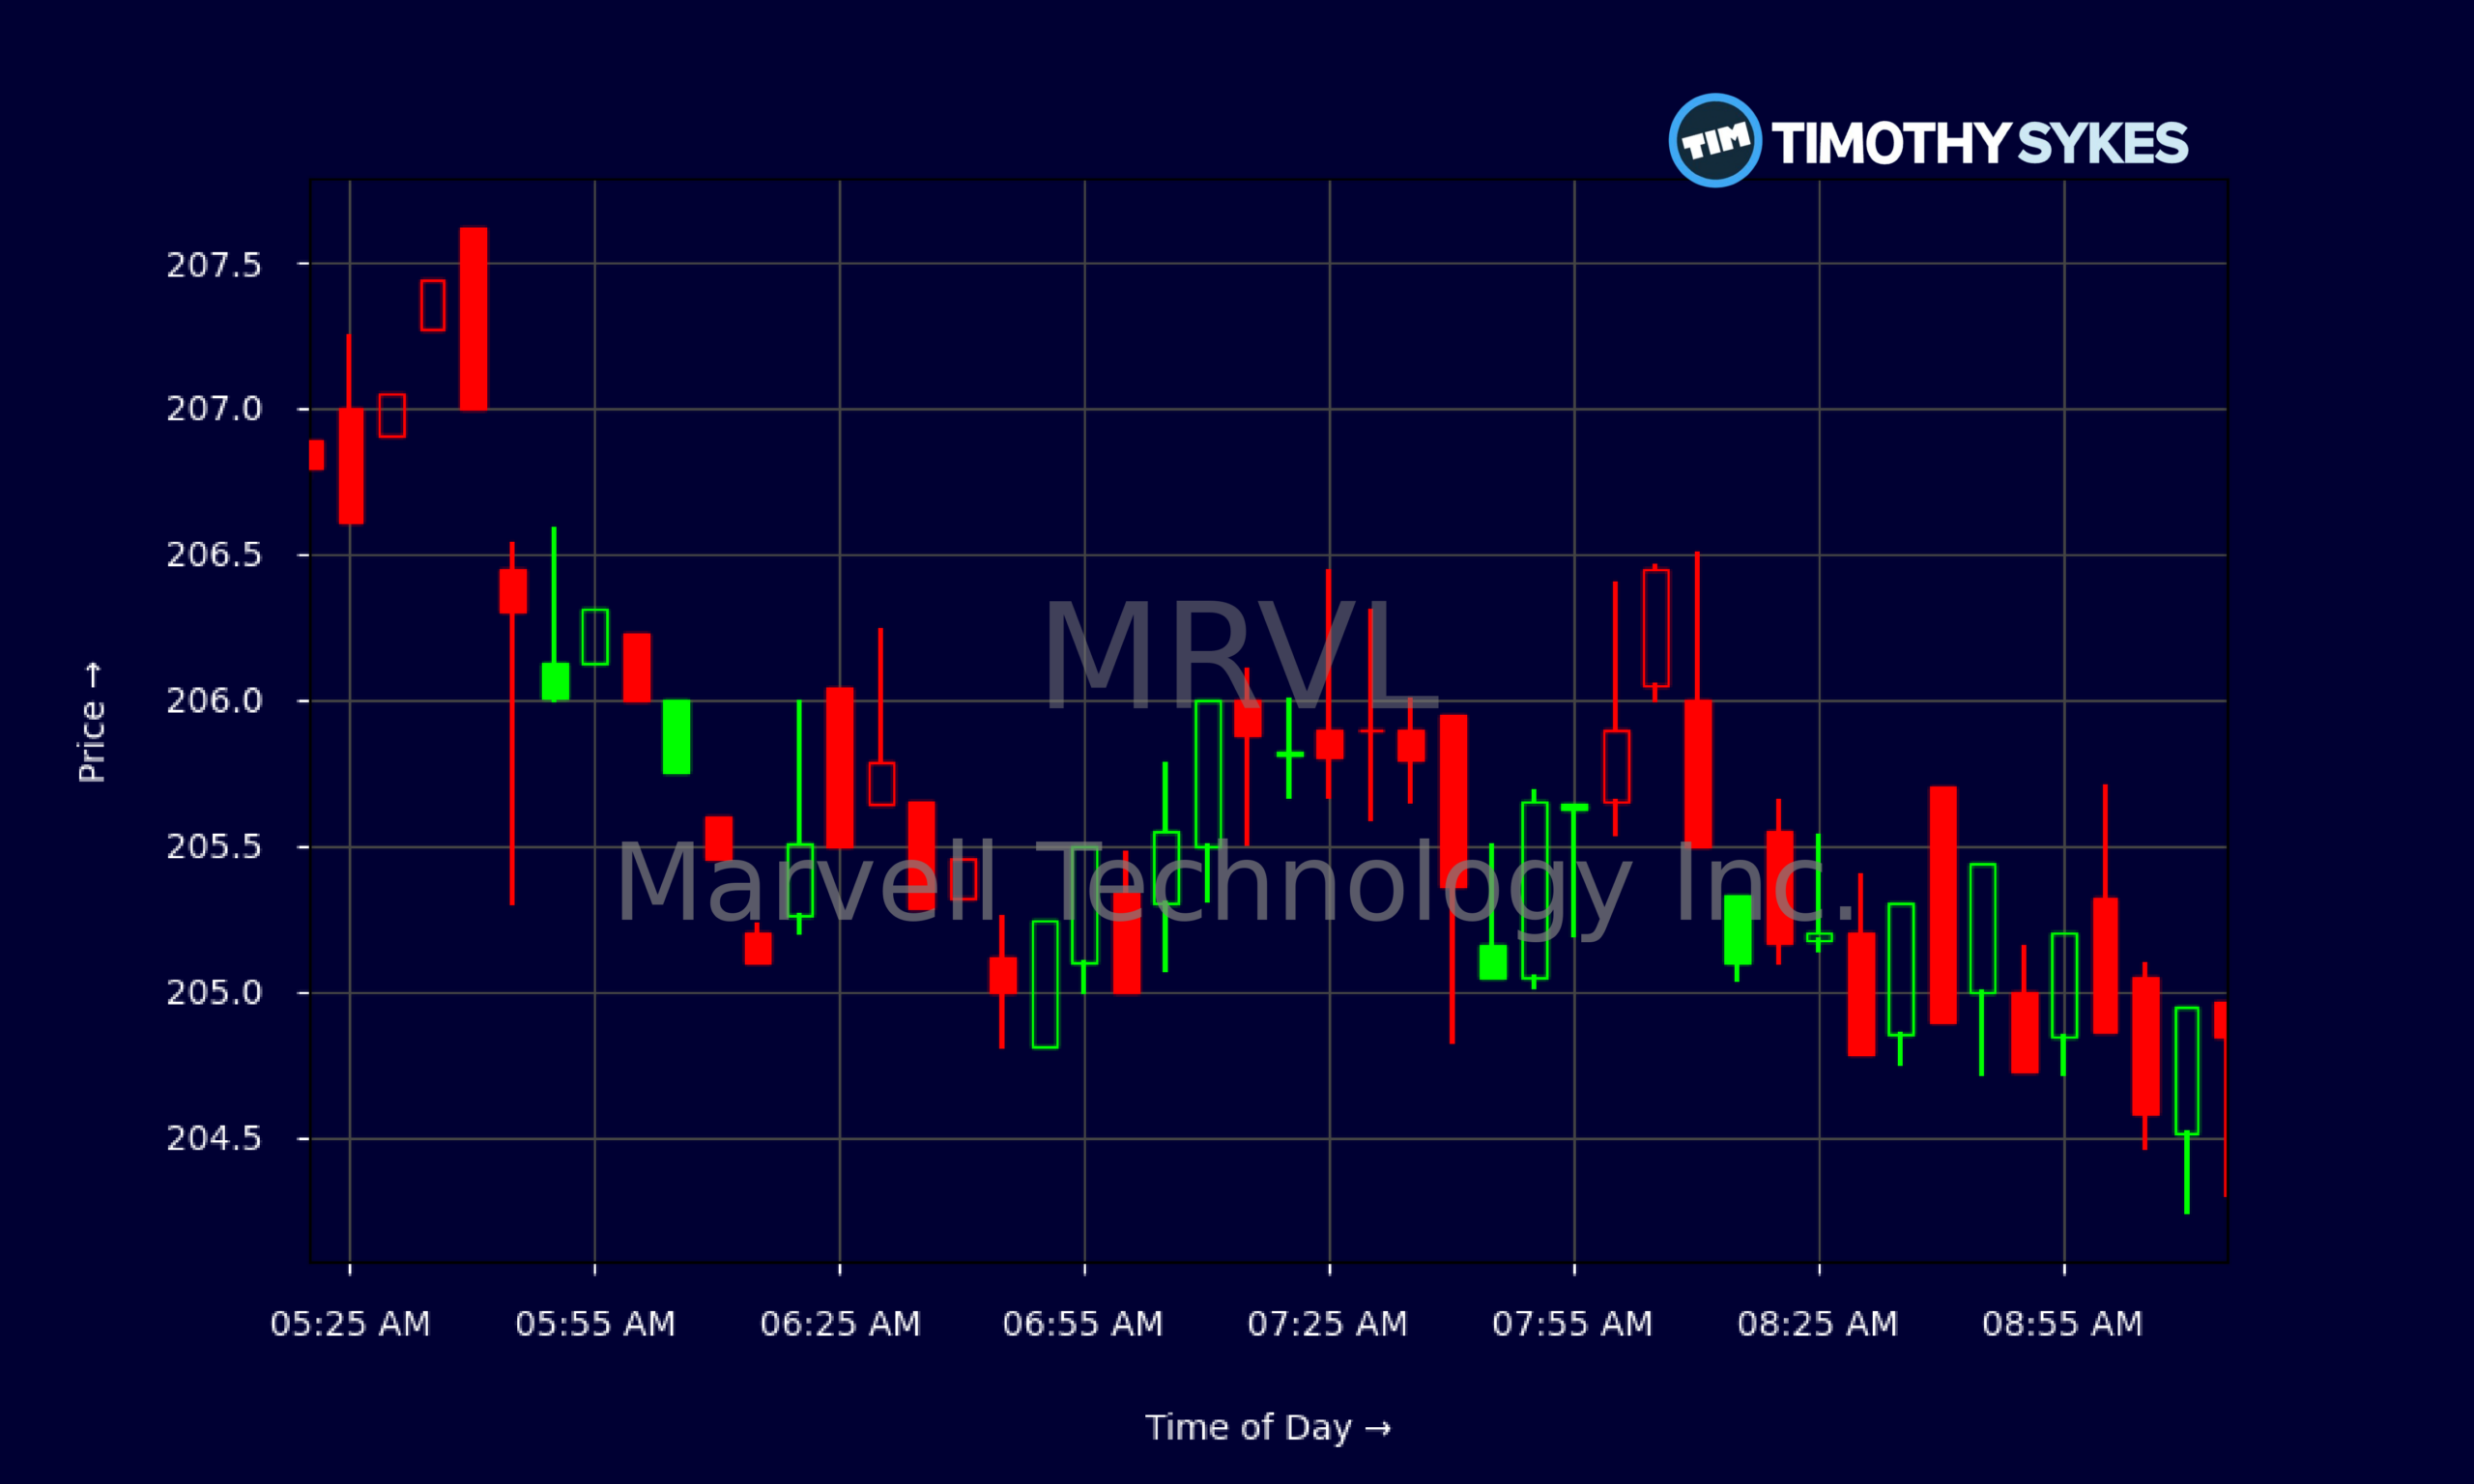
- Intraday MRVL action around $205–$208 reflects tight consolidation, with neither buyers nor sellers fully in control.
- Strong gross margin above 50% and solid cash flow give Marvell Technology Inc. room to keep funding AI and data infrastructure growth.
- A rich price‑to‑sales multiple above 25 signals traders are paying up for MRVL’s AI story, leaving little room for earnings missteps.
- With current ratio above 3, MRVL carries a healthy liquidity buffer, a key factor for traders sizing risk on deeper pullbacks.
Live Update At 09:18:56 EDT: On Friday, October 30, 2026 Marvell Technology Inc. stock [NASDAQ: MRVL] is trending down by -6.19%! Discover the key drivers behind this movement as well as our expert analysis in the detailed breakdown below.
Quick Financial Overview
MRVL’s chart reads like a classic high‑beta tech name after a big run. In mid‑month trading, MRVL pushed up toward the $280–$300 area, tagging a high around $301 before momentum cracked. Since then, the stock has rolled over, with closes sliding from the high‑$260s into the low‑$220s. That’s a meaningful retrace and tells traders that early AI euphoria is cooling, at least short term.
Under the hood, Marvell Technology Inc. still looks like a high‑quality growth chip name. Revenue runs around $8.19B annually, growing near 19–22% over three to five years. Profitability is strong: gross margin is 52.2%, and EBIT margin sits above 33%. MRVL’s net margin near 28% shows it converts a solid slice of sales into bottom‑line profit.
More Breaking News
The balance sheet backs that story. MRVL holds about $3.93B in cash and short‑term investments, with total debt‑to‑equity at just 0.27 and a current ratio of 3.2. That means near‑term obligations are well covered. The flip side is valuation. A P/E above 90 and price‑to‑sales over 25 signal that traders are already paying for a lot of future AI growth.
Why Traders Are Watching MRVL’s Pullback
MRVL has been a momentum favorite, and the recent price action shows exactly why traders stay glued to it. Earlier in the month, MRVL exploded from the low‑$270s to over $300 intraday, then reversed hard. That spike and fade is the kind of emotional move where late buyers get trapped, and fast traders short the backside of the parabola.
From there, MRVL has stepped down in stages. Closes around $268, then $245, then $241, then into the $230s and now low‑$220s outline a clear downtrend. Each bounce is getting sold. For short‑term trading, that sets up clean resistance zones in the mid‑$230s and mid‑$240s. Until MRVL can reclaim and hold above those levels, the path of least resistance remains sideways to down.
Intraday, MRVL is now grinding in a tight $204–$208 band in pre‑market and early extended trading. That narrow range after a big multi‑day slide usually signals consolidation — either a base before a bounce, or a bear flag before another leg lower. Volume and range expansion off this zone will matter for day traders trying to catch the next move.
On the fundamentals side, MRVL’s latest quarterly numbers show why longer‑term bulls keep circling back. Quarterly revenue near $2.74B, EBITDA around $747.9M, and operating income of $456.9M show that MRVL is not just a story stock; it’s printing real cash. Free cash flow for the recent quarter of about $474.3M gives Marvell Technology Inc. plenty of ammo for R&D and capital spending in AI, cloud, and networking.
That combination — premium valuation, strong growth, and a sharp pullback — is exactly the type of setup momentum traders study. MRVL is expensive on paper, but when the sector heats up again, names like this often move first and fastest.
Conclusion
For active traders, MRVL right now is a lesson in how hot stories cool off — and where opportunity shows up when they do. Marvell Technology Inc. ran hard with the AI chip crowd, then gave back a big chunk of those gains as reality checked sentiment. The daily chart shows lower highs and lower lows, with recent support building around the low‑$220s and intraday congestion near $205–$208.
Fundamentally, MRVL still brings plenty to the table: double‑digit revenue growth, fat margins, a clean balance sheet, and nearly $4B in cash. At the same time, valuation remains stretched, with a P/E above 90 and price‑to‑cash‑flow near 100. That tension between quality fundamentals and a rich price tag is what keeps trading interesting. If growth keeps delivering, MRVL can justify those multiples; if growth wobbles, air pockets form fast.
For now, disciplined traders will map out key levels rather than chasing hope. Support in the $215–$220 zone and resistance up in the mid‑$230s and mid‑$240s are the immediate battlegrounds. As millionaire penny stock trader and teacher Tim Sykes, says, “Consistency is key in trading; don’t let emotions dictate your trades.” As Tim Sykes likes to remind his students, “The market doesn’t care about your opinion — it cares about price action. Respect the trend, cut losses fast, and only trade what the chart confirms.” MRVL is giving that lesson in real time, day after day.
This analysis is for educational and research purposes only and is not investment advice.
This is stock news, not investment advice. Timothy Sykes News delivers real-time stock market news focused on key catalysts driving short-term price movements. Our content is tailored for active traders and investors seeking to capitalize on rapid price fluctuations, particularly in volatile sectors like penny stocks. Readers come to us for detailed coverage on earnings reports, mergers, FDA approvals, new contracts, and unusual trading volumes that can trigger significant short-term price action. Some users utilize our news to explain sudden stock movements, while others rely on it for diligent research into potential investment opportunities.
Dive deeper into the world of trading with Timothy Sykes, renowned for his expertise in penny stocks. Explore his top picks and discover the strategies that have propelled him to success with these articles:
- Penny Stocks Trading Guide
- Best Penny Stocks Under $1 to Buy Today
- Top 8 Penny Stocks to Watch on Robinhood
Once you’ve got some stocks on watch, elevate your trading game with StocksToTrade the ultimate platform for traders. With specialized tools for swing and day trading, StocksToTrade will guide you through the market’s twists and turns.
Dig into StocksToTrade’s watchlists here:





Leave a reply