

Nokia Corporation Sponsored stocks have been trading down by -9.38 percent amid negative sentiment over weakening telecom equipment demand.
Key Takeaways For NOK Traders
- Nokia stock is down more than 7% despite reporting higher Q3 comparable earnings and net sales, signaling traders are skeptical about the outlook.
- Telecom equipment providers Nokia and Ericsson were notable continental European ADR decliners, with roughly 3% and 1.7% drops that highlight pressure on the sector.
- Several European ADRs — especially Nokia and major banks — underperformed sharply while the S&P Europe Select ADR Index slipped just 0.96%, with some names falling up to nearly 10%.
- On a day when the broader European ADR index dipped only 0.3%, Nokia fell 3.2%, pointing to clear stock-specific selling pressure.
- In an otherwise strong European ADR session, Nokia again declined, confirming ongoing relative weakness and soft buying interest.
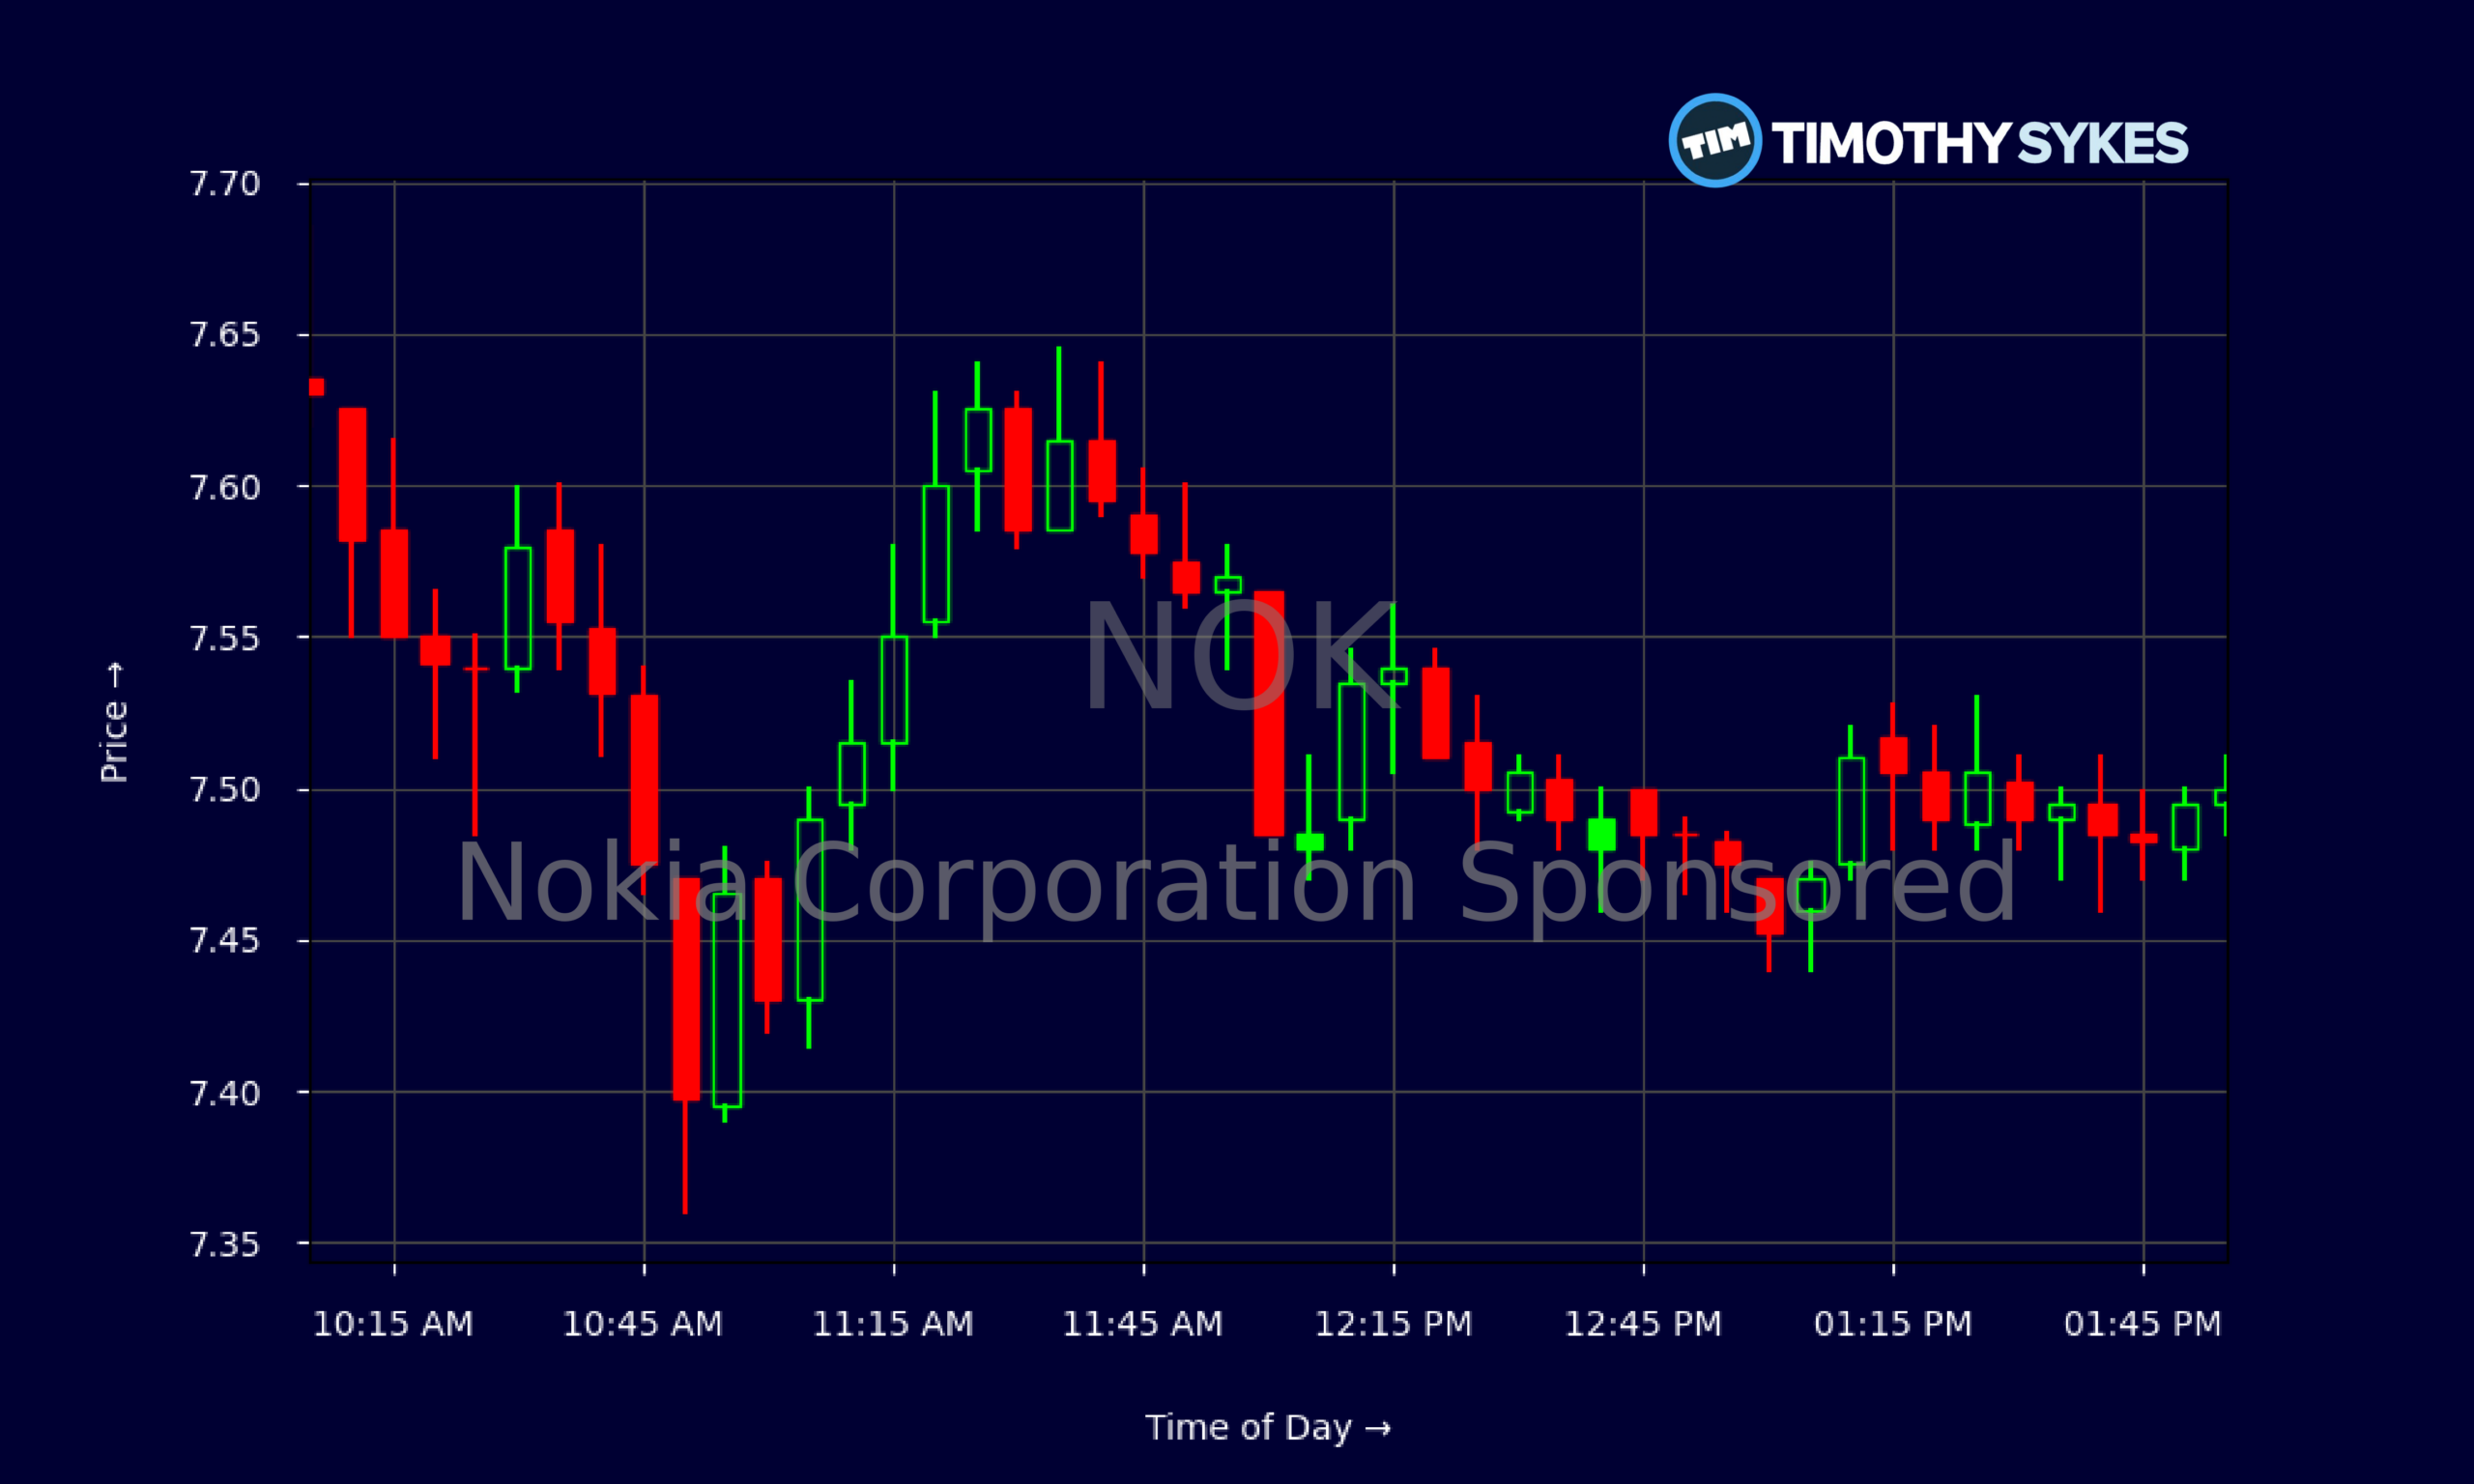
Live Update At 14:02:37 EST: On Thursday, November 05, 2026 Nokia Corporation Sponsored stock [NYSE: NOK] is trending down by -9.38%! Discover the key drivers behind this movement as well as our expert analysis in the detailed breakdown below.
Quick Financial Overview
NOK has been in a steady downtrend over the past few weeks, and the daily chart shows how aggressive that selling has become. At the recent high on 2026/10/12, Nokia ADRs traded above $10. By 2026/11/05, Nokia Corporation Sponsored closed near $7.49 after touching an intraday low around $7.36. That’s a deep pullback in less than a month and a clear shift in sentiment.
Intraday, NOK is now trading in a tight band between roughly $7.45 and $7.60, with the 5‑minute chart showing lots of small candles and failed attempts to bounce. That kind of choppy, low‑range action often signals consolidation after a hard selloff while traders debate the next move.
More Breaking News
On the fundamental side, Nokia Corporation Sponsored is not tiny. NOK is tied to about $19.22B in annual revenue, with an enterprise value around $58.51B. Yet the price/earnings ratio is near 74.4, well above typical telecom hardware names, while price/sales sits around 2.58 and price/book about 2.45. Those multiples say the market already priced in a lot of hope. With return on assets of just 2.94% and return on equity of 5.82%, growth looks measured, not explosive. For active traders, that mix of high valuation and modest profitability helps explain why any hint of doubt can trigger sharp, momentum‑driven selling in NOK.
Why Traders Are Watching NOK’s Persistent Underperformance
NOK keeps showing up on the wrong side of the tape. On 2026/10/22, Nokia stock dropped more than 7% even after the company reported higher Q3 comparable earnings and net sales. For Nokia Corporation Sponsored, that’s the real story right now: the fundamentals improved, yet the stock still got hit hard. When good news can’t lift a name, momentum traders pay close attention.
That Q3 reaction sits inside a broader pattern. On the same 2026/10/22 session, several European ADRs — especially Nokia, big European banks, and a few other names — sharply underperformed while the S&P Europe Select ADR Index slipped just 0.96%. Some of those ADRs fell between roughly 2.4% and nearly 10%. NOK being grouped with the day’s biggest losers tells you funds were de‑risking Europe, and Nokia Corporation Sponsored was a clear sell button.
Zoom out further and the theme holds. On 2026/10/08, Nokia dropped about 3.2% on a day when the broader European ADR index was down only 0.3%. A week later, on 2026/10/15, NOK was again in a subset of European ADRs that declined in an otherwise strong session for European stocks in U.S. trading. And on 2026/10/30, Nokia Corporation Sponsored showed up again among the largest decliners, while the same benchmark index was only modestly lower and flat on the week.
Add the 3% slide on 2026/10/12, when telecom equipment names like Nokia and Ericsson both weakened, and the message is clear. This is not a one‑day fluke. Sector headwinds, macro fear around Europe, and valuation concerns are all feeding a steady rotation away from NOK. For short‑term traders, that kind of persistent relative weakness is a potential playground — but only if you respect the trend and your risk.
Conclusion
NOK now sits in a classic tension zone. On one hand, Nokia Corporation Sponsored still posts higher comparable earnings and solid net sales, backed by a sizable balance sheet: roughly $37.6B in assets, over $6.7B in cash and short‑term investments, and working capital near $5.79B. Leverage looks manageable, with long‑term debt a fraction of total equity. None of that looks like a broken company.
On the other hand, the market does not care about that story right now. Nokia has a rich earnings multiple, modest returns, and a chart that shows traders dumping strength for weeks. NOK has lagged the S&P Europe Select ADR Index on down days and failed to join in on rallies. That repeated underperformance is what short‑term players trade, not the long‑term telecom narrative.
For active traders in the Tim Sykes community, the playbook stays the same: focus on price action first, story second. NOK is a real‑time lesson in what happens when sentiment turns against a crowded name. As Tim Sykes likes to say, “The market doesn’t care what you think a stock ‘should’ do — only what it’s actually doing. Trade the chart, not your ego.” As millionaire penny stock trader and teacher Tim Sykes, says, “You must adapt to the market; the market will not adapt to you.”. For Nokia Corporation Sponsored, the chart still demands caution, tight risk, and quick decision‑making from anyone stepping into this trend for educational and research purposes.
This is stock news, not investment advice. Timothy Sykes News delivers real-time stock market news focused on key catalysts driving short-term price movements. Our content is tailored for active traders and investors seeking to capitalize on rapid price fluctuations, particularly in volatile sectors like penny stocks. Readers come to us for detailed coverage on earnings reports, mergers, FDA approvals, new contracts, and unusual trading volumes that can trigger significant short-term price action. Some users utilize our news to explain sudden stock movements, while others rely on it for diligent research into potential investment opportunities.
Dive deeper into the world of trading with Timothy Sykes, renowned for his expertise in penny stocks. Explore his top picks and discover the strategies that have propelled him to success with these articles:
- Penny Stocks Trading Guide
- Best Penny Stocks Under $1 to Buy Today
- Top 8 Penny Stocks to Watch on Robinhood
Once you’ve got some stocks on watch, elevate your trading game with StocksToTrade the ultimate platform for traders. With specialized tools for swing and day trading, StocksToTrade will guide you through the market’s twists and turns.
Dig into StocksToTrade’s watchlists here:





Leave a reply