

Mosaic Company (The) stocks have been trading up by 3.36 percent on optimism over strengthening global fertilizer demand.
What Traders Need To Know
- Barclays lowered its price target on Mosaic to $22 from $26, while the broader Street still sits around a higher $26 mean target and an overweight stance.
- Mizuho also cut its price target to $22 from $25, reinforcing a pattern of reduced upside expectations but not a bearish call on the shares.
- The company is maintaining its quarterly dividend at $0.22 per share, payable 2026/12/18 to shareholders of record on 2026/12/04.
- Executive Vice President – Operations Karen Swager will retire in 2027, with Walt Precourt assuming the EVP – Operations role on 2026/12/01 to support continuity.
- A $1.34B USDA funding push into U.S. fertilizer projects may indirectly affect Mosaic by expanding domestic supply and infrastructure over time.
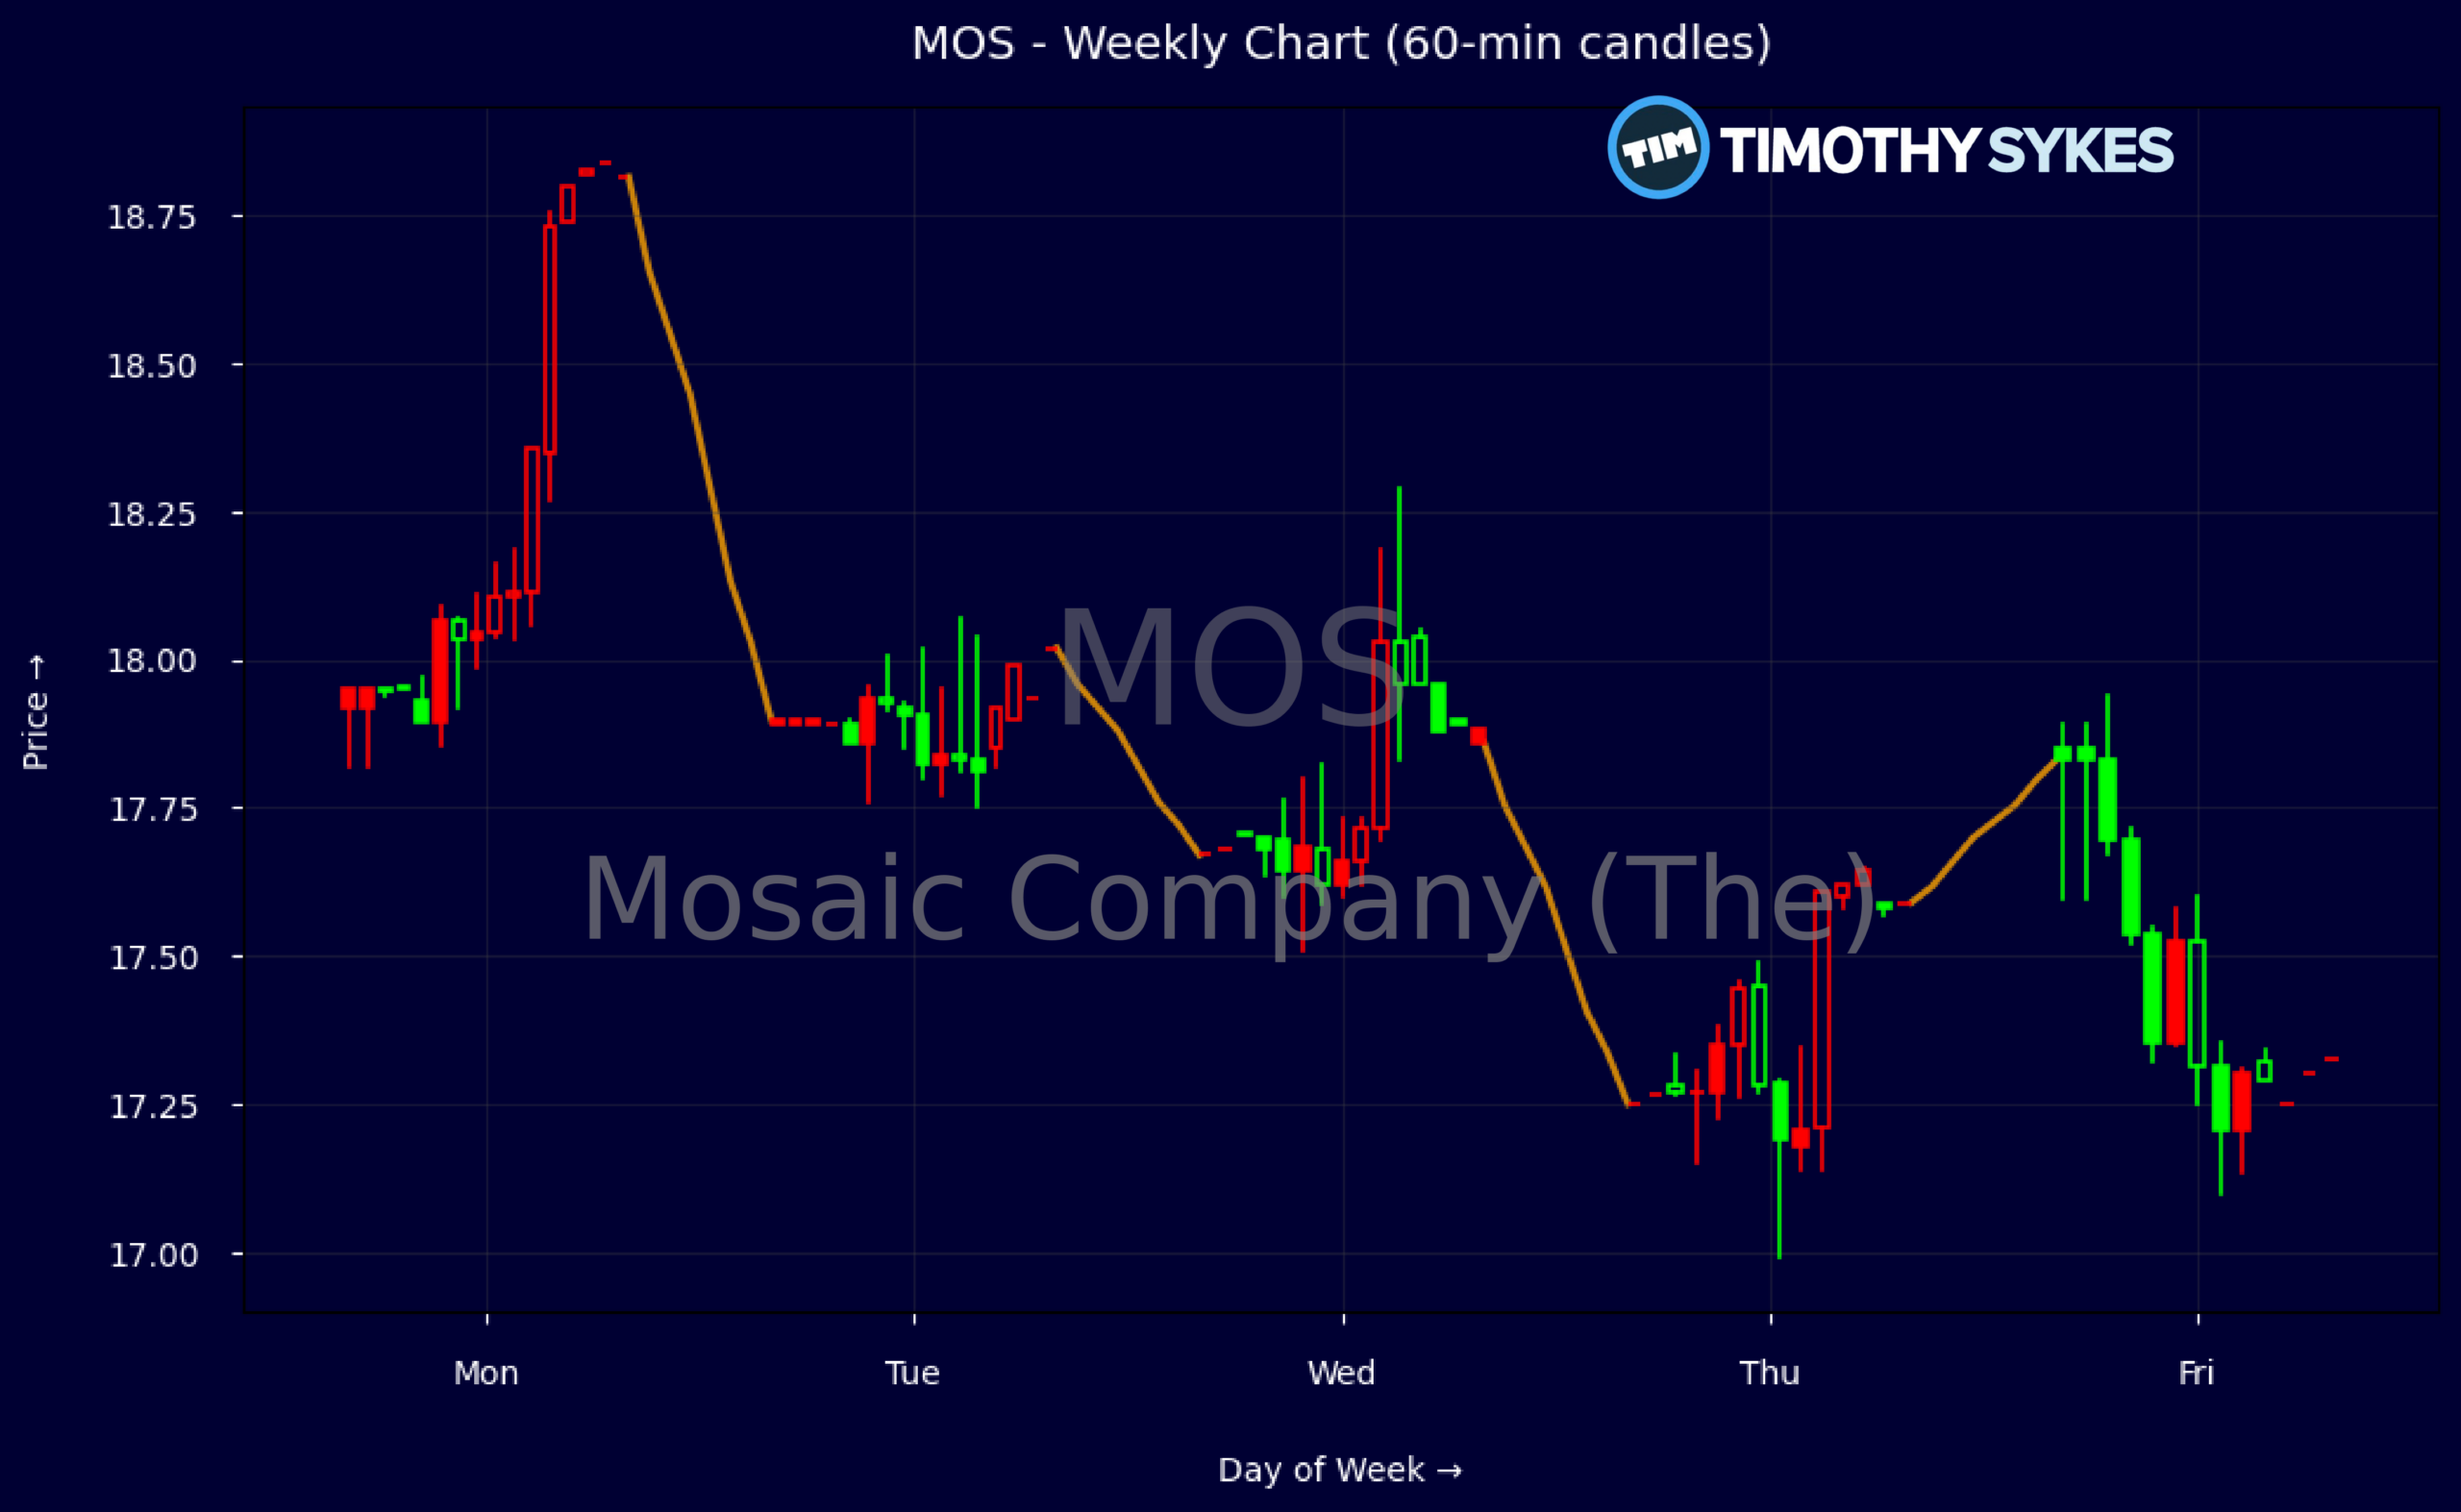
Weekly Update Oct 19 – Oct 23, 2026: On Friday, October 23, 2026 Mosaic Company (The) stock [NYSE: MOS] is trending up by 3.36%! Discover the key drivers behind this movement as well as our expert analysis in the detailed breakdown below.
Materials industry expert:
Analyst sentiment – neutral
Mosaic remains a scale phosphate and potash producer, but current fundamentals are mid‑cycle weak. LTM revenue of ~$12.1B is down 10% over three years, with gross margin at 11% and EBIT margin deeply compressed versus the 40% historical figure cited. Q2 showed negative operating income and a -5% net margin, with ROE LTM at -5.3%. Balance sheet is sound (D/E 0.54, interest coverage 6.3x), valuation is undemanding at 0.5x sales and 0.5x book, and the ~5.1% dividend yield is covered by liquidity but not by current free cash flow, which is negative on sizable capex and working‑capital build.
Weekly trading around $17.25–17.92 shows a tight consolidation after a mild pullback, with closes clustering near $17.8–17.9, indicating near‑term balance rather than a firm trend. Intraday 5‑minute action (not shown but implied) has repeatedly defended the mid‑$17s on lower volume, while upticks toward $18 fade on light participation. The dominant pattern is a sideways base with a slight downward bias. A clear actionable level is $18.20: a weekly close above that level on rising volume would signal a tradable long toward the low $20s; failure to hold $17.20 opens downside to roughly $16.50.
Near term, the USDA’s $1.34B fertilizer‑ecosystem funding expands long‑run U.S. capacity, structurally capping pricing power for producers like Mosaic relative to broader Materials benchmarks. Sector peers and ag indices have outperformed MOS as analysts cut targets to $22 while retaining overweight ratings, implying upside from the high‑$17s but acknowledging cyclical pressure. Management transition in operations is well signposted and low risk. Dividend maintenance at $0.22 supports yield‑oriented demand. Base‑case 12‑month fair value is $21–23, with support at $17 and resistance at $22–23.
More Breaking News
Quick Financial Overview
Mosaic Company (The) is trading in the high teens, with the weekly range between roughly $17.25 and $17.97. That keeps MOS well below the $22–$26 analyst target band, which reflects tempered but still constructive Street views. The intraday tape shows a grind higher from about $17.20 in the morning to a close near $17.85, signaling steady dip-buying rather than panic or euphoria.
On the income side, quarterly revenue sits around $2.82B, but Mosaic Company (The) posted a net loss of about $273M and negative EPS near -$0.86. Margins are thin, with gross margin near 11% and EBIT negative for the period, confirming the pressure from softer fertilizer pricing, especially in phosphate. Still, trailing revenue is about $12.05B, and an asset turnover close to 0.5 shows a large, active operating base.
From a balance-sheet and valuation angle, MOS changes hands at roughly 0.49 times sales and about 0.52 times book value, which is deep value territory by most standards. Debt metrics are manageable, with total debt-to-equity around 0.54, interest coverage over 6, and a current ratio near 1.3. The quarterly dividend of $0.22 translates into a yield around 5%, backed by operating cash flow of $167M in the last quarter, even though free cash flow was negative after heavy capital spending.
Conclusion
Mosaic Company (The) sits in a tricky but tradable zone where fundamentals are pressured, yet the stock already reflects a lot of bad news. Price action around $17–$18 shows buyers stepping in below the Street’s trimmed $22 targets from Barclays and Mizuho, leaving a visible gap between current levels and the consensus near $26. For short-term traders, that gap is the opportunity, but also the risk if fertilizer pricing stays weak.
The leadership transition, with Karen Swager retiring and Walt Precourt taking over operations on 2026/12/01, is structured for continuity rather than shock. At the same time, the USDA’s $1.34B fertilizer build-out and upcoming Q3 2026 earnings add macro and event catalysts that can move MOS quickly. Dividend stability at $0.22 per quarter suggests management is confident enough in cash flow to keep paying, which can help support the tape in pullbacks.
For traders, the setup in MOS is about respecting both the downside from negative earnings and the upside implied by discounted valuation and still-overweight ratings. As millionaire penny stock trader and teacher Tim Sykes says, “The goal is not to win every trade but to protect your capital and keep moving forward.”, and that mindset is especially relevant when defining risk in a name like MOS that can move sharply on commodity pricing and earnings surprises. Range levels near $17 on the downside and the low $20s on the upside look like the first key bands to watch into the earnings date. As I tell my students when dealing with names like Mosaic Company (The), “You do not get paid for guessing direction — you get paid for defining your levels, sizing your risk, and letting the market prove you right or wrong.” This article is for educational and research use only.
“,”scores”:{“risk-level”:”medium”},”trade”:”true
This is stock news, not investment advice. Timothy Sykes News delivers real-time stock market news focused on key catalysts driving short-term price movements. Our content is tailored for active traders and investors seeking to capitalize on rapid price fluctuations, particularly in volatile sectors like penny stocks. Readers come to us for detailed coverage on earnings reports, mergers, FDA approvals, new contracts, and unusual trading volumes that can trigger significant short-term price action. Some users utilize our news to explain sudden stock movements, while others rely on it for diligent research into potential investment opportunities.
Dive deeper into the world of trading with Timothy Sykes, renowned for his expertise in penny stocks. Explore his top picks and discover the strategies that have propelled him to success with these articles:
- Penny Stocks Trading Guide
- Best Penny Stocks Under $1 to Buy Today
- Top 8 Penny Stocks to Watch on Robinhood
Once you’ve got some stocks on watch, elevate your trading game with StocksToTrade the ultimate platform for traders. With specialized tools for swing and day trading, StocksToTrade will guide you through the market’s twists and turns.
Dig into StocksToTrade’s watchlists here:





Leave a reply