

Tidewater Inc. stocks have been trading up by 8.4 percent following upbeat offshore drilling demand and fleet expansion news.
What Traders Need To Know
- Price has pushed from the low $80s to about $86 this week, showing firm demand into the close.
- Intraday action in TDW stayed in a tight, upward-sloping range, signaling steady dip buying rather than wild speculation.
- Profit margins and returns on equity for Tidewater Inc. are solid, backing the recent strength in TDW.
- The balance sheet shows healthy liquidity and moderate leverage, giving traders room to lean into momentum without extreme balance-sheet risk.
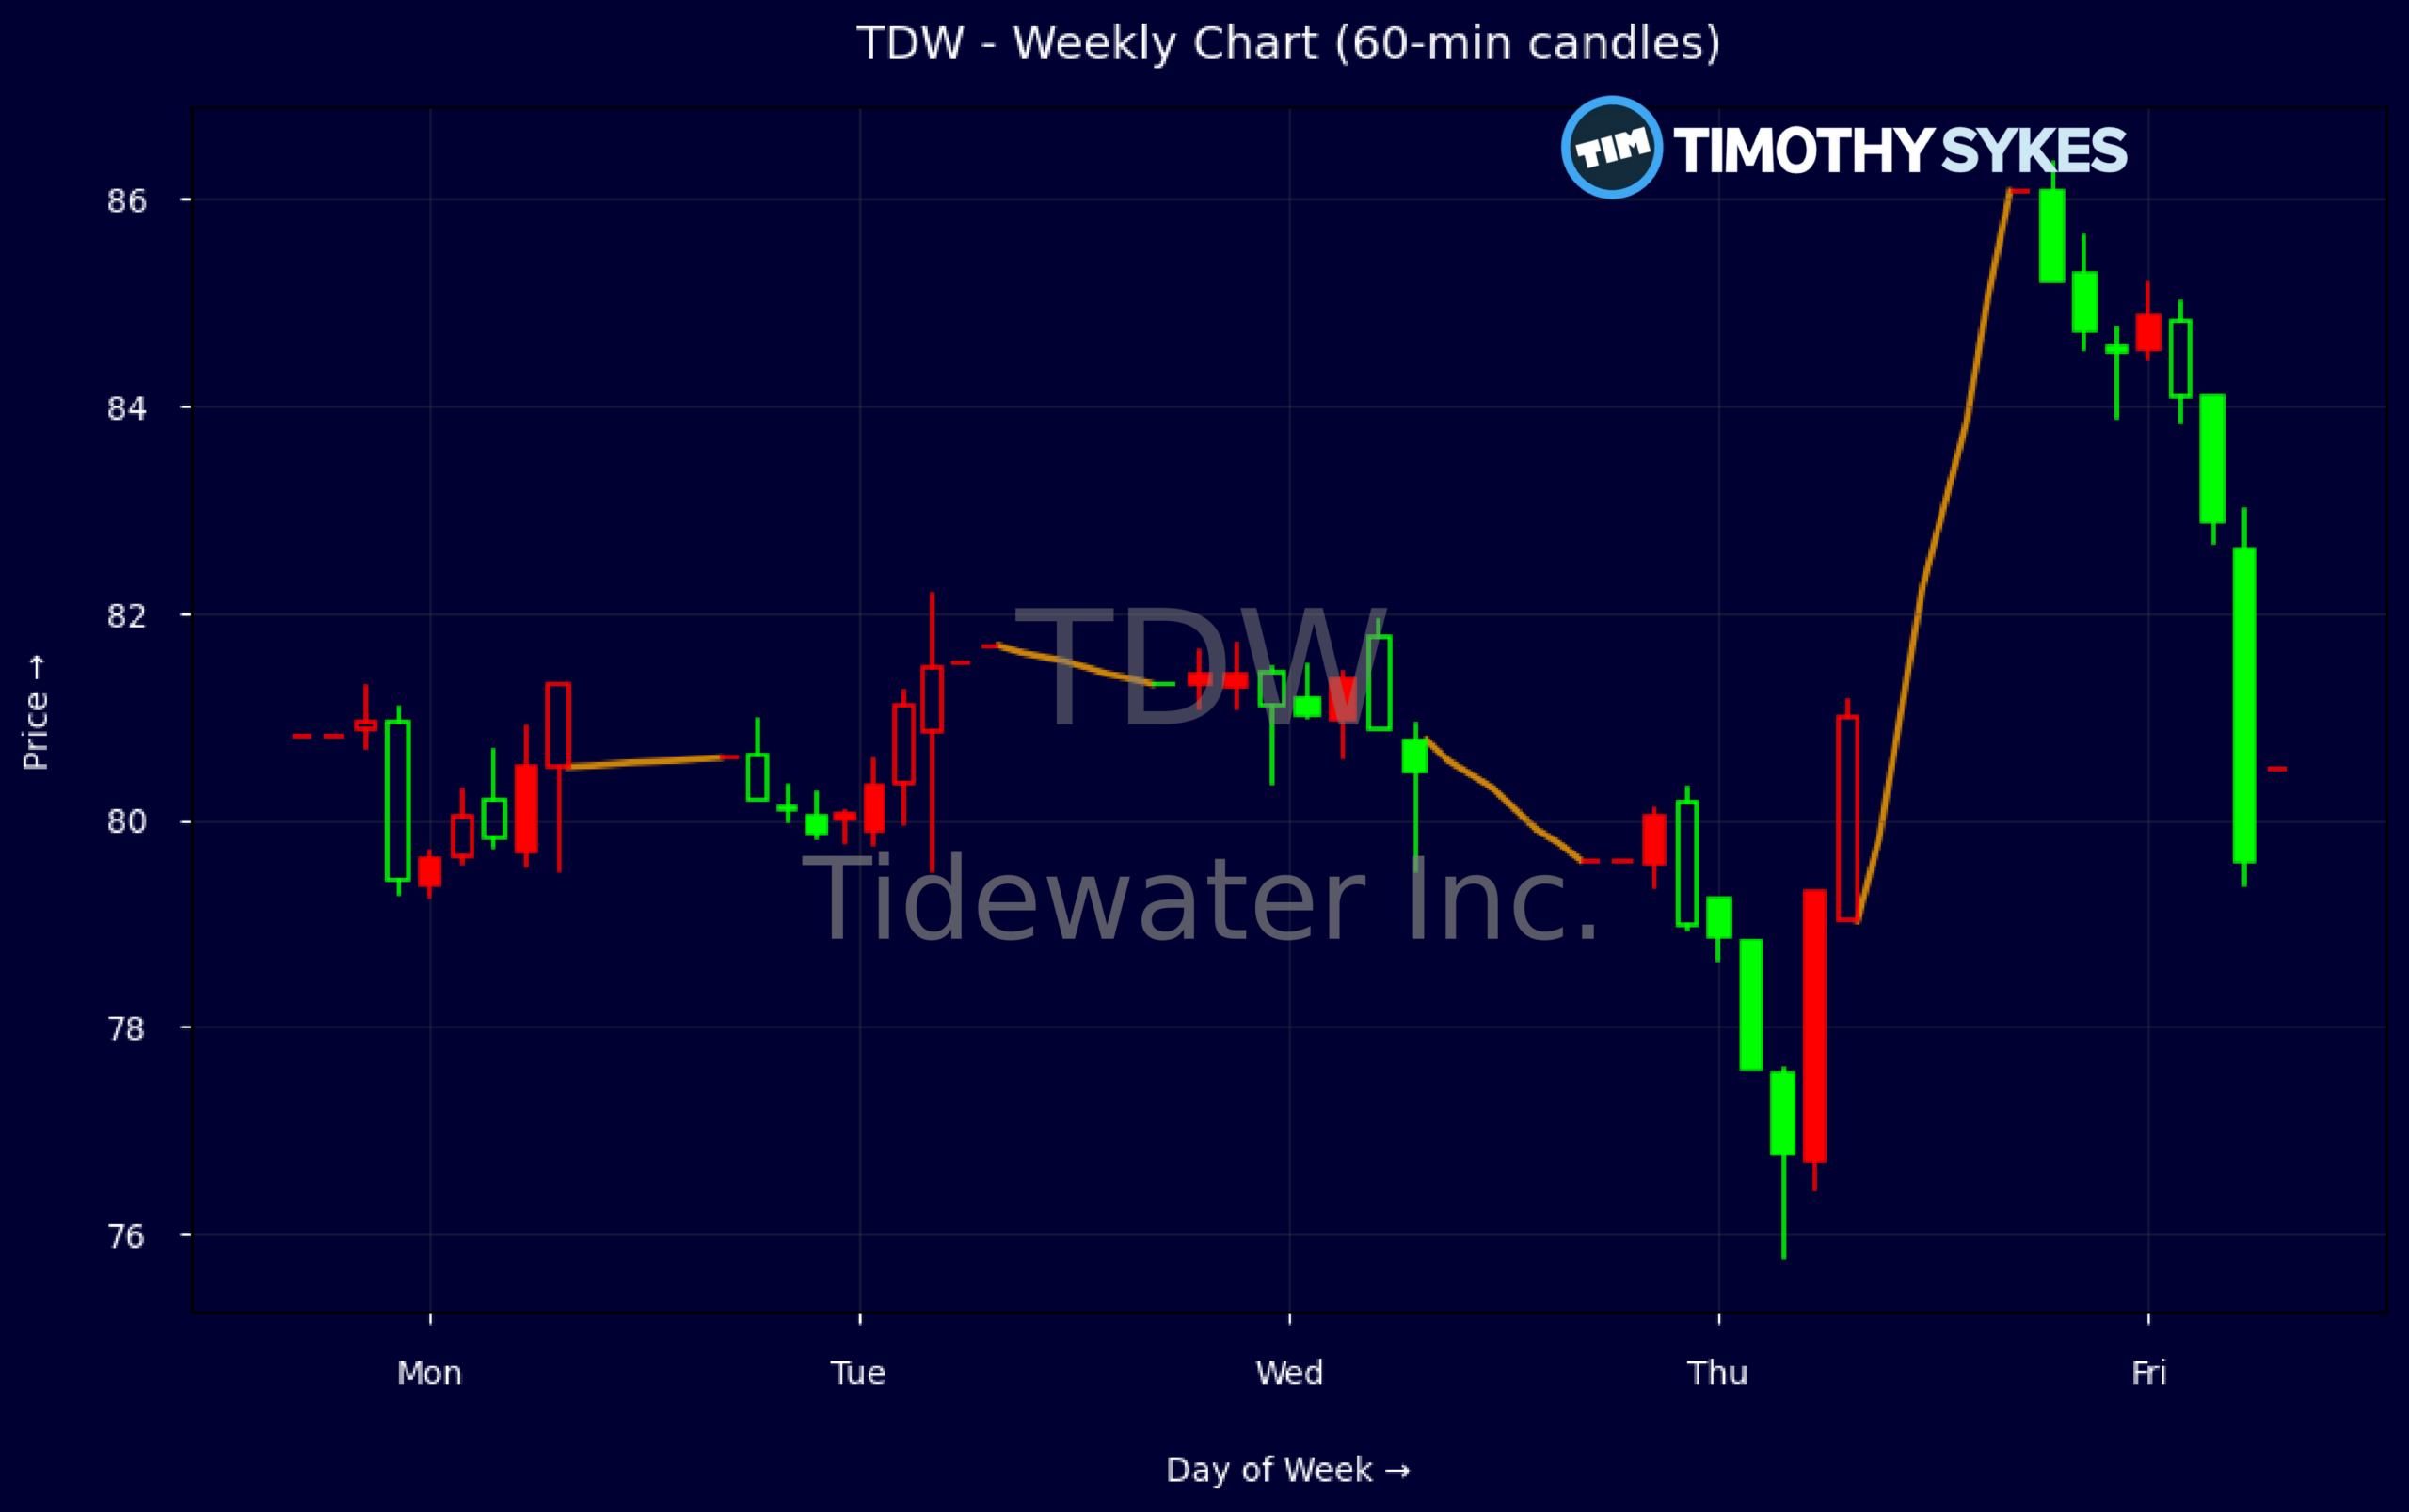
Weekly Update Oct 19 – Oct 23, 2026: On Friday, October 23, 2026 Tidewater Inc. stock [NYSE: TDW] is trending up by 8.4%! Discover the key drivers behind this movement as well as our expert analysis in the detailed breakdown below.
Energy industry expert:
Analyst sentiment – positive
Tidewater (TDW) is a leading global offshore support vessel operator, now firmly in the high-return phase of the cycle. Revenue of ~$1.35bn with 3‑year and 5‑year CAGRs of 19.6% and 30.8% underscores strong secular recovery. EBITDA margin of 16.3% and EBIT margin of 4.8% are mid-cycle but moving higher as dayrates reprice. ROE above 19% (LTM) and ROIC ~17% confirm capital discipline, while net leverage is modest (D/E 0.47, current ratio 3.6) with ample liquidity (~$614m cash).
Technically, TDW is in a strong uptrend on the weekly tape, with price jumping from the low $80s to $86.07, printing successive higher closes and a clear upside momentum expansion. Intraday 5‑minute candles show persistent buying on dips with responsive demand near $80–81 and limited downside follow-through, suggesting institutions are adding. Key actionable level: $80 is primary support and buy zone; a weekly close above $86–87 should trigger a momentum breakout toward the low $90s.
Near-term news flow is quiet, but macro drivers—tight OSV supply, rising offshore FID activity, and extended Energy/Fossil Fuels capex cycles—are decisively favorable versus sector benchmarks. TDW offers higher earnings torque and better balance sheet strength than most offshore peers. I expect continued multiple support around 17–18x earnings with upside as margins expand. My 6–12 month target is $95, with support at $80 and secondary support near $74; resistance sits at $90 then $100.
More Breaking News
Quick Financial Overview
Tidewater Inc. (TDW) is trading near the top of its recent weekly range, moving from roughly $80 to about $86 over the latest bars. That push to fresh highs, without deep pullbacks, tells traders that supply is getting absorbed quickly. On the intraday tape, TDW opened in the low $80s, dipped briefly, then climbed in a staircase pattern toward the mid-$80s and closed right near the high print. This combination of strong weekly close and firm intraday action is classic momentum behavior.
On the fundamentals, TDW generated about $1.35B in revenue over the trailing period, with gross margin near 28%. Operating margin and net margin are both positive, and EBITDA margin above 16% shows decent operating leverage. At a price-to-sales of about 3.2 and a P/E near 17.4, Tidewater Inc. is not in deep-value territory, but those numbers are in line with a profitable, growing operator. For a short-term trader, that means the tape has fundamental backing rather than pure story-driven hype.
The balance sheet adds another layer. Current ratio sits around 3.6, quick ratio about 3.4, and total debt-to-equity is under 0.5, showing strong liquidity and moderate leverage. Recent quarterly cash flow from operations of roughly $67M and free cash flow around $52M show TDW throwing off real cash while still investing about $15M in equipment. Returns on equity above 19% (LTM) and return on assets above 11% (LTM) confirm that Tidewater Inc. is using capital efficiently. That combination of cash, margins, and returns supports buying interest when the chart starts to trend.
Conclusion
This is stock news, not investment advice. Timothy Sykes News delivers real-time stock market news focused on key catalysts driving short-term price movements. Our content is tailored for active traders and investors seeking to capitalize on rapid price fluctuations, particularly in volatile sectors like penny stocks. Readers come to us for detailed coverage on earnings reports, mergers, FDA approvals, new contracts, and unusual trading volumes that can trigger significant short-term price action. Some users utilize our news to explain sudden stock movements, while others rely on it for diligent research into potential investment opportunities.
Dive deeper into the world of trading with Timothy Sykes, renowned for his expertise in penny stocks. Explore his top picks and discover the strategies that have propelled him to success with these articles:
- Penny Stocks Trading Guide
- Best Penny Stocks Under $1 to Buy Today
- Top 8 Penny Stocks to Watch on Robinhood
Once you’ve got some stocks on watch, elevate your trading game with StocksToTrade the ultimate platform for traders. With specialized tools for swing and day trading, StocksToTrade will guide you through the market’s twists and turns.
Dig into StocksToTrade’s watchlists here:





Leave a reply