

Stellantis N.V. stocks have been trading down by -5.15 percent amid investor concern over weakening global auto demand.
Key Takeaways STLA Traders Are Watching
- The EU plans to impose, starting as soon as 2026/12/01, a 350,000‑car annual cap on Chinese hybrid imports, reshaping Europe’s competitive landscape for global automakers with Chinese-made hybrids.
- Planned 2026 vehicle production in Italy is set to fall about 10%, cutting Mirafiori output to roughly 450,000 units and slashing hybrid Fiat 500 volumes from 100,000 to 60,000.
- Production at the Rennes, Sochaux, and Mulhouse plants will pause in October due to long‑range EV battery shortages from Automotive Cells Co., Stellantis’ JV with Mercedes and TotalEnergies.
- US Q3 sales at 324,277 units were essentially flat year over year for Stellantis N.V., while General Motors saw a 5.5% decline, highlighting relative resilience in a weak market.
- Canadian union Unifor approved strike authorization with 97.3% support, and production at the Windsor plant is canceled through at least the week of 2026/11/02, adding headline labor risk.
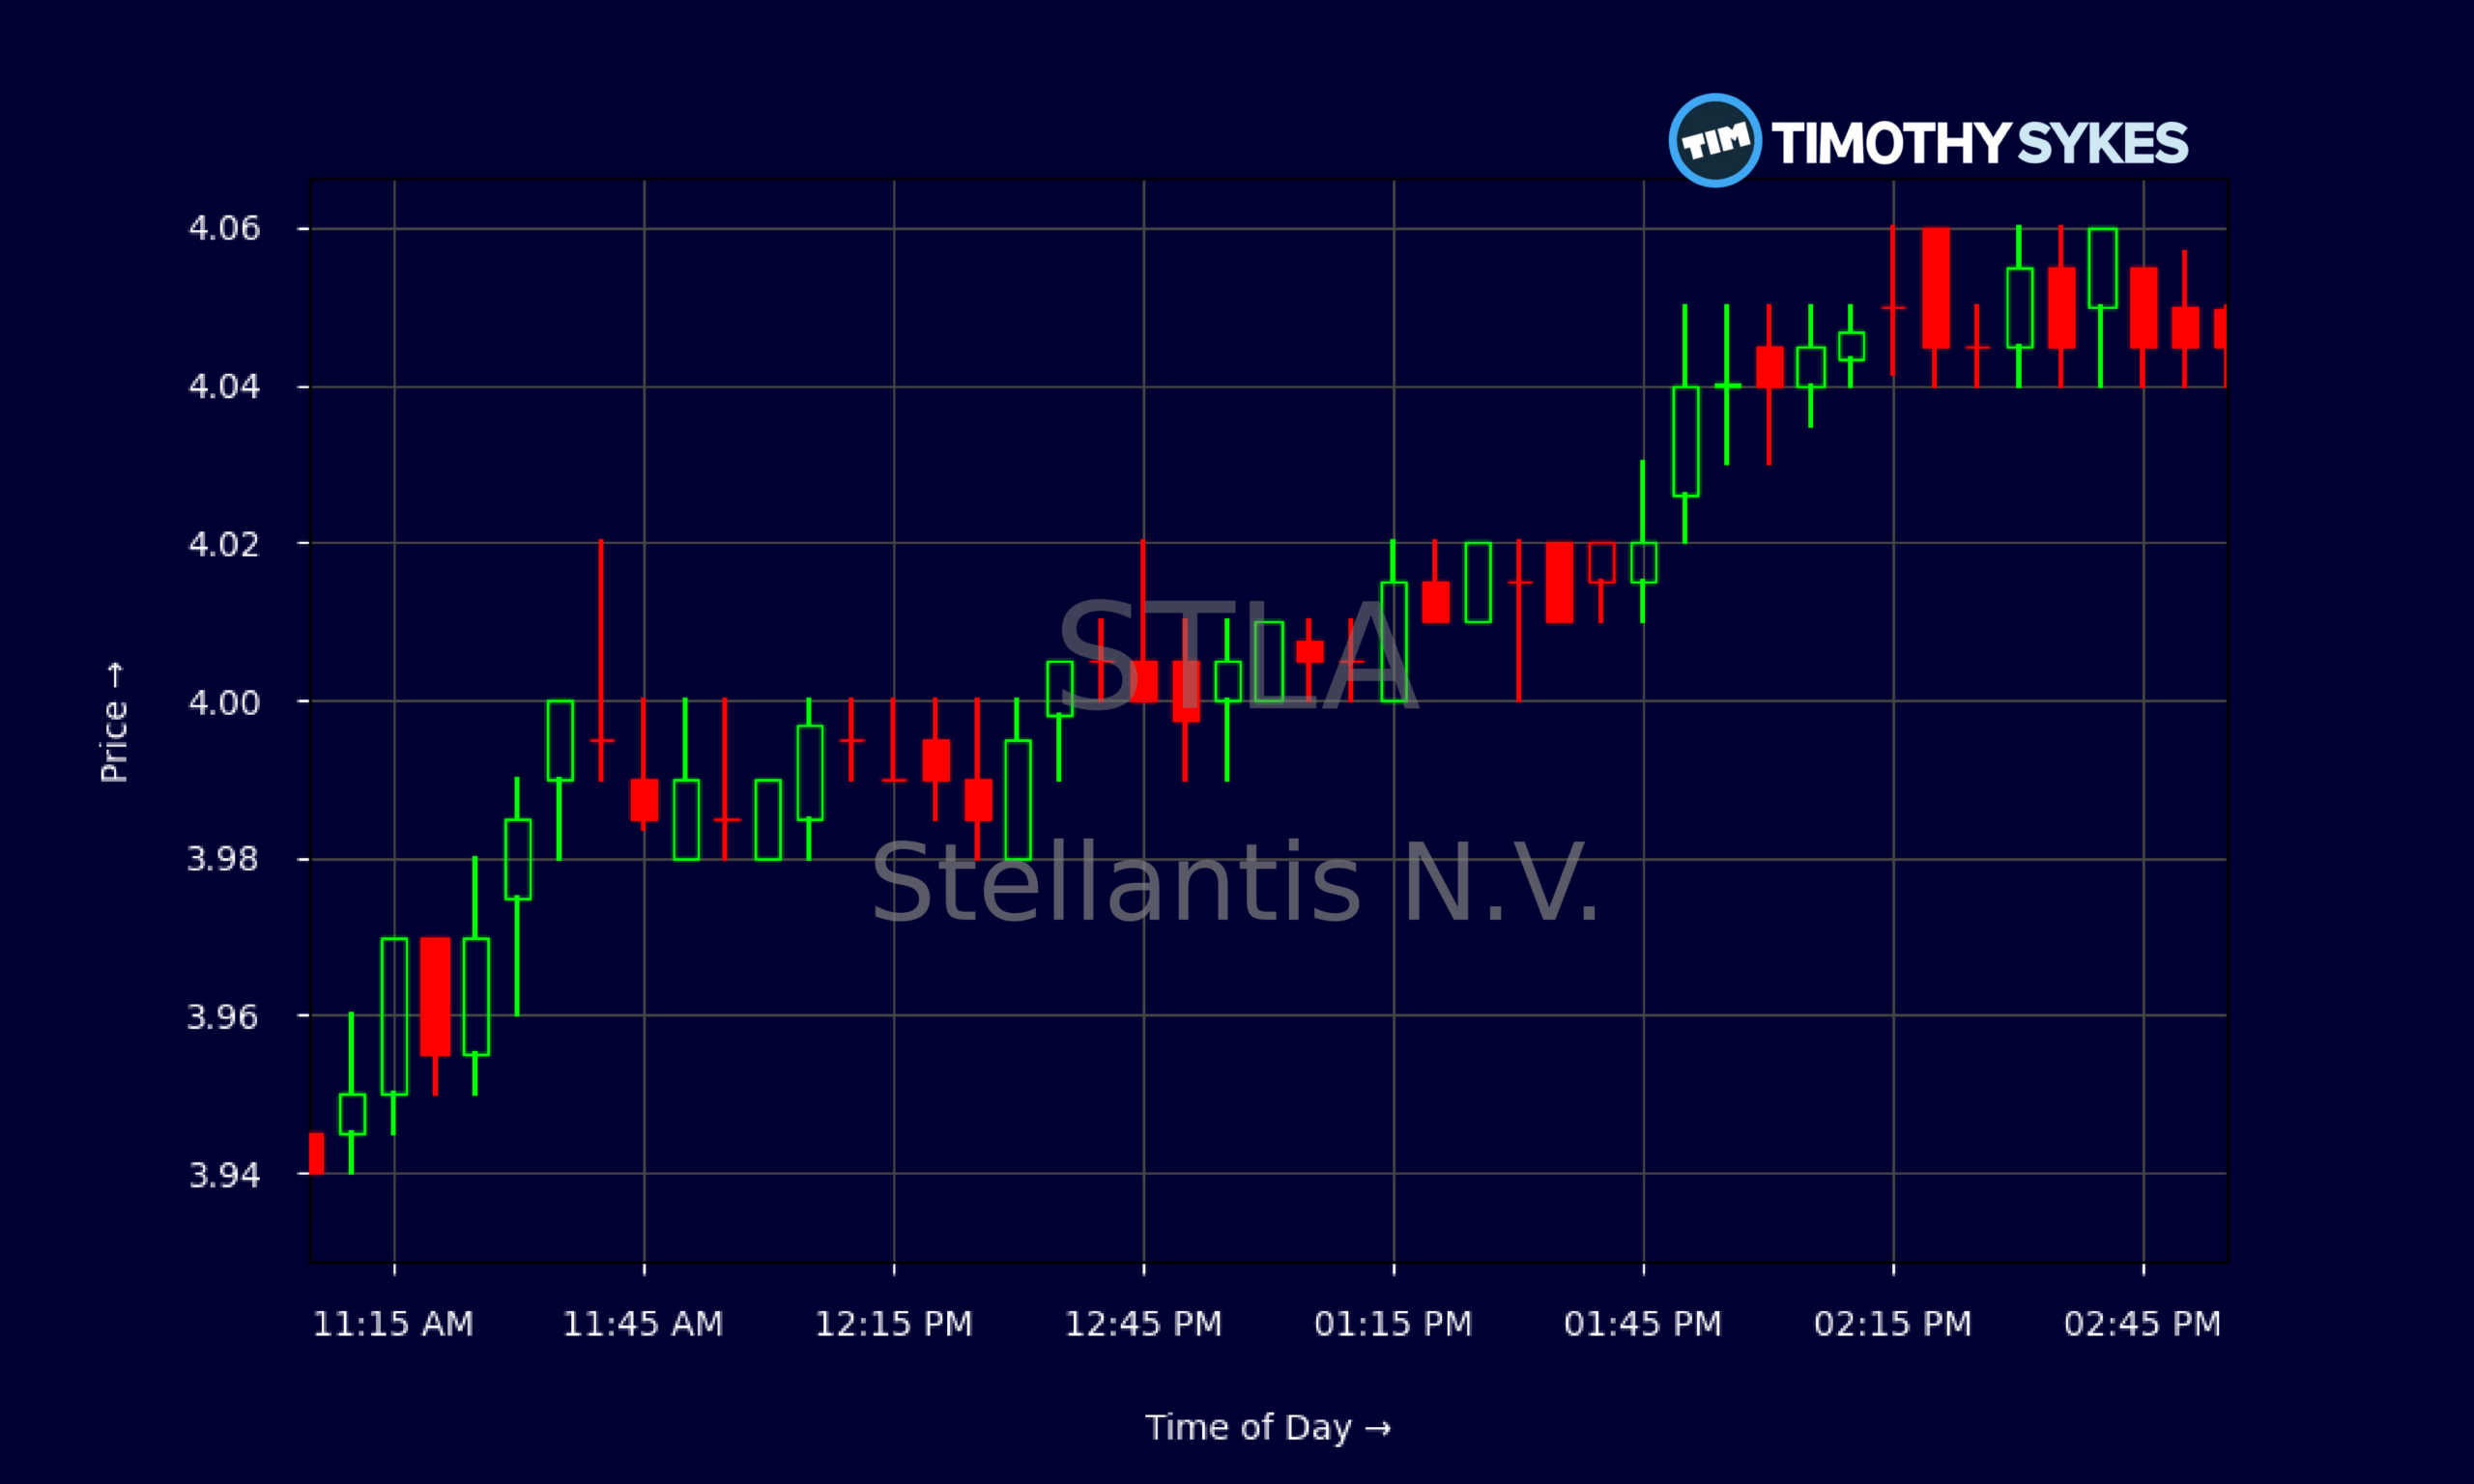
Live Update At 15:02:14 EDT: On Friday, October 23, 2026 Stellantis N.V. stock [NYSE: STLA] is trending down by -5.15%! Discover the key drivers behind this movement as well as our expert analysis in the detailed breakdown below.
Quick Financial Overview
STLA is trading like a value play that keeps bumping into real-world problems. Over the last few weeks, Stellantis N.V. has drifted lower from about $4.69 on 2026/10/01 to roughly $4.05, with a series of lower highs on the daily chart. That tells traders the uptrend broke and supply is in control.
Intraday, STLA has been stuck in a tight band between about $3.93 and $4.06. The 5‑minute chart looks heavy, with repeated fades near $4.05–$4.06 and no real push toward the earlier $4.60s area. For short-term traders, that’s classic consolidation after a pullback, but the bias tilts bearish until the stock proves it can reclaim prior resistance.
More Breaking News
Under the hood, Stellantis N.V. still throws around big numbers. Revenue sits near $153.5B, yet the market values the company at only a tiny fraction of sales, with a price‑to‑sales ratio of about 0.07 and price‑to‑book near 0.21. STLA carries a leverageratio of 3.6 and long-term debt around $30.2B against total assets of $195.2B. That mix says “strong balance sheet, but low market confidence.” For traders, cheap can stay cheap if headlines stay negative.
Why Traders Are Watching STLA Now
This is a busy tape for Stellantis N.V., and STLA is reacting to a cluster of operational hits more than any single headline.
Start with Europe. Stellantis plans to cut 2026 vehicle production in Italy by about 10%, trimming total output to roughly 450,000 units. The Mirafiori plant is central here. Hybrid Fiat 500 volumes are expected to fall from 100,000 to 60,000 units. That is not just a rounding error; it weakens a key hybrid model in a core European market. For STLA traders, fewer units usually means weaker revenue visibility and less confidence in forward earnings.
France adds another layer. Stellantis N.V. will temporarily halt production at Rennes and Sochaux, and shut the Mulhouse plant for part of October, mainly due to long‑range EV battery shortages from Automotive Cells Co., the joint venture with Mercedes and TotalEnergies. Separate reports tie these pauses at three French factories directly to long‑range battery shortages and note that the headlines triggered an intraday drop of roughly 4%–4.6% in STLA. That’s the tape telling you the market cares about EV execution risk.
On top of that, Canadian union Unifor’s members at Stellantis have voted 97.3% in favor of strike authorization, while production at Windsor is already canceled through at least the week of 2026/11/02. A legal strike is not in place yet, but for STLA traders this is a “loaded gun on the table” scenario. Any escalation could hit North American production and margins.
The one relative bright spot: US Q3 sales at 324,277 units were flat year over year, while General Motors reported a 5.5% drop. That shows Stellantis N.V. holding share in a soft market, partially offsetting the European pain but not reversing the overall bearish tone.
Layer all of this onto the EU’s planned 350,000‑unit annual cap on Chinese hybrid imports, starting as early as 2026/12/01. That regulatory shift might eventually favor local production from Stellantis N.V., but in the near term it adds more uncertainty for any STLA exposure to Chinese‑built hybrids.
Conclusion
For active traders, STLA is a classic battleground name. Stellantis N.V. looks statistically cheap on paper, with massive revenue, solid asset backing, and low price‑to‑sales and price‑to‑book ratios. But the current news flow explains why the market keeps that discount in place. Production cuts in Italy, EV battery shortages in France, and potential labor disruption in Canada all hit the same weak spot: execution in a complicated EV and hybrid transition.
In the short term, STLA trades like it has a ceiling around recent highs and soft support near the $4.00 area. If more negative headlines land — especially around Windsor or extended battery shortages — traders will watch for breakdowns below recent lows and possible acceleration to the downside. On the flip side, any clear resolution on batteries or labor could spark sharp sympathy bounces, because sentiment is already leaning bearish.
This is exactly the kind of chart‑plus‑headline setup Tim Sykes talks about when he says, “The market rewards prepared traders who react, not hopeful traders who predict.” As millionaire penny stock trader and teacher Tim Sykes says, “It’s not about how much money you make; it’s about how much money you keep.” For Stellantis N.V. and STLA, that means doing the homework, tracking every production and policy headline, and being ready to cut losses fast if the story breaks against you. This article is for educational and research purposes only and is not investment advice.
This is stock news, not investment advice. Timothy Sykes News delivers real-time stock market news focused on key catalysts driving short-term price movements. Our content is tailored for active traders and investors seeking to capitalize on rapid price fluctuations, particularly in volatile sectors like penny stocks. Readers come to us for detailed coverage on earnings reports, mergers, FDA approvals, new contracts, and unusual trading volumes that can trigger significant short-term price action. Some users utilize our news to explain sudden stock movements, while others rely on it for diligent research into potential investment opportunities.
Dive deeper into the world of trading with Timothy Sykes, renowned for his expertise in penny stocks. Explore his top picks and discover the strategies that have propelled him to success with these articles:
- Penny Stocks Trading Guide
- Best Penny Stocks Under $1 to Buy Today
- Top 8 Penny Stocks to Watch on Robinhood
Once you’ve got some stocks on watch, elevate your trading game with StocksToTrade the ultimate platform for traders. With specialized tools for swing and day trading, StocksToTrade will guide you through the market’s twists and turns.
Dig into StocksToTrade’s watchlists here:





Leave a reply