

Galaxy Digital Inc. stocks have been trading up by 7.99 percent amid upbeat sentiment surrounding Bitcoin’s latest rally and adoption.
Key Takeaways
- Price action in GLXY has broken down from the mid-$20s to the high teens, signaling a sharp sentiment shift and profit-taking after a strong run.
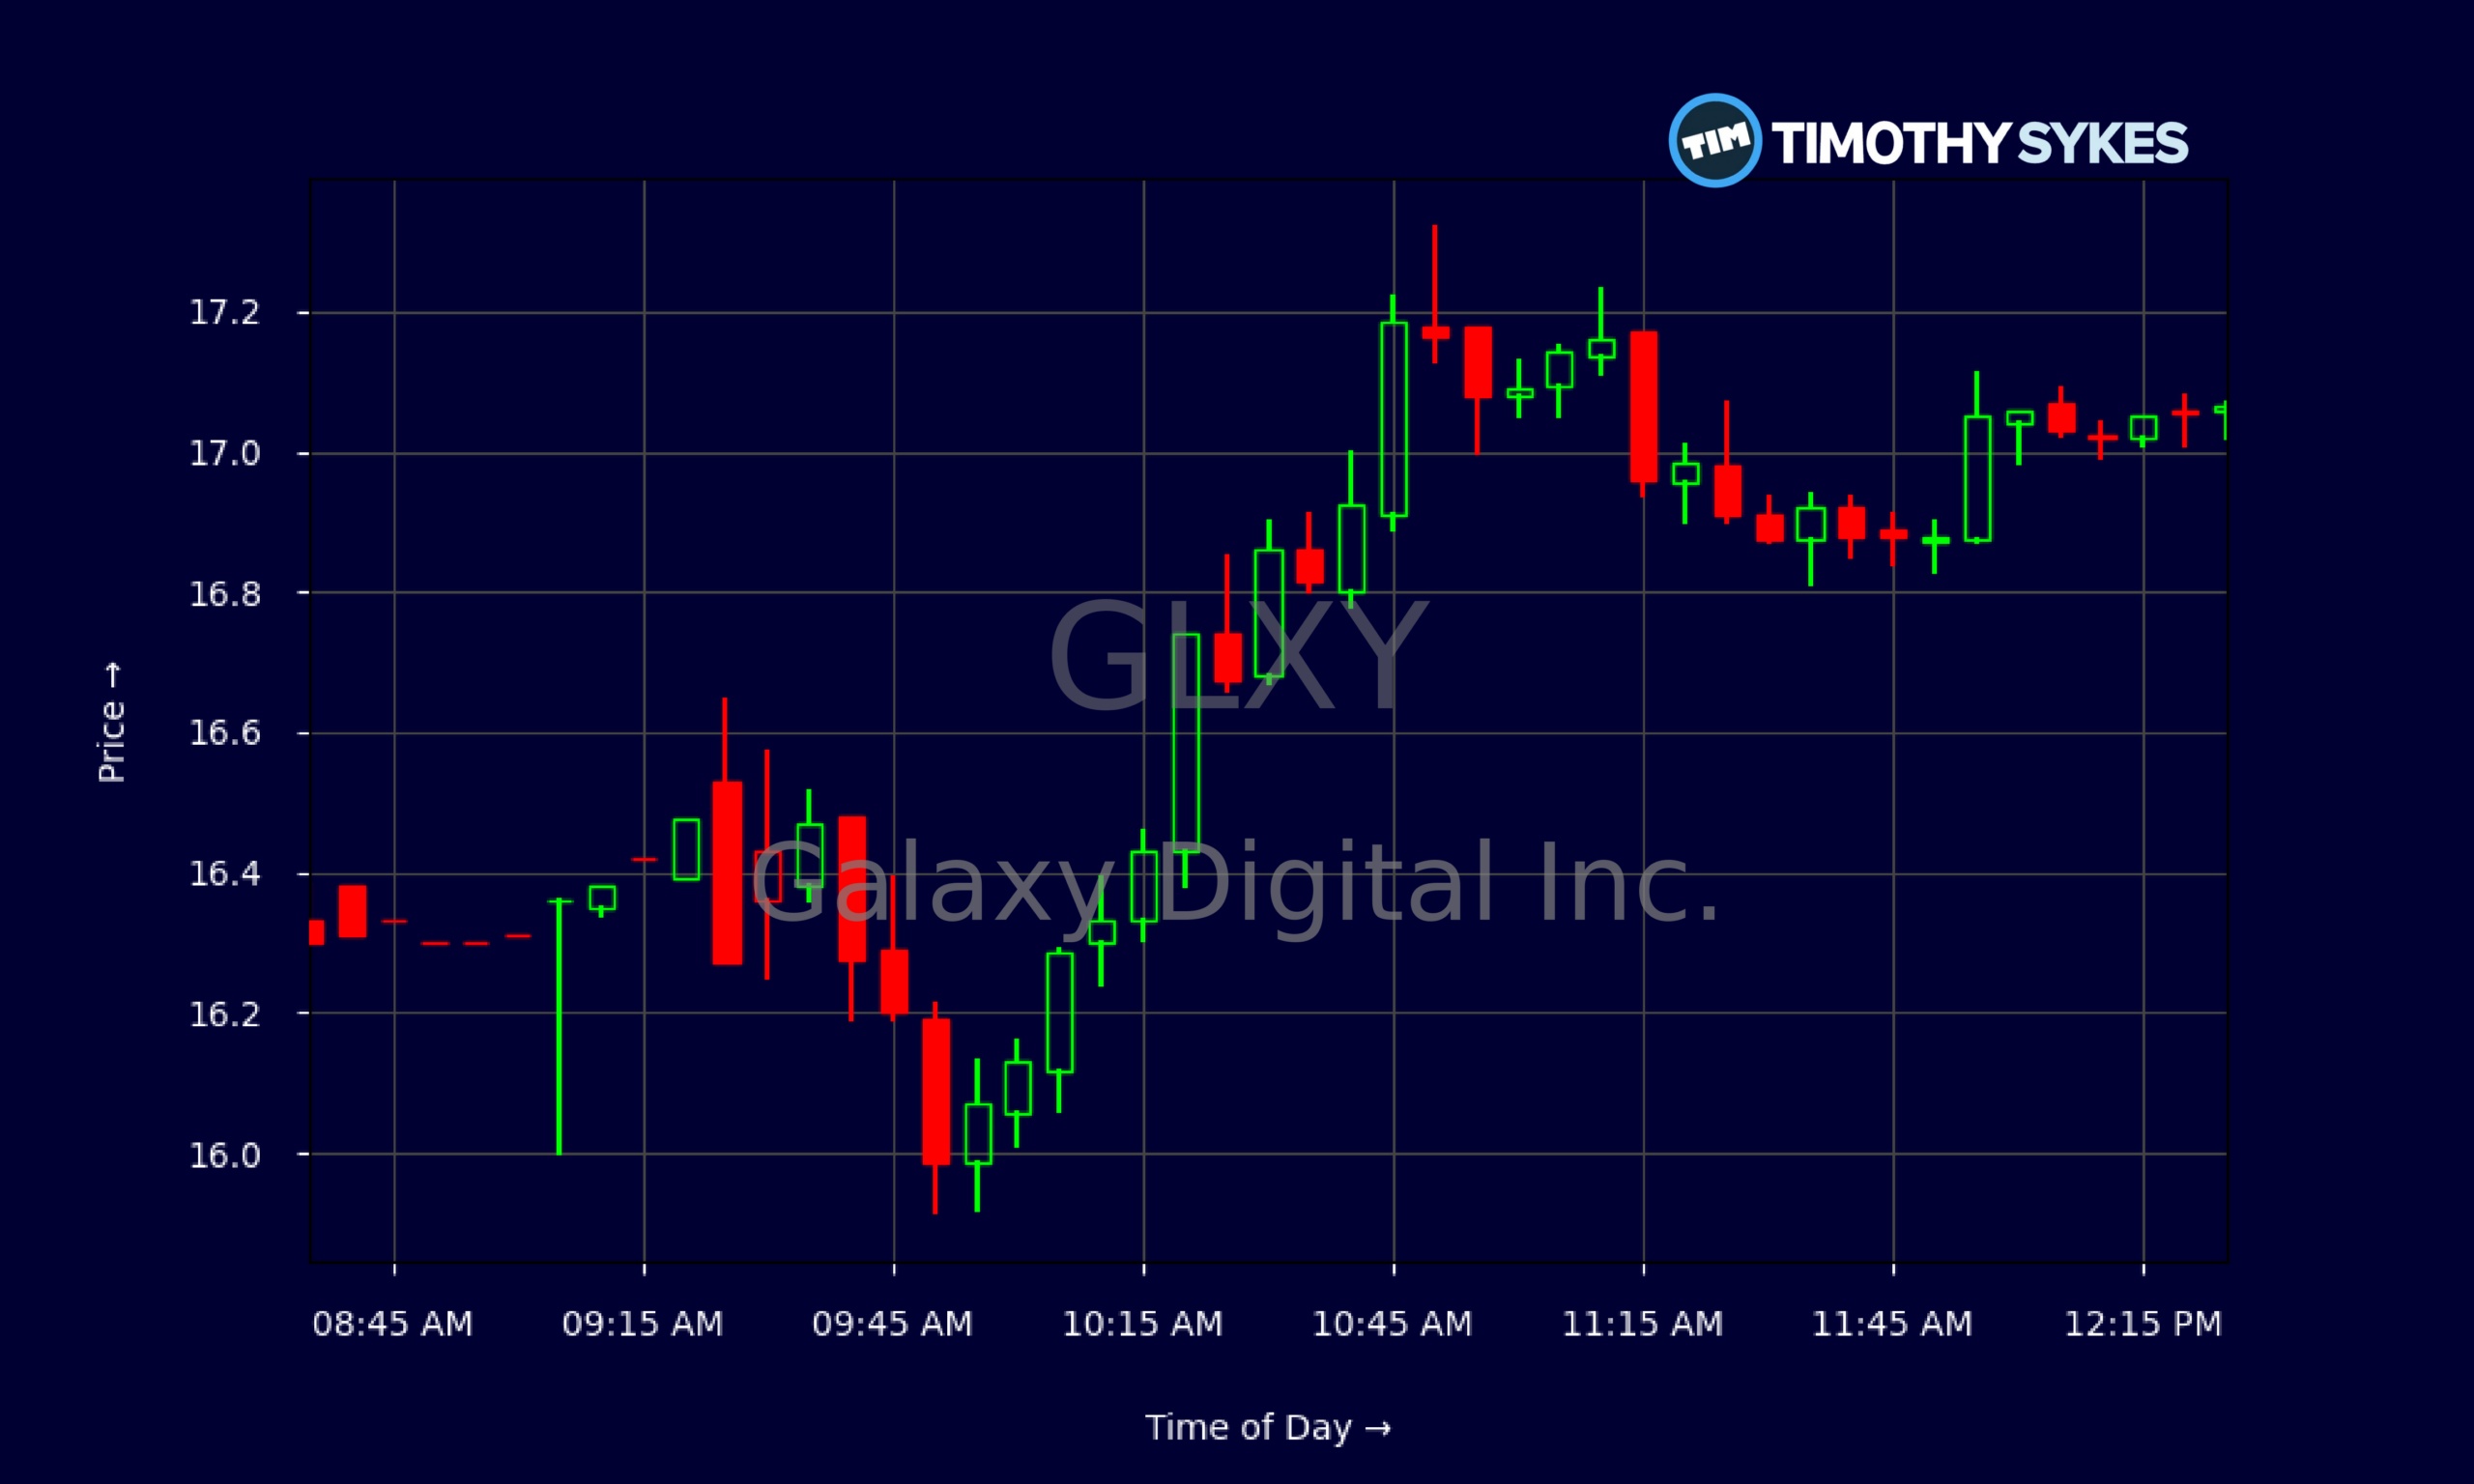
- Intraday GLXY trading shows a steady grind higher off the lows, hinting at short-term dip buying but no aggressive momentum yet.
- Galaxy Digital Inc.’s revenues are huge in dollar terms, but thin margins and recent losses keep GLXY squarely in turnaround territory.
- Leverage at GLXY is meaningful, yet liquidity ratios suggest the company still has room to maneuver without immediate balance-sheet stress.
- Active traders are laser-focused on whether GLXY can defend the mid-teens as a base for the next significant swing.
Live Update At 12:32:17 EDT: On Wednesday, October 21, 2026 Galaxy Digital Inc. stock [NASDAQ: GLXY] is trending up by 7.99%! Discover the key drivers behind this movement as well as our expert analysis in the detailed breakdown below.
Quick Financial Overview
GLXY is a classic fast-growth, thin-margin story. Galaxy Digital Inc. booked about $60.4B in revenue over the trailing period, but the profit picture is ugly. Net margins are deep in the red, with profit margins hovering around -0.5% to -0.8%. That tells traders GLXY is moving a lot of volume, but it is not turning that flow into steady earnings yet.
Valuation reflects that struggle. With a price-to-sales ratio around 0.14, the market is not paying much for each dollar of Galaxy Digital Inc. revenue. Price-to-book for GLXY near 4.4 shows traders are still willing to assign a premium to the company’s platform and growth options, despite current losses.
More Breaking News
On the balance sheet, total assets of roughly $10.8B versus equity near $1.8B and a leverage ratio of 6 show Galaxy Digital Inc. is using debt aggressively. Yet a current ratio around 1.5 and quick ratio near 1.1 give GLXY enough short-term liquidity to avoid panic, at least for now. For traders, that mix screams volatility and opportunity, not stability.
Why Traders Are Watching GLXY Price Action
The chart on GLXY tells the real story right now. Just a couple of weeks ago, Galaxy Digital Inc. was trading in the low-to-mid $20s, tagging highs above $24. Since then, GLXY has faded fast, closing most recently around $17 after touching an intraday low near $15.92. That is a steep correction, the kind of pullback that wipes out late longs and draws in disciplined dip traders.
Day by day, GLXY has been a stair-step lower: a series of lower highs from roughly $24 down into the high teens. At the same time, Galaxy Digital Inc. is starting to show signs of stabilization. The latest session opened near $16.44 and pushed as high as $17.32 before settling just above $17. That bounce tells traders there is real demand under $16, at least for a trade.
Zooming into the intraday action, GLXY built a base around $16.00–$16.30 early, then climbed steadily, holding higher lows through the morning. The tape shows controlled, methodical buying rather than wild spikes. For short-term traders, that pattern in Galaxy Digital Inc. looks like early accumulation after a flush.
Overlay that on the weak but improving income statement—Galaxy Digital Inc. posting positive operating income but negative net income—and GLXY becomes a classic “spec on momentum” name. Traders are not paying for current earnings; they are trading the swings. If crypto sentiment or broader risk appetite turns, GLXY is positioned to move hard in either direction.
Conclusion
GLXY is not a widows-and-orphans stock. Galaxy Digital Inc. runs with leverage, posts big revenues, and still prints losses. That blend sparks wide price ranges, and the recent slide from the $20s into the high teens proves it. For active traders, this is exactly the kind of backdrop where tight risk management and fast decision-making matter.
On the bullish side, GLXY still commands a premium to book, keeps a current ratio above 1, and just showed buyers stepping in around $16. Those early signs of support, combined with intraday higher lows, give Galaxy Digital Inc. a shot at building a tradable base. If that level cracks, though, traders should expect another leg down and more forced selling.
On the bearish side, negative returns on equity and assets remind everyone that Galaxy Digital Inc. is not firing on all cylinders. GLXY remains highly sensitive to risk sentiment and broader market swings. That means oversized opportunity and oversized danger live side by side.
As millionaire penny stock trader and teacher Tim Sykes says, “You must adapt to the market; the market will not adapt to you.”. Tim Sykes always drills the same message into traders: “Cut losses quickly, don’t believe the hype, and let the price action guide you.” With GLXY, that mindset is crucial. Treat Galaxy Digital Inc. like a trading vehicle, not a story to fall in love with, and let the chart—not your hope—call the shots.
This is stock news, not investment advice. Timothy Sykes News delivers real-time stock market news focused on key catalysts driving short-term price movements. Our content is tailored for active traders and investors seeking to capitalize on rapid price fluctuations, particularly in volatile sectors like penny stocks. Readers come to us for detailed coverage on earnings reports, mergers, FDA approvals, new contracts, and unusual trading volumes that can trigger significant short-term price action. Some users utilize our news to explain sudden stock movements, while others rely on it for diligent research into potential investment opportunities.
Dive deeper into the world of trading with Timothy Sykes, renowned for his expertise in penny stocks. Explore his top picks and discover the strategies that have propelled him to success with these articles:
- Penny Stocks Trading Guide
- Best Penny Stocks Under $1 to Buy Today
- Top 8 Penny Stocks to Watch on Robinhood
Once you’ve got some stocks on watch, elevate your trading game with StocksToTrade the ultimate platform for traders. With specialized tools for swing and day trading, StocksToTrade will guide you through the market’s twists and turns.
Dig into StocksToTrade’s watchlists here:





Leave a reply