

Olenox Industries Inc. stocks have been trading up by 53.12 percent following its transformative AI-driven manufacturing partnership announcement.
Key Takeaways
- OLOX has dropped from a recent spike above $1.80 to under $0.75, showing heavy selling pressure and failed breakouts.
- Olenox Industries Inc. is posting steep losses, with profit margins deeply negative and returns on equity far below zero.
- The balance sheet shows just over $1.2M in cash against more than $26M in current liabilities, a major liquidity red flag for traders.
- Intraday OLOX trading shows violent swings, ideal for disciplined day traders but dangerous for anyone who hesitates.
Live Update At 09:18:40 EDT: On Wednesday, October 21, 2026 Olenox Industries Inc. stock [NASDAQ: OLOX] is trending up by 53.12%! Discover the key drivers behind this movement as well as our expert analysis in the detailed breakdown below.
Quick Financial Overview
OLOX is trading like a classic troubled small-cap — volatile on the chart and ugly in the numbers. The recent daily action shows Olenox Industries Inc. spiking to $1.86 on 2026/10/06, then bleeding lower for weeks, now sitting in the mid-$0.70s. That kind of round trip tells traders one thing: the hype faded, and sellers are in control.
Under the hood, OLOX is losing money fast. Revenue is about $2.9M, but profit margins are massively negative at every level. Return on equity and return on assets are both deep in the red, which means Olenox Industries Inc. is not creating value for its capital base.
More Breaking News
Leverage is another concern. Total debt to equity is 1.36, and the current ratio is only 0.1. OLOX has just over $1.2M in cash but more than $26M in current liabilities. That’s a serious liquidity squeeze. For traders, this makes OLOX a high-risk, story-driven ticker where any bounce can be sharp, but the long-term financial trend is weak.
Why Traders Are Watching OLOX Price Action
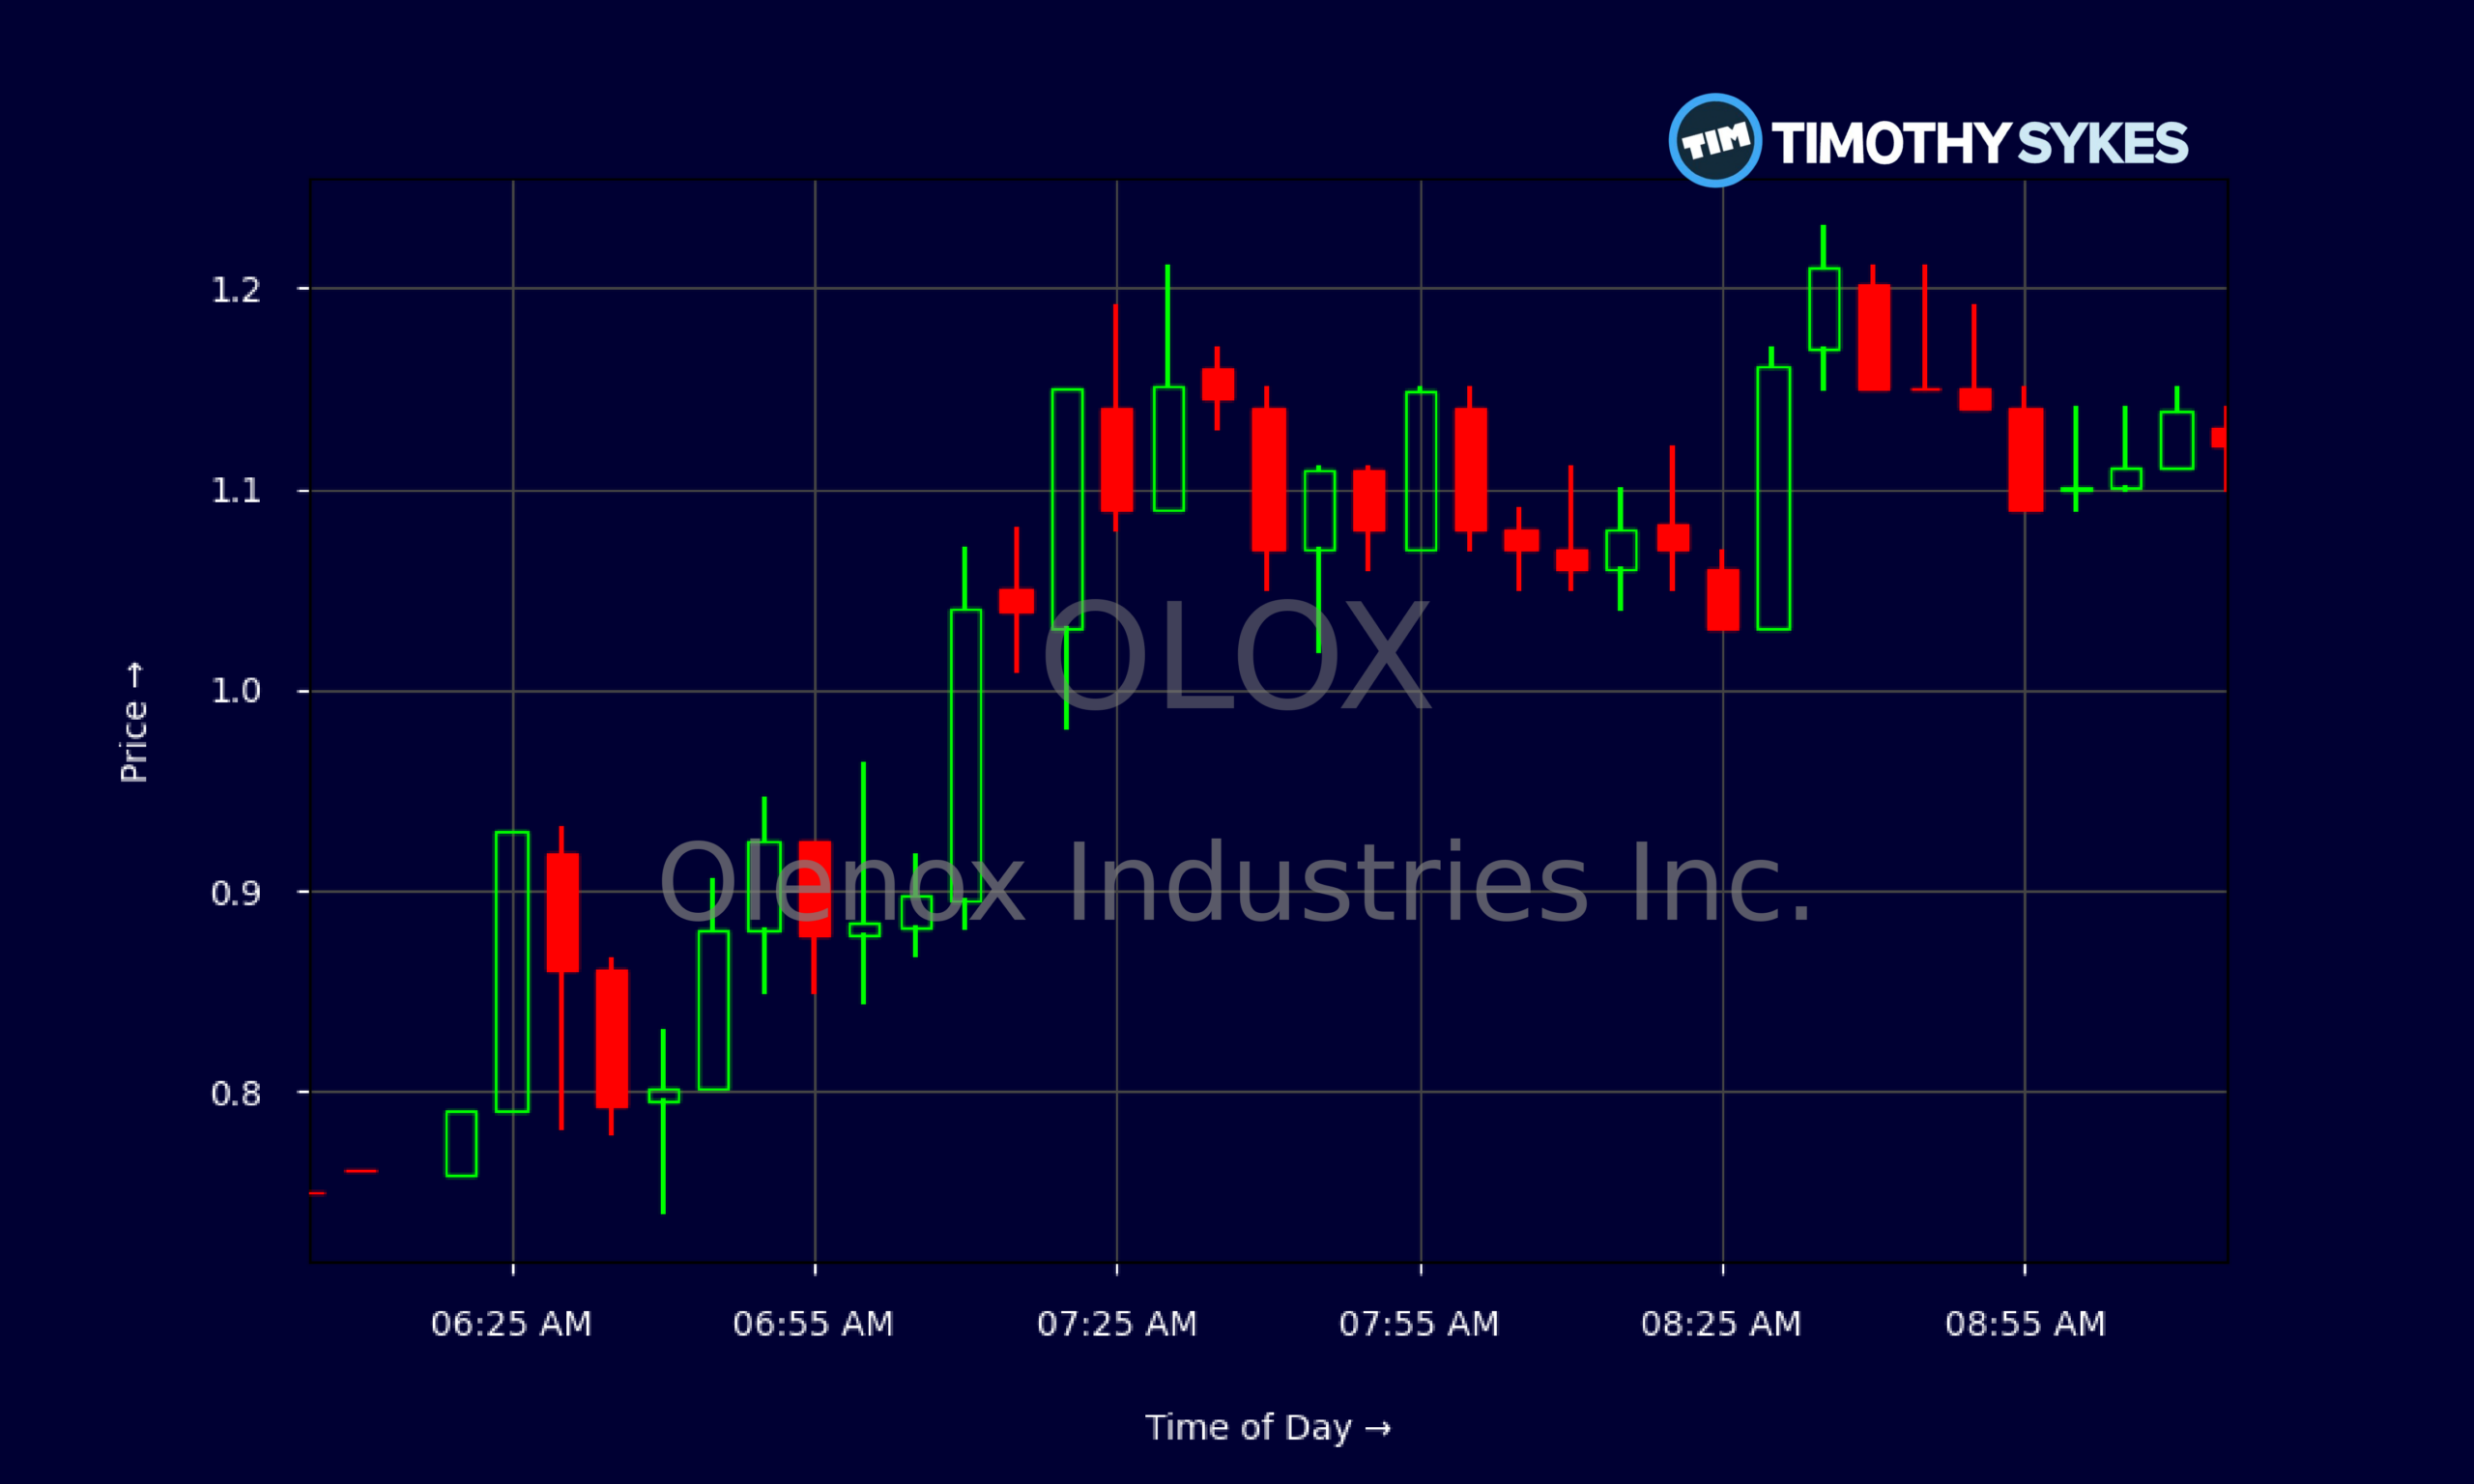
Even with rough fundamentals, OLOX is still attracting attention because the tape is wild. On the intraday 5‑minute chart, Olenox Industries Inc. ran from the mid‑$0.70s to above $1.20 early in the session, then chopped in a tight, fast range between $1.05 and $1.20. Moves like that show clear day-trading potential, especially for momentum traders who know how to manage risk.
The multi-day chart paints the bigger story. OLOX pushed from around $0.84 at the end of September to that $1.86 spike on 2026/10/06, then quickly cracked back under $1. From there, Olenox Industries Inc. made a series of lower highs and lower lows, closing recently around $0.74. That’s a textbook downtrend after a blow-off move.
For short-term trading, those broken levels matter. The $1 area on OLOX now acts as clear overhead resistance. Every time Olenox Industries Inc. pops toward that zone, sellers show up. On the downside, recent lows near $0.67–$0.70 form a key support band; a clean break below that range can trigger another leg lower as weak hands panic.
Traders who specialize in beaten-down names are tracking OLOX because this setup often leads to sharp, short-lived squeezes. If volume floods back in, Olenox Industries Inc. can rip 20–40% in a day. But the same volatility that creates opportunity also punishes anyone who overstays.
Conclusion
OLOX sits in that dangerous but tradeable zone: ugly fundamentals, tight liquidity, and a chart that has already punished late longs. Olenox Industries Inc. is running negative EBITDA around -$1.1M, heavy operating losses, and a working capital deficit of more than $22M. Cash flow improved last quarter, but that came with a net loss of roughly $3.2M. The core business for OLOX is still burning cash, not generating it.
For active traders, that backdrop sets expectations. Olenox Industries Inc. is not a safe, steady compounder; it is a speculative ticker driven by sentiment, liquidity, and technical levels. The best moves are likely to come from oversold bounces, breakouts over clear resistance, or panic flushes that reverse intraday.
That’s where discipline matters. In the words often repeated in the Tim Sykes community, “Cut losses quickly — always.” As millionaire penny stock trader and teacher Tim Sykes says, “The goal is not to win every trade but to protect your capital and keep moving forward.”. OLOX demands exactly that mindset. Traders watching Olenox Industries Inc. need a plan before entering, clear risk levels, and the humility to walk away when the price action turns. Treat OLOX as a trading vehicle, not a long-term promise, and focus on the chart, volume, and your rules above everything else.
This analysis is for educational and research purposes only and is not investment advice.
This is stock news, not investment advice. Timothy Sykes News delivers real-time stock market news focused on key catalysts driving short-term price movements. Our content is tailored for active traders and investors seeking to capitalize on rapid price fluctuations, particularly in volatile sectors like penny stocks. Readers come to us for detailed coverage on earnings reports, mergers, FDA approvals, new contracts, and unusual trading volumes that can trigger significant short-term price action. Some users utilize our news to explain sudden stock movements, while others rely on it for diligent research into potential investment opportunities.
Dive deeper into the world of trading with Timothy Sykes, renowned for his expertise in penny stocks. Explore his top picks and discover the strategies that have propelled him to success with these articles:
- Penny Stocks Trading Guide
- Best Penny Stocks Under $1 to Buy Today
- Top 8 Penny Stocks to Watch on Robinhood
Once you’ve got some stocks on watch, elevate your trading game with StocksToTrade the ultimate platform for traders. With specialized tools for swing and day trading, StocksToTrade will guide you through the market’s twists and turns.
Dig into StocksToTrade’s watchlists here:





Leave a reply