

Exascale Labs Holdings Inc. stocks have been trading down by -14.54 percent following reports of delayed product launches and revenue concerns.
Key Takeaways
- Shares of Exascale Labs Holdings Inc. have run from sub-$1 to above $3 this month, with XLAB now pulling back and consolidating around the mid-$2s.
- Recent daily candles show wide trading ranges and sharp reversals, signaling aggressive momentum trading and elevated risk in XLAB.
- Financials for Exascale Labs Holdings Inc. show $7.0M in revenue but deep losses and negative equity, typical of a high‑risk early-stage name.
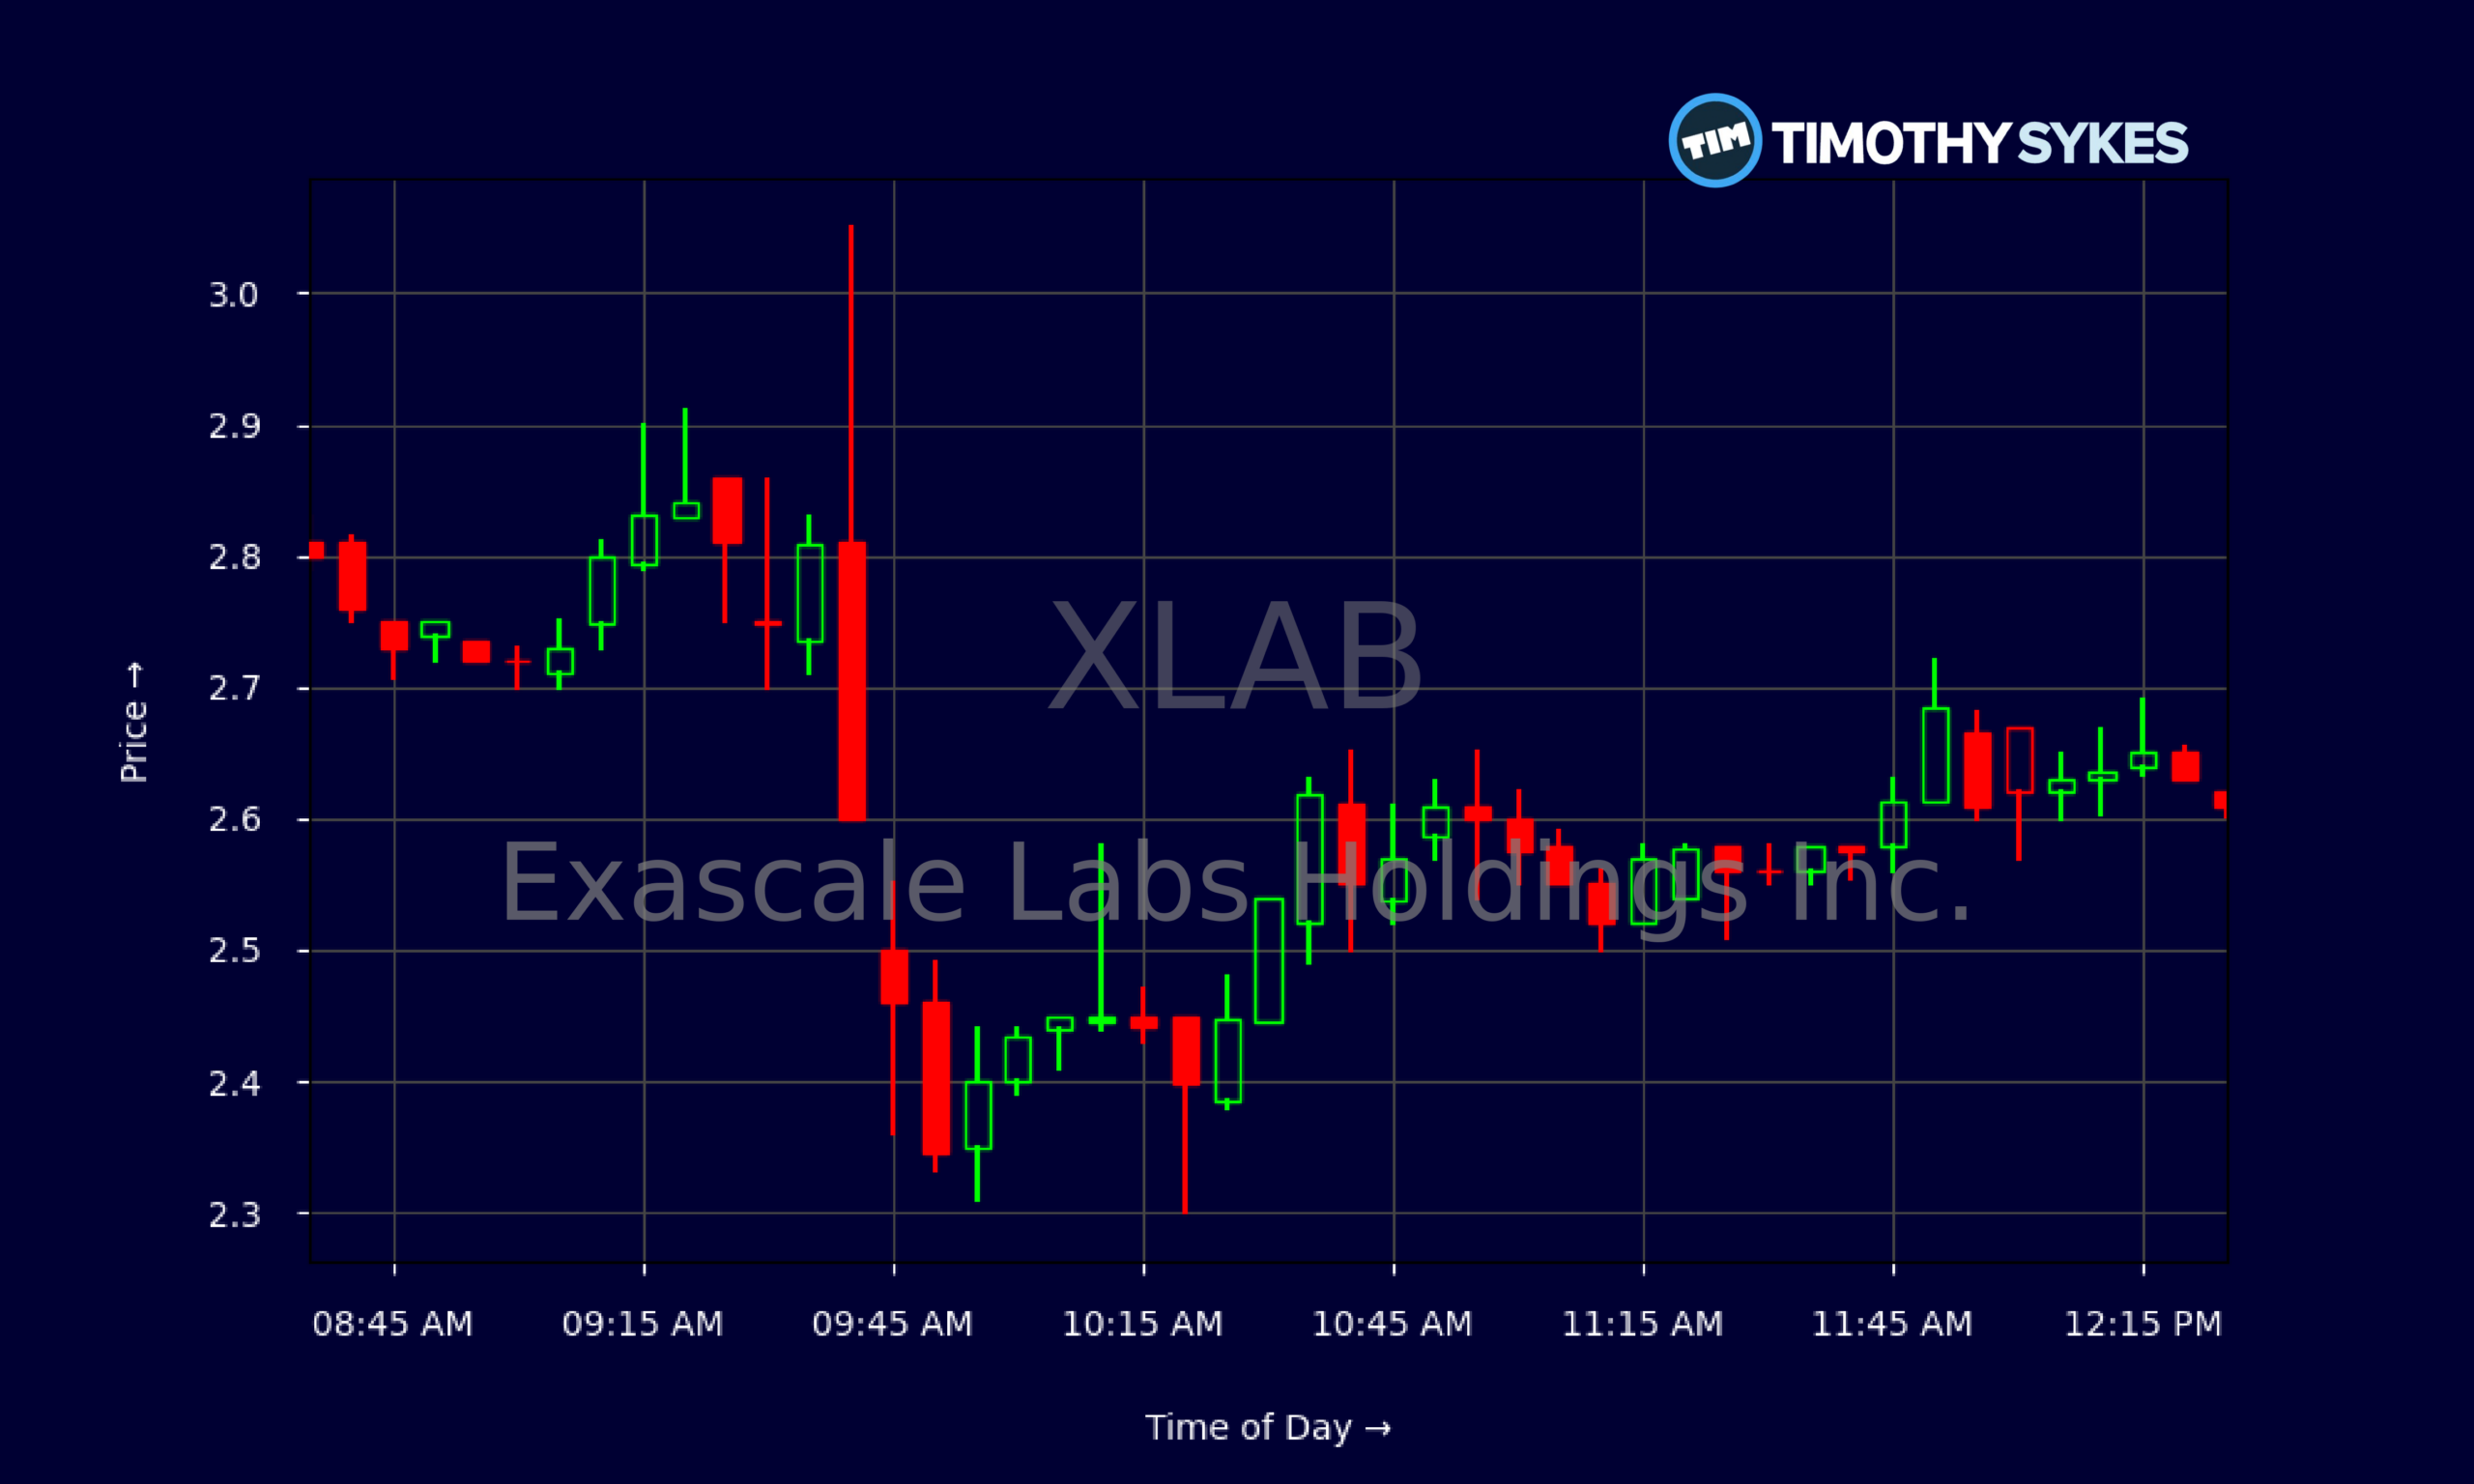
- XLAB’s intraday tape now shows tighter action between $2.40 and $2.70, suggesting short-term consolidation after the recent spike.
- Traders are watching Exascale Labs Holdings Inc. for a potential secondary breakout or a fade back toward prior support near $2.00.
Live Update At 12:32:50 EDT: On Tuesday, October 20, 2026 Exascale Labs Holdings Inc. stock [NASDAQ: XLAB] is trending down by -14.54%! Discover the key drivers behind this movement as well as our expert analysis in the detailed breakdown below.
Quick Financial Overview
Exascale Labs Holdings Inc., trading under ticker XLAB, is a classic high‑risk, high‑volatility small-cap story. On the fundamentals, the company reported about $7.0M in revenue, which is modest, but the real story is the lack of profits. XLAB shows a pretax profit margin of roughly -70.1%, meaning the company loses around $0.70 for every $1.00 it brings in. That is steep.
The balance sheet is also aggressive. Exascale Labs Holdings Inc. carries total assets of about $7.3M against total liabilities of roughly $20.3M, leaving stockholders’ equity deep in the red at around -$13.0M. Book value per share sits near -$0.20, and the price‑to‑sales ratio near 16.7 tells traders that XLAB is richly priced relative to current revenue.
More Breaking News
There is one bright spot: cash flow. Exascale Labs Holdings Inc. generated positive operating cash flow of roughly $2.7M in the most recent quarter, largely helped by working capital shifts and stock issuance. XLAB finished the period with about $4.2M in cash and $7.2M in total cash and equivalents, giving the company some near‑term runway, but the negative returns on assets near -36% keep this firmly in speculative territory.
Why Traders Are Watching XLAB Price Action
The chart is what has the XLAB crowd locked in right now. Over the last few weeks, Exascale Labs Holdings Inc. has gone from a sleepy sub‑$1 stock to a wild momentum play. On 2026/10/14, XLAB closed near $0.91. By 2026/10/16, the stock printed a high just under $3.84 and closed at $2.35. That’s a parabolic move by any standard.
After that run, Exascale Labs Holdings Inc. continued squeezing. On 2026/10/19, XLAB opened at $2.80, ripped to $3.27, then closed at $3.06. The very next day, it gapped down, traded as low as about $2.30, and finished around $2.62. Those big wicks on both sides tell traders there’s real tug‑of‑war between momentum longs and short sellers.
Zooming into the intraday data, XLAB spent the premarket in the high‑$2.70s to low‑$2.80s, then spiked to $3.05 at the open. That first 30 minutes saw Exascale Labs Holdings Inc. swing from $2.81 to $3.05 and then dump toward the mid‑$2.30s. Classic overextension and profit‑taking. From late morning into midday, XLAB tightened into a band between roughly $2.50 and $2.70, with repeated bounces off the low‑$2.50s.
For traders, this pattern is textbook. Exascale Labs Holdings Inc. has already made its first big leg. Now XLAB is consolidating, volume is likely rotating between weak hands and stronger traders, and the stock is carving out new support. A clean push back through the $2.80–$3.00 zone with volume would signal a potential second leg higher. A breakdown through $2.30 opens the door to a deeper fade back toward the prior $2.00 area and possibly the high‑$1s where XLAB based earlier in the month.
Conclusion
Right now, Exascale Labs Holdings Inc. sits at the intersection of ugly fundamentals and beautiful trading volatility. On paper, XLAB is losing money, running a negative margin near -70.1%, and carrying negative equity. The company’s price‑to‑sales near 16.7 and negative book value tell experienced traders this is not a conservative value play. This is a momentum vehicle.
At the same time, Exascale Labs Holdings Inc. has real cash in the bank and positive recent operating cash flow, which helps explain why traders are willing to speculate. XLAB’s chart shows a recent parabolic move, followed by an orderly dip and consolidation. That combination — strong prior trend, clear levels, and a tightening range — is exactly what short‑term traders hunt for.
As Tim Sykes likes to hammer home, “Volatility is your friend if you’re prepared, and your worst enemy if you’re not.” As millionaire penny stock trader and teacher Tim Sykes, says, “The goal is not to win every trade but to protect your capital and keep moving forward.”. XLAB fits that idea perfectly. Traders focusing on Exascale Labs Holdings Inc. should map key support around $2.30 and resistance around $2.80–$3.00, use tight risk, and avoid chasing the middle of the range. This stock will reward discipline and punish laziness. Study the chart, respect the risk, and let XLAB’s price action, not hope, guide your trading decisions.
This is stock news, not investment advice. Timothy Sykes News delivers real-time stock market news focused on key catalysts driving short-term price movements. Our content is tailored for active traders and investors seeking to capitalize on rapid price fluctuations, particularly in volatile sectors like penny stocks. Readers come to us for detailed coverage on earnings reports, mergers, FDA approvals, new contracts, and unusual trading volumes that can trigger significant short-term price action. Some users utilize our news to explain sudden stock movements, while others rely on it for diligent research into potential investment opportunities.
Dive deeper into the world of trading with Timothy Sykes, renowned for his expertise in penny stocks. Explore his top picks and discover the strategies that have propelled him to success with these articles:
- Penny Stocks Trading Guide
- Best Penny Stocks Under $1 to Buy Today
- Top 8 Penny Stocks to Watch on Robinhood
Once you’ve got some stocks on watch, elevate your trading game with StocksToTrade the ultimate platform for traders. With specialized tools for swing and day trading, StocksToTrade will guide you through the market’s twists and turns.
Dig into StocksToTrade’s watchlists here:





Leave a reply