

CleanSpark Inc. stocks have been trading down by -15.64 percent following bearish sentiment over bitcoin price volatility and mining margins.
Key Takeaways
- Price action in CLSK shows a steady pullback from the $10 zone into the high-$6s, putting key support levels back in play.
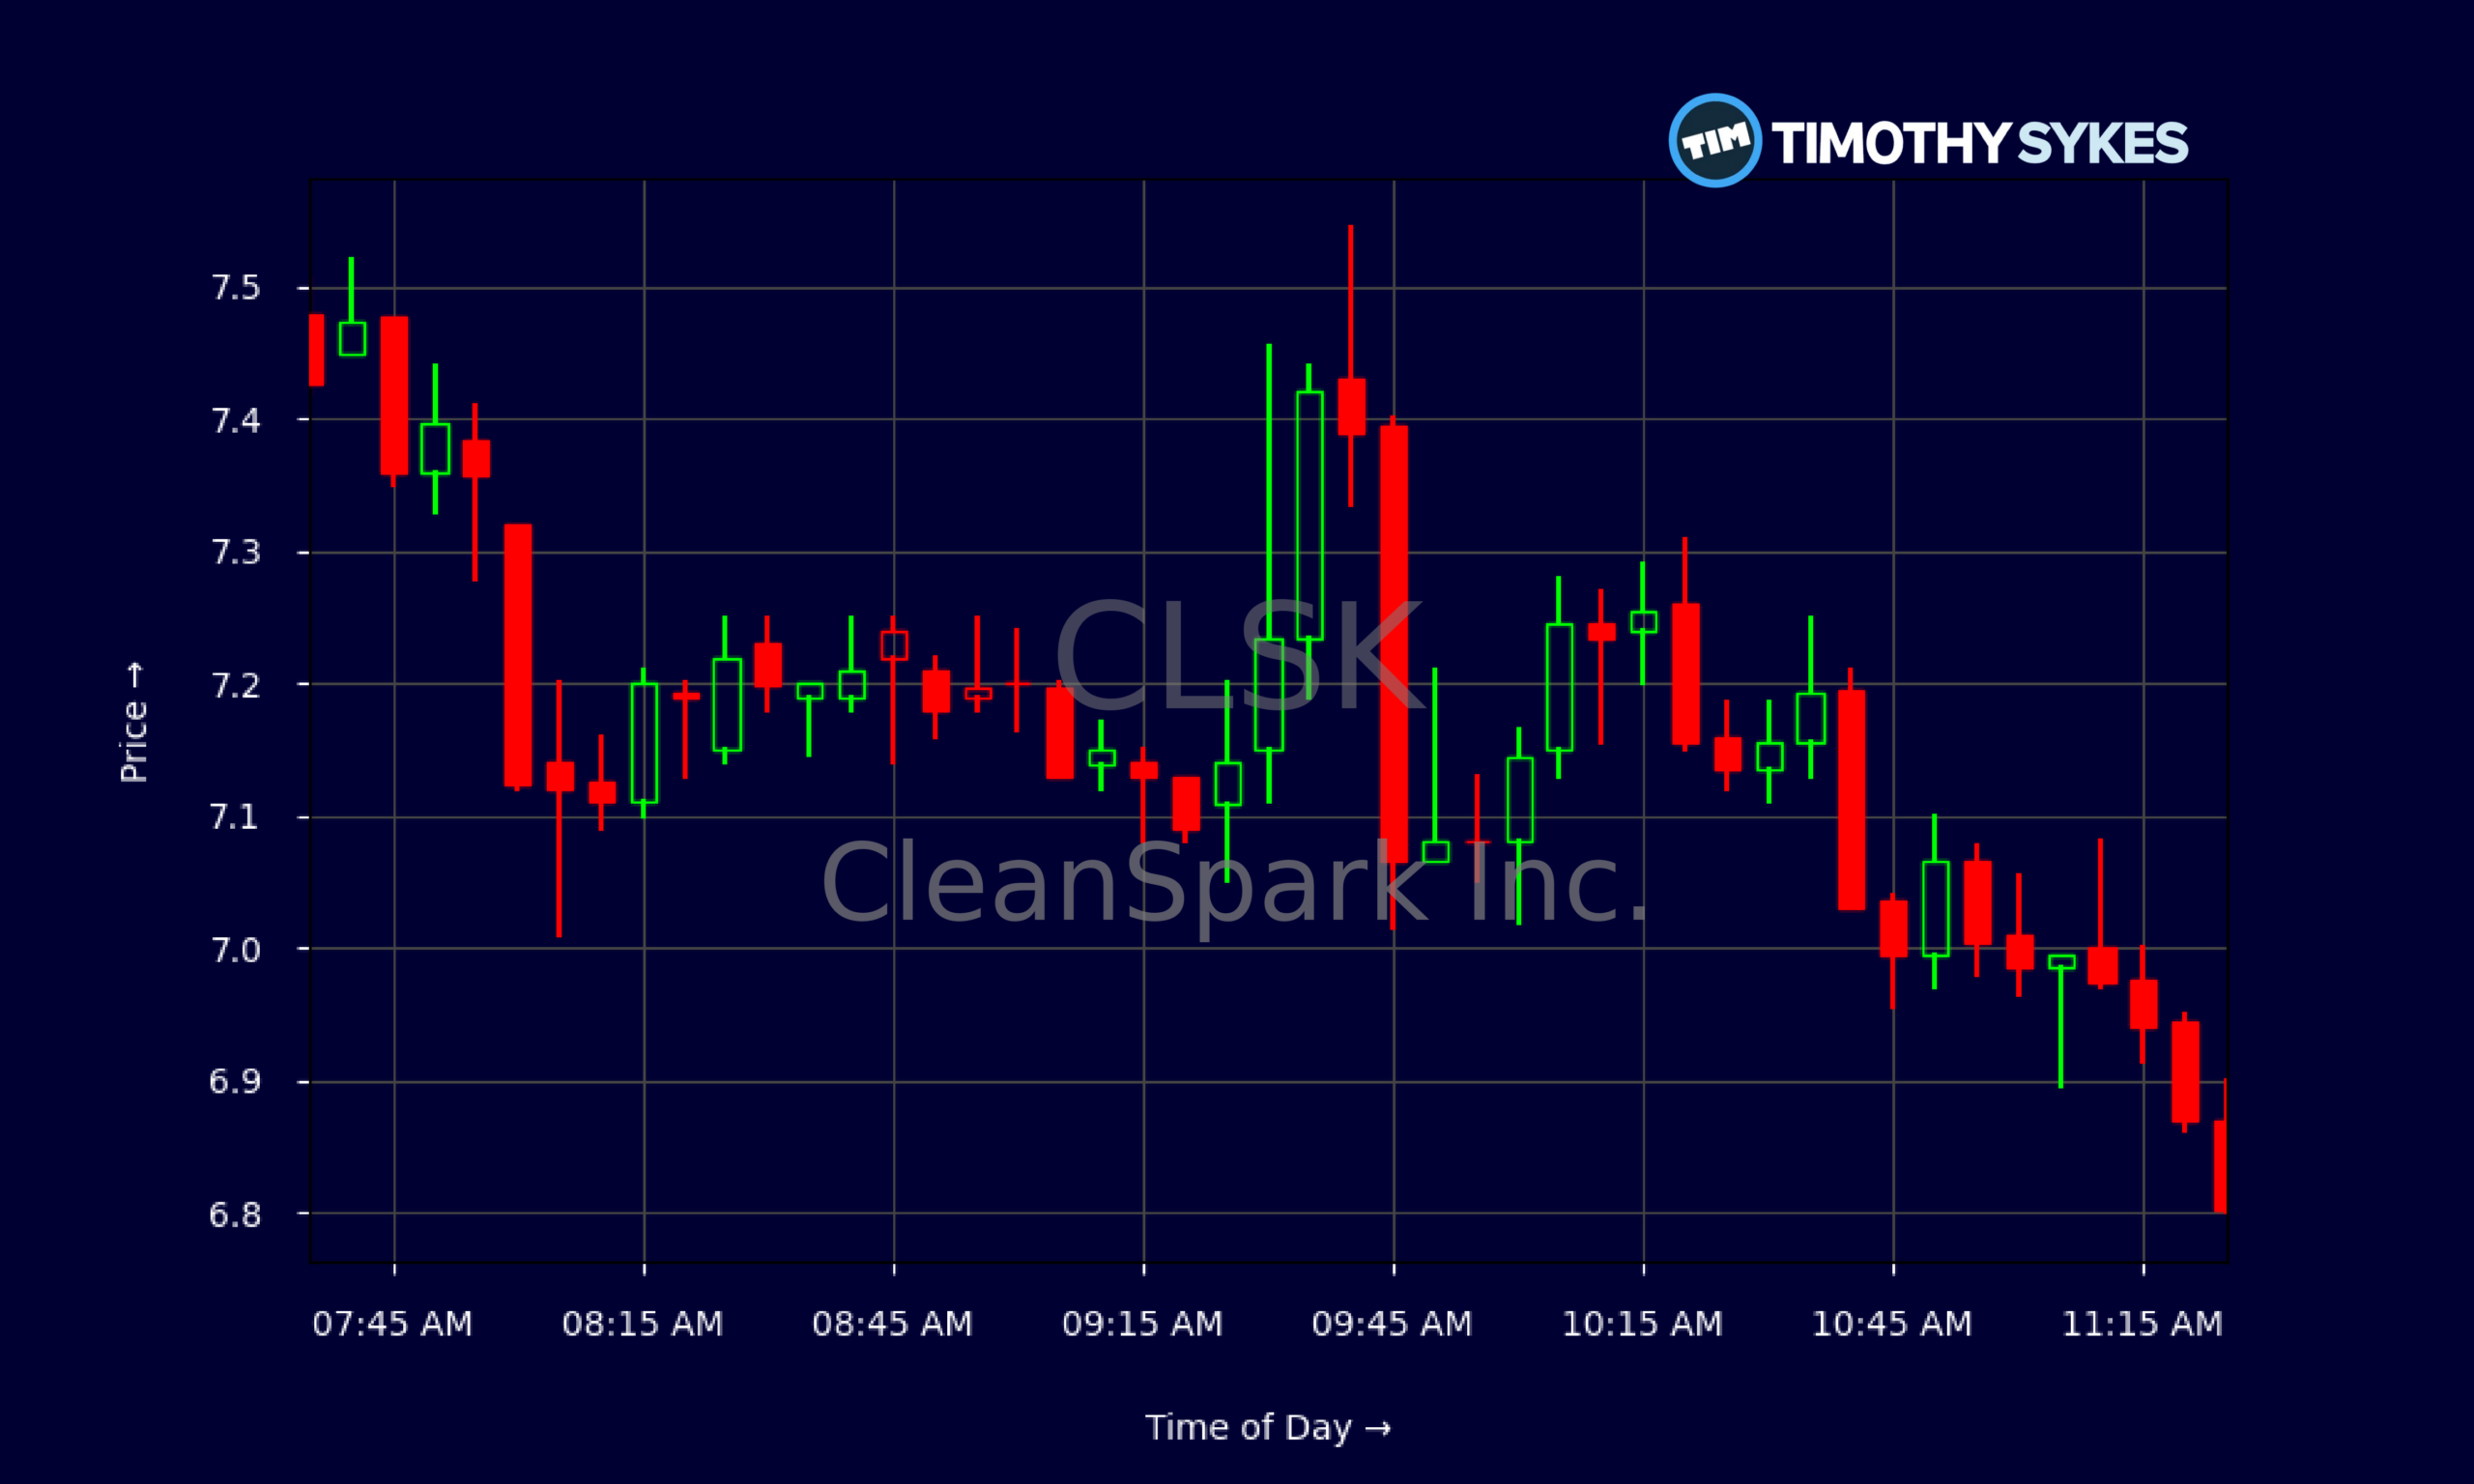
- Intraday trading in CleanSpark Inc. has shifted from tight premarket ranges to heavy selling after the open, signaling short-term momentum weakness.
- Financials show strong revenue growth for CLSK but deep net losses and negative cash flow, keeping it a high-risk, high-volatility name.
- CleanSpark Inc. carries meaningful long-term debt, but a high current ratio gives the company near-term liquidity runway.
- Traders are watching whether CLSK can stabilize above recent lows or if breakdown pressure extends the downtrend.
Live Update At 11:32:12 EST: On Wednesday, November 04, 2026 CleanSpark Inc. stock [NASDAQ: CLSK] is trending down by -15.64%! Discover the key drivers behind this movement as well as our expert analysis in the detailed breakdown below.
Quick Financial Overview
CLSK is a classic high-growth, high-burn story on paper. CleanSpark Inc. booked about $766.3M in revenue, with revenue growing sharply over three and five years, yet the bottom line is still deep in the red. Recent quarterly numbers show total revenue of roughly $138M against total expenses near $249.7M, leading to a net loss of about $239.8M. That’s a big gap, and traders need to respect it.
Margins tell the same story. CleanSpark Inc.’s EBIT margin around -149% and profit margins worse than -140% flag a business still spending heavily to scale. CLSK shows a gross margin of about 28.1%, so the core operations add value, but overhead and other costs crush profitability. Cash flow from operations was roughly -$112.3M in the latest quarter, with free cash flow around -$118.4M. For short sellers and momentum traders, this kind of profile often fuels big moves both ways.
More Breaking News
The balance sheet, however, gives CLSK some cushion. CleanSpark Inc. has about $202.6M in cash and over $794.7M in cash and short-term investments, versus total liabilities near $1.94B and long-term debt around $1.78B. A current ratio of 5.9 and quick ratio of 5.1 mean near-term bills look covered, but leverage keeps the risk premium high.
Why Traders Are Watching CLSK Price Action Now
On the chart, CLSK is telling a very different story than the growth narrative in the financials. CleanSpark Inc. has rolled over from a recent daily high near $10.30 down to a latest close around $6.79. That is a sharp pullback in a short window, and traders who chase strength without a plan often get nailed in this type of slide.
Look at the recent daily candles. CLSK was holding the $10 handle around 2026/10/12–2026/10/13, then started to bleed lower: $9s, then $8s, now high-$6s. Each bounce has been weaker. CleanSpark Inc. closed at $8.58 on 2026/10/28, then $8.20, $7.67, $7.15, and most recently $6.79. That staircase down shows sellers in control and dip buyers getting overrun.
The intraday 5‑minute action confirms the story. Premarket in CLSK was calm in the mid‑$7s to high‑$7s, holding tight ranges. Once regular trading opened, CleanSpark Inc. saw a spike toward $7.54, then a fast fizzle. From there, the price trended down with lower highs and lower lows, eventually settling under $6.80. This is the kind of intraday pattern momentum traders watch for short entries or quick scalp reversals, not “set and forget” long swings.
Despite the ugly margins, revenue growth and sector exposure keep CLSK on radar for speculative traders. CleanSpark Inc. runs with the high‑beta crowd — when risk appetite returns to the market, names like CLSK often move first and hardest. For now, though, the tape says respect the trend down and let the chart prove any reversal.
Conclusion
For active traders, CLSK is a teaching chart right now. CleanSpark Inc. shows strong top‑line growth, big promises, and a large asset base, but the company is burning cash, carrying heavy long‑term debt, and posting steep losses. That fundamental tension produces exactly what short‑term traders crave: volatility and range. The key is treating CLSK as a trading vehicle, not a hope-and-pray hold.
The recent drop from the $10 area to the high‑$6s puts CleanSpark Inc. back into a major decision zone. If CLSK holds above recent lows and builds a base, you might see sharp short-covering pops that reward disciplined longs and quick scalpers. If the stock cracks and volume spikes on the downside, trend traders will keep pressing shorts while others step aside.
Either way, the rules stay the same. CleanSpark Inc. is a liquid, emotional name where both greed and fear show up fast on the tape. As millionaire penny stock trader and teacher Tim Sykes, says, “Consistency is key in trading; don’t let emotions dictate your trades.” As Tim Sykes likes to remind traders, “Cut losses quickly, because big losses start out as small ones.” With CLSK sitting in a downtrend and the fundamentals still risky, that mindset matters more than ever. This analysis is for educational and research purposes only, and every trader needs to do their own homework before taking any position in CLSK.
This is stock news, not investment advice. Timothy Sykes News delivers real-time stock market news focused on key catalysts driving short-term price movements. Our content is tailored for active traders and investors seeking to capitalize on rapid price fluctuations, particularly in volatile sectors like penny stocks. Readers come to us for detailed coverage on earnings reports, mergers, FDA approvals, new contracts, and unusual trading volumes that can trigger significant short-term price action. Some users utilize our news to explain sudden stock movements, while others rely on it for diligent research into potential investment opportunities.
Dive deeper into the world of trading with Timothy Sykes, renowned for his expertise in penny stocks. Explore his top picks and discover the strategies that have propelled him to success with these articles:
- Penny Stocks Trading Guide
- Best Penny Stocks Under $1 to Buy Today
- Top 8 Penny Stocks to Watch on Robinhood
Once you’ve got some stocks on watch, elevate your trading game with StocksToTrade the ultimate platform for traders. With specialized tools for swing and day trading, StocksToTrade will guide you through the market’s twists and turns.
Dig into StocksToTrade’s watchlists here:





Leave a reply