

Arq Inc. surged on news of a transformative clean-energy licensing deal, with stocks have been trading up by 24.32 percent.
Key Takeaways
- Q3 results from ARQ beat Wall Street, with $0.06 EPS versus $0.04 expected and revenue of $38.21M versus $35.05M.
- Record quarterly revenue, positive net income, and a tenth straight quarter of positive adjusted EBITDA underscore ARQ’s execution.
- Full-year 2026 revenue guidance of $120M–$125M was reaffirmed, while adjusted EBITDA guidance tightened higher to $19M–$20M.
- Management highlighted growing PAC earnings and said the Red River asset base looks undervalued versus replacement cost.
- ARQ had previously teed up its Q3 2026 earnings call, with a full presentation and replay for traders doing deeper homework.
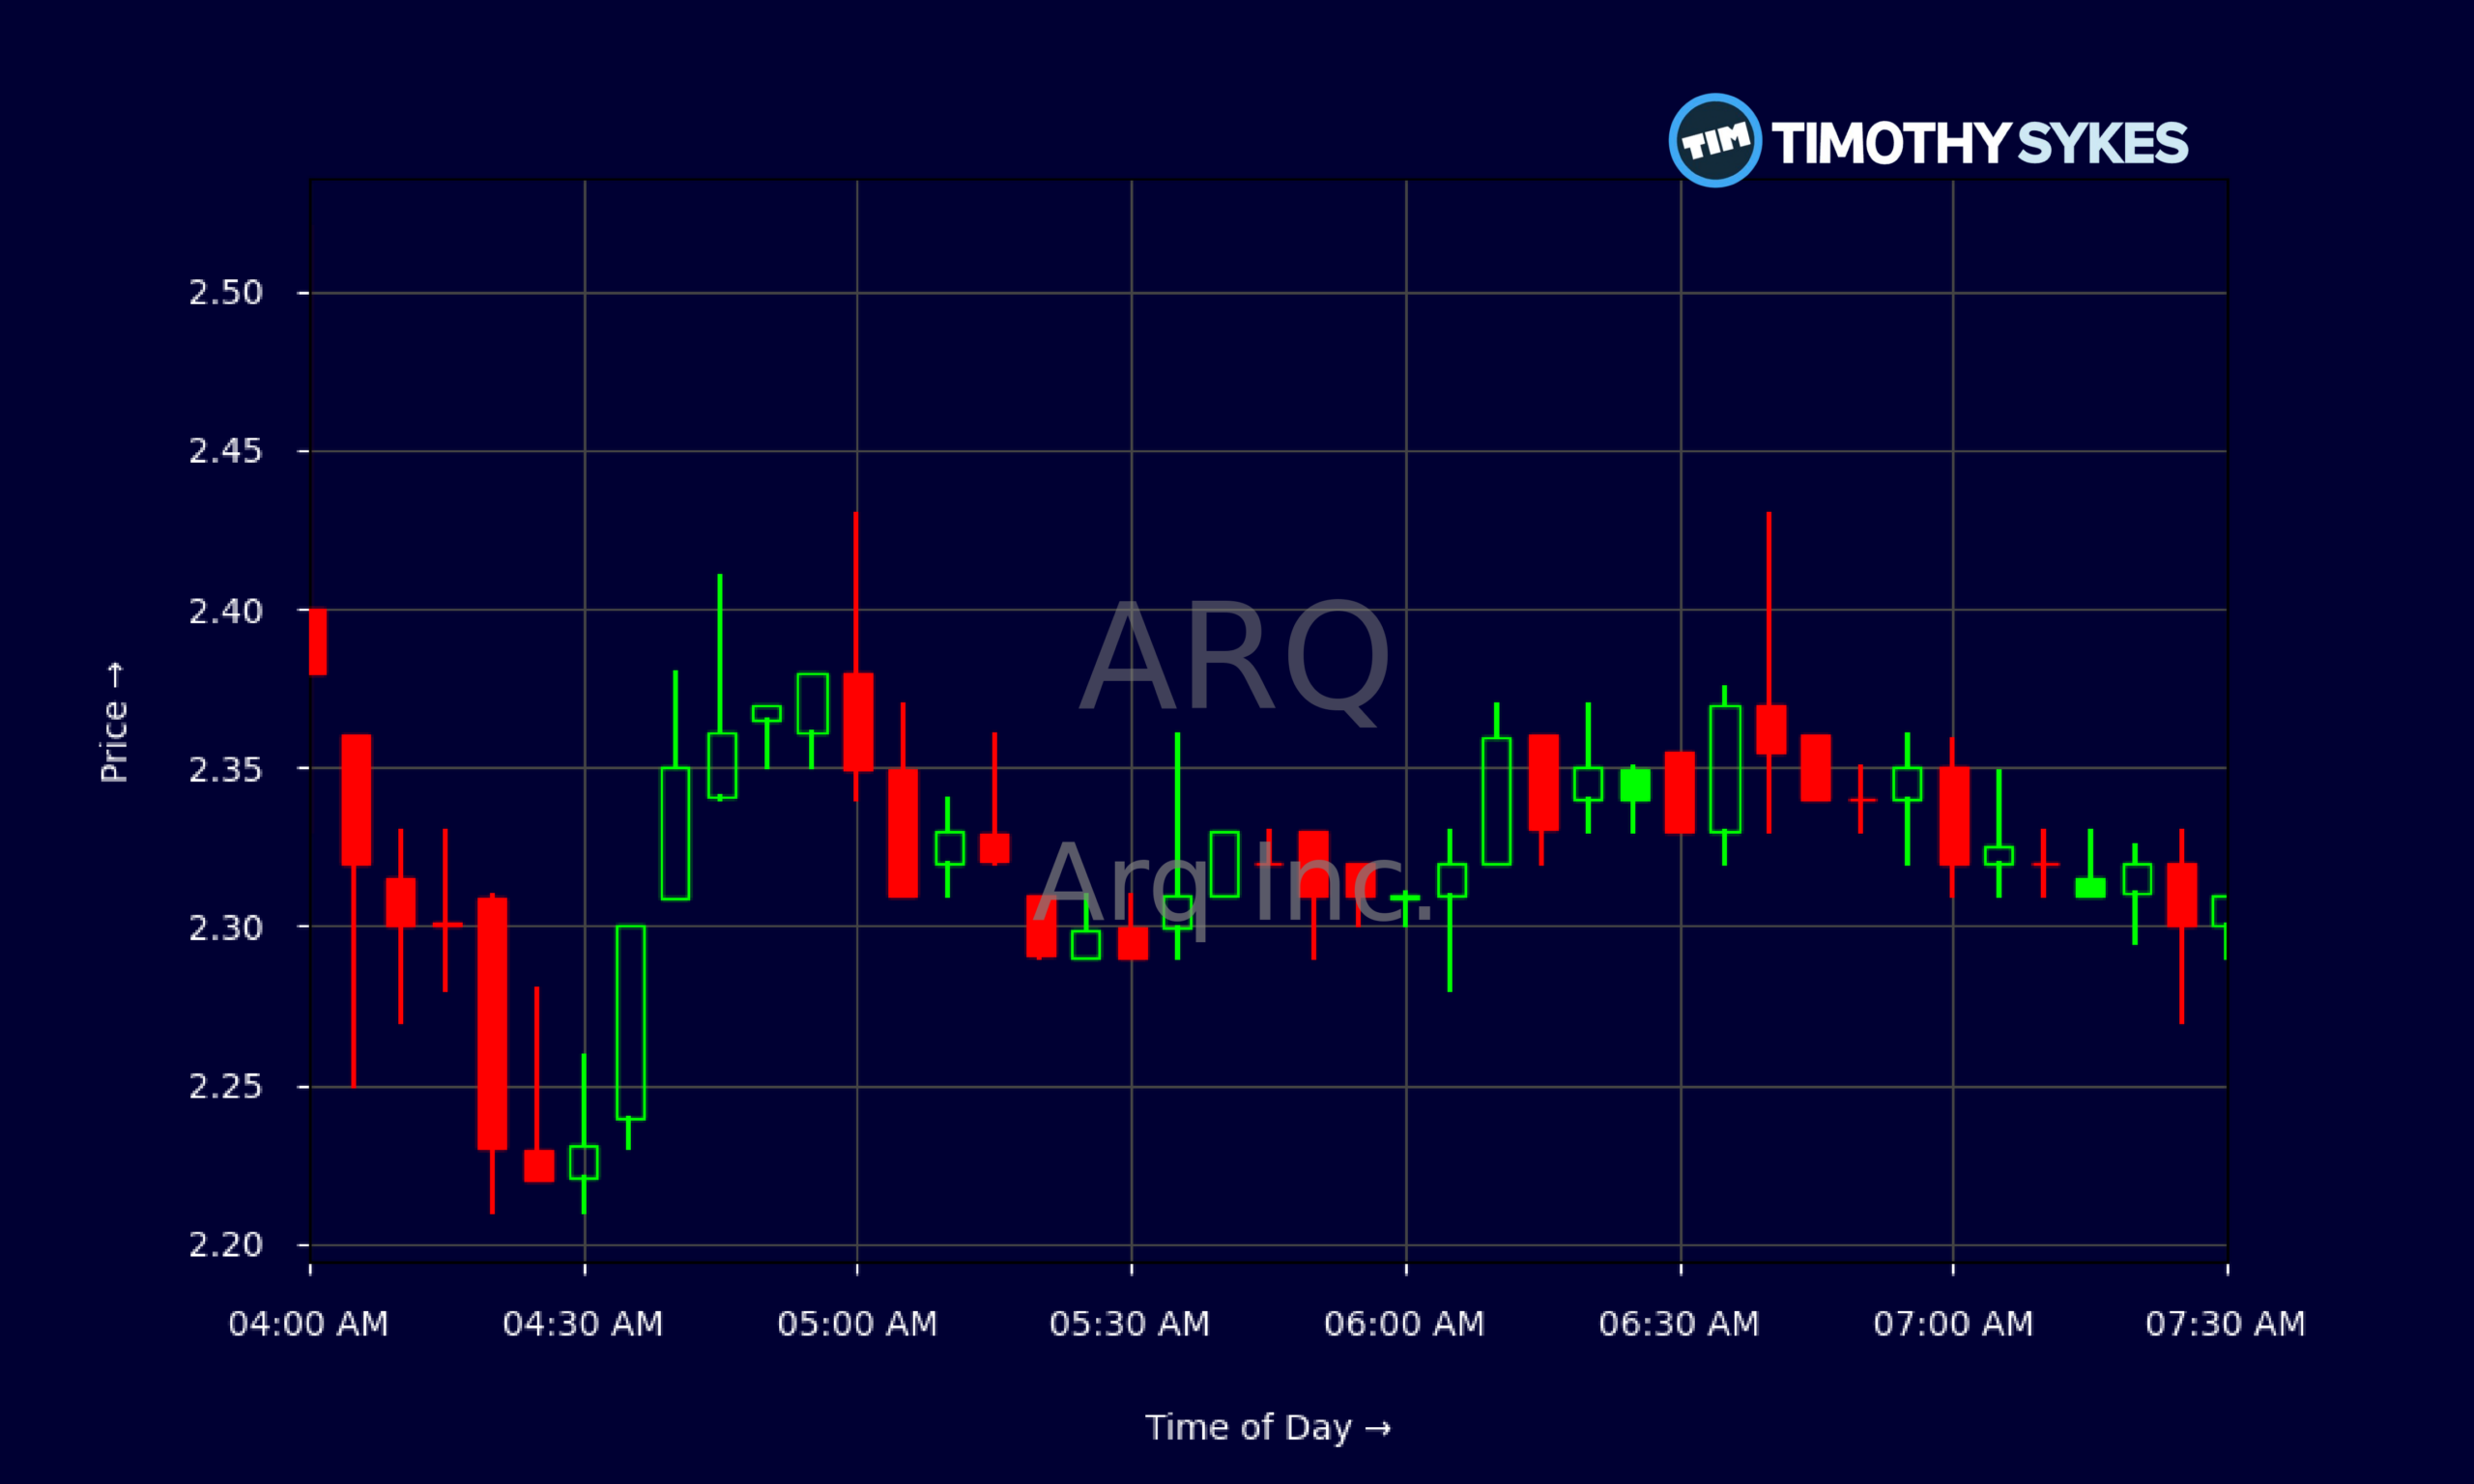
Live Update At 07:32:52 EST: On Thursday, November 05, 2026 Arq Inc. stock [NASDAQ: ARQ] is trending up by 24.32%! Discover the key drivers behind this movement as well as our expert analysis in the detailed breakdown below.
Quick Financial Overview
ARQ just backed up its chart with hard numbers. The company delivered Q3 revenue of $38.21M, above the $35.05M consensus, and turned that into net income of about $2.50M, or $0.06 per share. That is not just a beat; it is record quarterly revenue with clear operating leverage starting to show.
On the margin side, ARQ posted gross profit of $15.17M on $38.21M of sales, roughly a 40% gross margin, while EBITDA landed at $8.21M. Adjusted EBITDA has now been positive for ten straight quarters, a key trend for traders who care about consistency more than headlines. Operating cash flow of $10.34M and free cash flow of $9.56M in the quarter signal that ARQ is not just posting accounting profits; cash is actually coming in the door.
More Breaking News
On the balance sheet, ARQ looks relatively conservative. Total debt is modest versus $171.90M of equity, and current assets slightly top current liabilities, giving a current ratio around 1. With the stock trading below book value — price-to-book near 0.5 and price-to-sales around 0.7 — the market is still pricing ARQ like a troubled story even as the operations turn the corner.
Why Traders Are Watching ARQ After This Earnings Beat
Traders love when the tape and the fundamentals finally line up, and that is what is starting to happen with ARQ. Daily chart data show ARQ trading in a tight band between roughly $1.70 and $1.97 over the past few weeks, with recent closes clustering around $1.80–$1.90. That is classic coil behavior: price goes sideways while a real story builds underneath.
Then ARQ dropped its Q3 2026 numbers. Earnings of $0.06 versus $0.04 expected and revenue of $38.21M versus $35.05M gave the bulls concrete ammo. It was not just a single-quarter surprise either. ARQ delivered its tenth straight quarter of positive adjusted EBITDA, plus positive net income, which is exactly the kind of multi-quarter trend traders in small caps search for.
Intraday, ARQ’s 5‑minute chart shows premarket action ramping from the low $2.20s into the $2.30–$2.40 range, with several pushes toward $2.43. That pattern — morning spike, consolidation between $2.30 and $2.35, and repeated tests near the top of the range — tells short-term traders that real buying interest stepped in after the earnings headlines.
Guidance added fuel. ARQ reaffirmed full‑year 2026 revenue in the $120M–$125M band, matching Street expectations, but nudged the quality of earnings higher by tightening adjusted EBITDA guidance upward to $19M–$20M. Capex stays steady at $8M–$10M, which means ARQ plans to grow PAC earnings and unlock more from its Red River asset base without a big cash burn spike. When a stock trades below book value and management is openly calling Red River undervalued versus replacement cost, momentum traders start watching for rerating setups and squeeze potential.
Conclusion
For traders, ARQ now sits at an interesting crossroads. The company is printing record revenue, real net income, and double‑digit millions in quarterly operating cash flow, yet the stock still trades at a discount to both sales and book value. That disconnect is the kind of inefficiency active traders try to exploit — but only with a clear plan and tight risk management.
ARQ’s tightened adjusted EBITDA outlook to $19M–$20M, backed by ten consecutive positive adjusted EBITDA quarters, tells the market this is no longer a pure story stock. At the same time, profitability ratios over the longer term remain negative, and margins have work left to do. The chart confirms the battle: a coiling daily range around $1.80–$1.90, and a post‑earnings intraday move into the low‑$2s, signal a potential trend change but not a done deal.
This is where discipline matters. As Tim Sykes likes to say, “Patterns repeat, but only prepared traders profit from them.” As millionaire penny stock trader and teacher Tim Sykes, says, “Consistency is key in trading; don’t let emotions dictate your trades.”. ARQ offers a textbook case for that mindset — a small‑cap name with improving fundamentals, guidance moving the right way, and a chart waking up. Use it as a study tool: map the earnings beat, watch how ARQ trades around support and resistance, and build the habit of cutting losses fast while letting the best setups prove themselves. This analysis is for educational and research purposes only, not trading advice.
This is stock news, not investment advice. Timothy Sykes News delivers real-time stock market news focused on key catalysts driving short-term price movements. Our content is tailored for active traders and investors seeking to capitalize on rapid price fluctuations, particularly in volatile sectors like penny stocks. Readers come to us for detailed coverage on earnings reports, mergers, FDA approvals, new contracts, and unusual trading volumes that can trigger significant short-term price action. Some users utilize our news to explain sudden stock movements, while others rely on it for diligent research into potential investment opportunities.
Dive deeper into the world of trading with Timothy Sykes, renowned for his expertise in penny stocks. Explore his top picks and discover the strategies that have propelled him to success with these articles:
- Penny Stocks Trading Guide
- Best Penny Stocks Under $1 to Buy Today
- Top 8 Penny Stocks to Watch on Robinhood
Once you’ve got some stocks on watch, elevate your trading game with StocksToTrade the ultimate platform for traders. With specialized tools for swing and day trading, StocksToTrade will guide you through the market’s twists and turns.
Dig into StocksToTrade’s watchlists here:





Leave a reply