

American Airlines Group Inc. stocks have been trading down by -3.87 percent following reports of weakening travel demand and rising costs.
Key Takeaways
- Q3 brought a wider adjusted loss for American Airlines but a beat on both revenue and earnings expectations, yet AAL still dropped about 4% premarket on fresh guidance.
- Management guided Q4 adjusted EPS to a loss of $1.10–$0.50, far worse than the prior consensus loss of $0.41, even with revenue projected to climb nearly 20%–22.5%.
- Full-year 2026 adjusted EPS guidance was slashed to a loss of ($1.60)–($1.00), versus a prior range of (0.65)–$0.65, as fuel costs spike.
- AAL now expects 2026 fuel expense to run more than $7B above 2025, with roughly $2.8B of that hit landing in Q4 alone, while flagging industry-wide margin pressure.
- Growth in 2027 is expected to “decelerate considerably,” signaling a slower American Airlines expansion story beyond the current planning window.
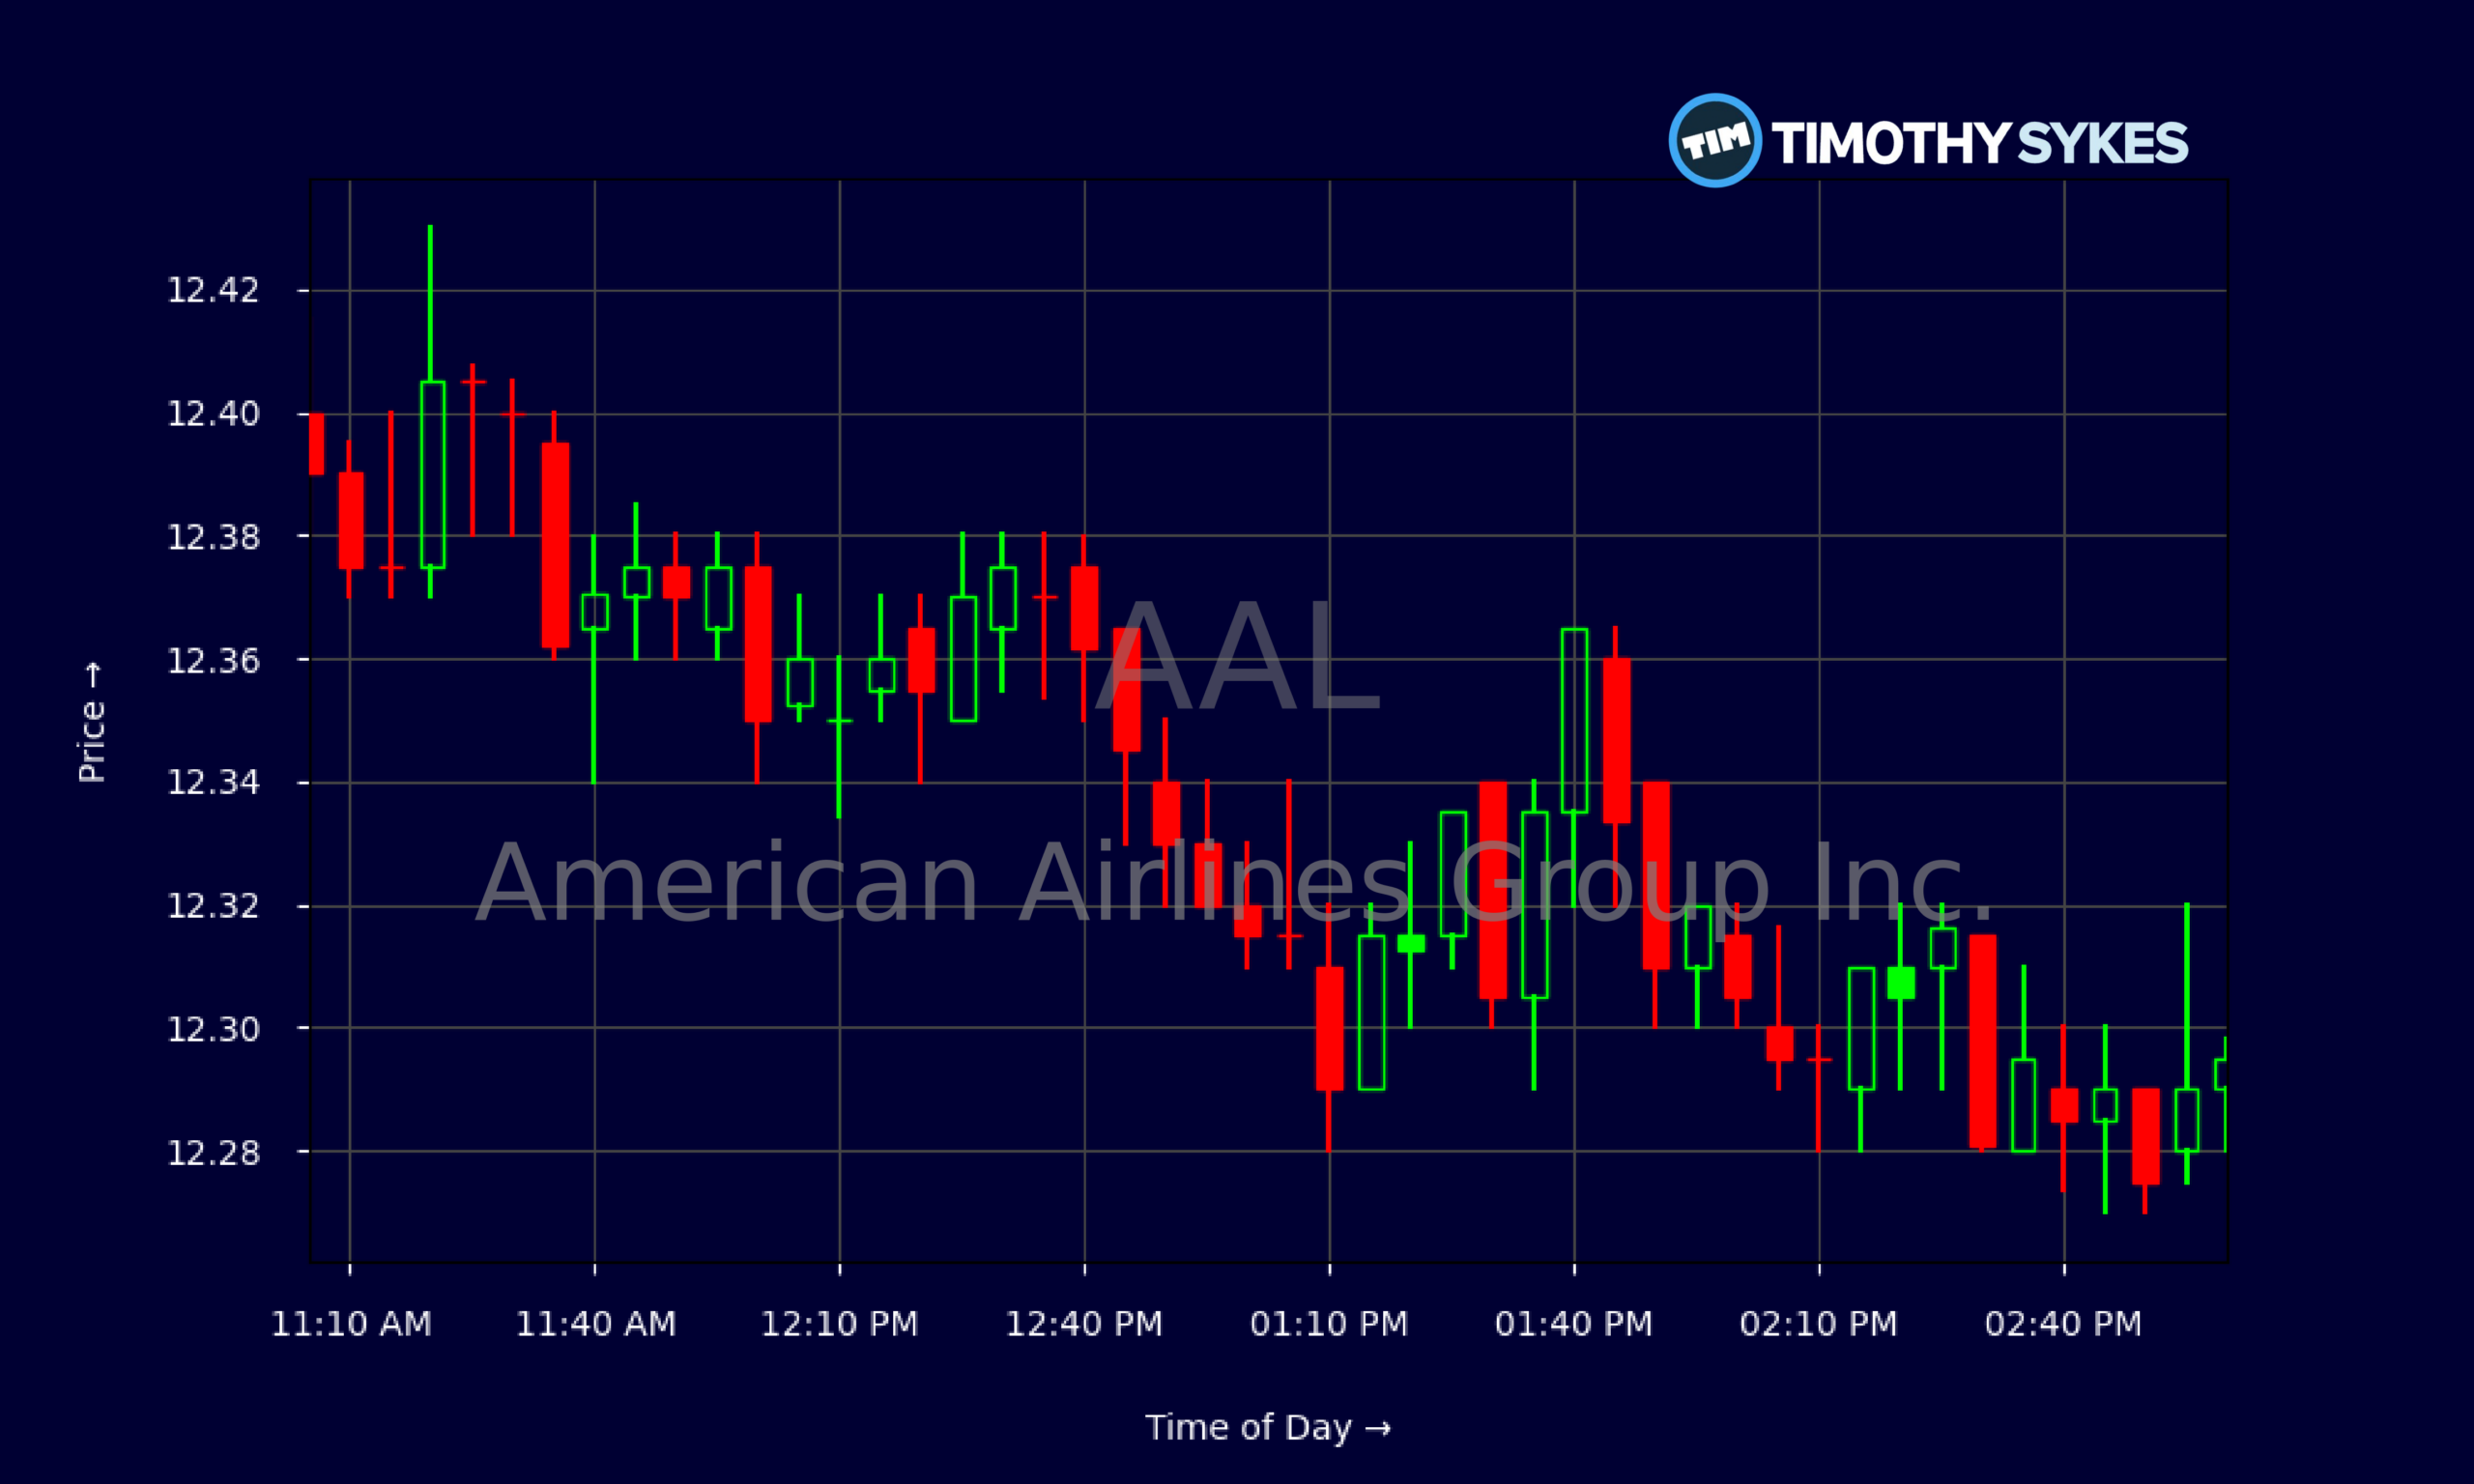
Live Update At 15:03:39 EDT: On Friday, October 30, 2026 American Airlines Group Inc. stock [NASDAQ: AAL] is trending down by -3.87%! Discover the key drivers behind this movement as well as our expert analysis in the detailed breakdown below.
Quick Financial Overview
AAL’s recent tape tells a story of churn, not breakout. Over the last few weeks, American Airlines has chopped in a tight band from roughly $11.70 to $13.00, with the latest close around $12.30. That’s a classic indecision zone. Bulls can’t push through prior highs, but bears also struggle to crack recent lows.
Intraday, AAL traded in a narrow $12.27–$12.32 range for much of the afternoon, showing fading volatility after the initial news shock. For short-term traders, that often signals the market is digesting fresh guidance and waiting on the next catalyst, not yet ready to pick a strong direction.
Under the hood, the numbers justify the caution. American Airlines generated about $54.63B in annual revenue with an EBIT margin near 2.2% and overall profit margins still negative. The balance sheet is heavy: roughly $31.55B in long-term debt, negative book value, and a current ratio around 0.5, which tells traders liquidity is tight and leverage is real.
More Breaking News
AAL’s latest quarter showed $16.34B in revenue but a net loss of $269M and negative free cash flow near $1.25B. That combination of thin margins, big capex, and high interest expense means any shock — like fuel — hits hard.
Why Traders Are Watching AAL Now
Traders aren’t glued to AAL because everything looks rosy. They’re watching because American Airlines just reset expectations in a big way, and those reset moments often create the cleanest trading edges.
Start with Q3. American Airlines posted a wider adjusted loss year over year, but still beat Wall Street on both loss per share and revenue. On paper, that’s a “beat.” In reality, the stock dropped roughly 4% premarket after the company slashed its outlook. That tells you where the market’s focus is: not on yesterday’s quarter, but on tomorrow’s earnings power.
The forward view from AAL is where the real story lives. Management guided Q4 adjusted EPS to a loss of $1.10–$0.50, versus a consensus loss of $0.41. At the same time, they’re calling for revenue growth of about 19.5%–22.5% with only modest capacity and cost growth. So demand is fine. The problem is cost per seat, especially fuel.
American Airlines expects its 2026 fuel bill to run more than $7B above 2025, with about $2.8B of that extra hit concentrated in Q4 alone. That’s massive for any airline, and it explains why AAL now sees a 2026 adjusted loss of ($1.60)–($1.00) per share instead of the prior (0.65)–$0.65 range. Wall Street had been modeling roughly a $1.03 loss; that gap usually forces estimate cuts and keeps a lid on rallies.
UBS widened its projected Q4 loss for AAL and trimmed its price target, even while sticking with a Buy rating. They also pointed out that Delta’s strong guidance raises the bar, making American Airlines’ earnings profile look more vulnerable. Add in management’s warning that 2027 growth will “decelerate considerably,” and longer-term multiple expansion looks tougher.
For active traders, that mix — weak guidance, sector headwinds, and peer outperformance — tends to support a trade-the-swings mindset in AAL rather than a straight-line bullish thesis.
Conclusion
For American Airlines, the message to traders is simple: this is now a cost story, not a demand story. AAL is still growing revenue, but higher fuel and a leveraged balance sheet are boxing in profitability. When a company calls out that “profitability is under pressure for all carriers” and simultaneously hikes its 2026 fuel expense forecast by more than $7B versus 2025, the market listens.
The guidance reset — Q4 losses of $1.10–$0.50 per share, a 2026 adjusted loss of ($1.60)–($1.00), and slower growth into 2027 — explains why American Airlines sold off despite beating Q3 expectations. It also explains why traders should watch reactions to every macro headline on energy and every cost-control signal from AAL management. In a name with negative free cash flow, thin margins, and heavy debt, small macro shifts can move the chart fast.
For short-term setups, that makes AAL a “reaction stock.” Earnings calls, fuel headlines, and analyst revisions can all drive sharp spikes or flushes. As Tim Sykes likes to say, “The market doesn’t care about your opinion, only about price action — respect the trend, cut losses quickly, and never fall in love with a story.” In a fast-moving name like AAL, that also means waiting for clean technical patterns and clear catalysts instead of chasing noise; as millionaire penny stock trader and teacher Tim Sykes, says, “Be patient, don’t force trades, and let the perfect setups come to you.”. For American Airlines, the story is tough. The price action is what matters.
This is stock news, not investment advice. Timothy Sykes News delivers real-time stock market news focused on key catalysts driving short-term price movements. Our content is tailored for active traders and investors seeking to capitalize on rapid price fluctuations, particularly in volatile sectors like penny stocks. Readers come to us for detailed coverage on earnings reports, mergers, FDA approvals, new contracts, and unusual trading volumes that can trigger significant short-term price action. Some users utilize our news to explain sudden stock movements, while others rely on it for diligent research into potential investment opportunities.
Dive deeper into the world of trading with Timothy Sykes, renowned for his expertise in penny stocks. Explore his top picks and discover the strategies that have propelled him to success with these articles:
- Penny Stocks Trading Guide
- Best Penny Stocks Under $1 to Buy Today
- Top 8 Penny Stocks to Watch on Robinhood
Once you’ve got some stocks on watch, elevate your trading game with StocksToTrade the ultimate platform for traders. With specialized tools for swing and day trading, StocksToTrade will guide you through the market’s twists and turns.
Dig into StocksToTrade’s watchlists here:





Leave a reply