

TAL Education Group stocks have been trading down by -9.02 percent amid heightened regulatory concerns weighing on investor sentiment.
Key Takeaways
- Shares of TAL Education Group have dropped from the $12–$13 area to near $10.50, signaling a short-term breakdown in momentum.
- Intraday trading shows TAL narrowing its range around $10.50, a classic consolidation after heavy morning selling.
- TAL sits on over $3.2B in cash and short-term investments, with total liabilities around $2.2B, giving the company solid financial runway.
- Valuation around 2.4x sales and a P/E near 14 keeps TAL in a mid-range pricing zone for growth-at-a-loss education names.
- Traders are tracking whether TAL can build a base above $10 or accelerate lower toward prior support.
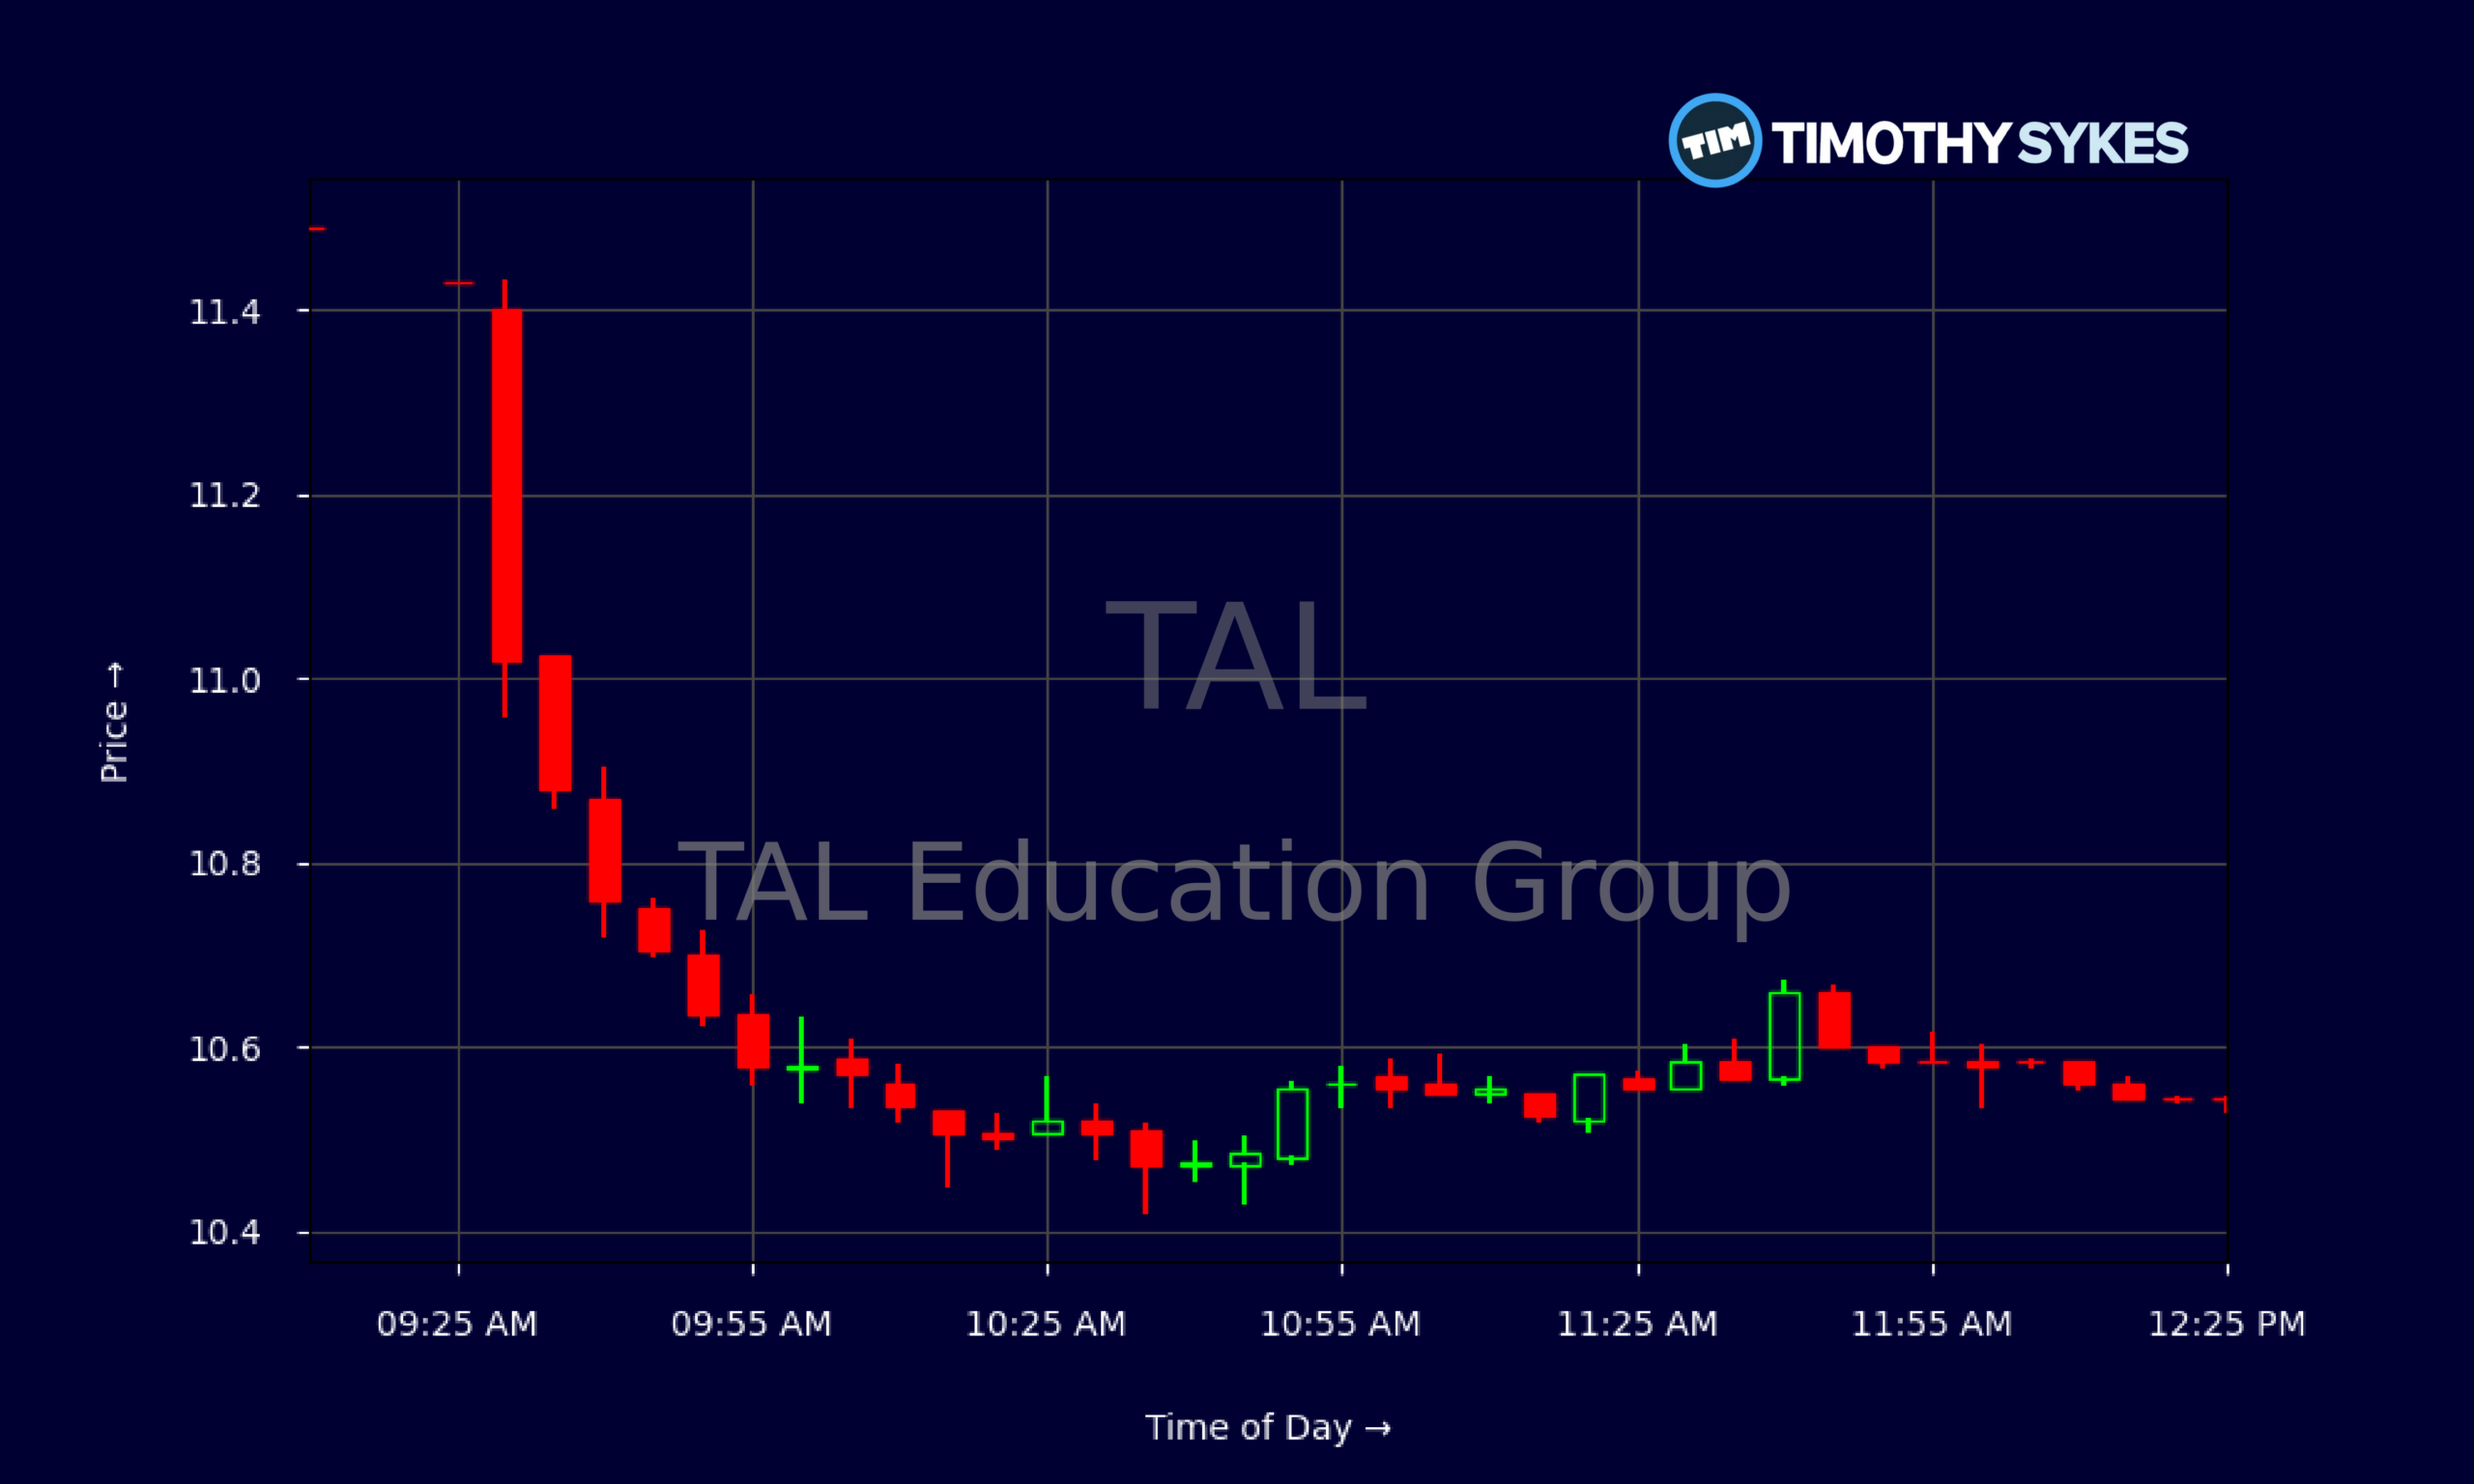
Live Update At 12:32:30 EDT: On Wednesday, October 21, 2026 TAL Education Group stock [NYSE: TAL] is trending down by -9.02%! Discover the key drivers behind this movement as well as our expert analysis in the detailed breakdown below.
Quick Financial Overview
TAL Education Group sits in an unusual spot right now. The stock is selling off, but the balance sheet looks strong. TAL holds about $3.24B in cash and short-term investments against roughly $2.16B in total liabilities, plus working capital of about $2.08B. That kind of cushion matters when a company is still cleaning up its earnings profile.
On the income side, TAL is posting revenue of about $3.01B, yet the pretax profit margin is roughly -10%. So TAL is still losing money on operations even with solid top-line scale. Return on assets sits near -4.4% and return on equity is about -6.0%, confirming that the business, as reported, is not yet delivering profitable growth.
More Breaking News
At the same time, TAL’s P/E near 13.98 and price-to-sales around 2.37 tell traders the market is pricing in some recovery, but not paying premium growth multiples. Book value per share is about 6.8, with the stock trading above that level, suggesting TAL is viewed as more than just a sum of assets. For active traders, this mix of weak margins but strong liquidity sets up a “show me” phase on the chart.
Why Traders Are Watching TAL Price Action
From a trading perspective, TAL Education Group is all about the recent shift in momentum. Over the past few weeks, TAL traded comfortably in the $12–$13 zone, grinding higher and holding most dips. That structure has cracked. The latest daily bar shows TAL opening at $11.40, spiking briefly to $11.43, then getting sold hard down to $10.42 before closing near $10.53. That’s a sharp, wide-range red candle — a warning shot for anyone who chases strength late.
Look inside the intraday action and the story becomes clearer. At the open, TAL printed $11.40, but selling pressure hit almost immediately, driving the stock into the low $11s and then the high $10s within the first hour. After the flush toward $10.42, TAL stabilized, chopping between roughly $10.50 and $10.60 for most of midday trading. That kind of narrowing range after a fast drop often signals consolidation, not yet a confirmed bounce.
Active traders in names like TAL focus on this behavior. The first question is whether that $10.40–$10.50 zone becomes a near-term floor or just a pause before another leg down. With TAL’s prior support and congestion clustered in the $11–$12 area, the stock is now clearly below recent comfort zones. Any push back toward $11 faces overhead supply from trapped longs.
At the same time, TAL’s solid cash stack and moderate valuation mean longer-term dip buyers may start stalking entries if downside accelerates. For momentum-focused day traders, TAL remains on watch for clean moves around the $10 handle, especially if volume spikes and range expands again.
Conclusion
TAL Education Group is giving traders a classic technical setup: solid liquidity on the balance sheet, negative but improving profitability metrics, and a chart that just lost its recent uptrend. TAL has slipped from the $12–$13 area to near $10.50, and the intraday tape shows aggressive morning selling followed by tight consolidation. That pattern tells traders to respect the downside while also watching for a potential snapback if sellers tire out.
Financially, TAL carries more than $3.2B in cash and short-term investments, with total assets of about $5.94B and equity around $3.77B. The leverage ratio sits near 1.6, and long-term debt plus capital lease obligations are manageable at roughly $278M. Those numbers give TAL flexibility to keep rebuilding its business even while margins remain under pressure.
For the trading community that follows TAL Education Group, the key is discipline. The stock is hovering near short-term support with clear resistance overhead, so chasing either direction without a plan is dangerous. As Tim Sykes likes to remind traders, “Cut losses quickly, because the market won’t wait for you to feel comfortable.” As millionaire penny stock trader and teacher Tim Sykes says, “Consistency is key in trading; don’t let emotions dictate your trades.”. With TAL, that means defining risk around the $10 zone, respecting the recent breakdown, and letting the chart confirm the next real trend before sizing up.
This is stock news, not investment advice. Timothy Sykes News delivers real-time stock market news focused on key catalysts driving short-term price movements. Our content is tailored for active traders and investors seeking to capitalize on rapid price fluctuations, particularly in volatile sectors like penny stocks. Readers come to us for detailed coverage on earnings reports, mergers, FDA approvals, new contracts, and unusual trading volumes that can trigger significant short-term price action. Some users utilize our news to explain sudden stock movements, while others rely on it for diligent research into potential investment opportunities.
Dive deeper into the world of trading with Timothy Sykes, renowned for his expertise in penny stocks. Explore his top picks and discover the strategies that have propelled him to success with these articles:
- Penny Stocks Trading Guide
- Best Penny Stocks Under $1 to Buy Today
- Top 8 Penny Stocks to Watch on Robinhood
Once you’ve got some stocks on watch, elevate your trading game with StocksToTrade the ultimate platform for traders. With specialized tools for swing and day trading, StocksToTrade will guide you through the market’s twists and turns.
Dig into StocksToTrade’s watchlists here:





Leave a reply