

General Motors Company stocks have been trading down by -6.37 percent amid heightened concerns over slowing EV demand and profitability.
Key Takeaways
- U.S. Q3 vehicle sales at General Motors dropped about 5.5%–6% year over year to 670,974 units, yet GM stock still climbed roughly 1.5%–2.5% afterward.
- Cox Automotive projects GM’s U.S. new-vehicle sales down 5.2% in Q3, pushing Detroit automakers toward record-low market share while the broader U.S. auto market grows.
- Planned Chevrolet Bolt EV production is slashed about 75% to roughly 35,000 units before ending output in Q1 2027, reflecting weaker demand after subsidy losses.
- GM’s U.S. EV sales tumbled about 62% in Q3 as models including the Chevrolet Equinox EV cooled following last year’s incentive-driven demand pull-forward.
- GM’s CFO flagged intensifying competition from Toyota, Stellantis, BYD, and Chery, with GM shares sliding 1.6% on those warnings about U.S. market pressures.
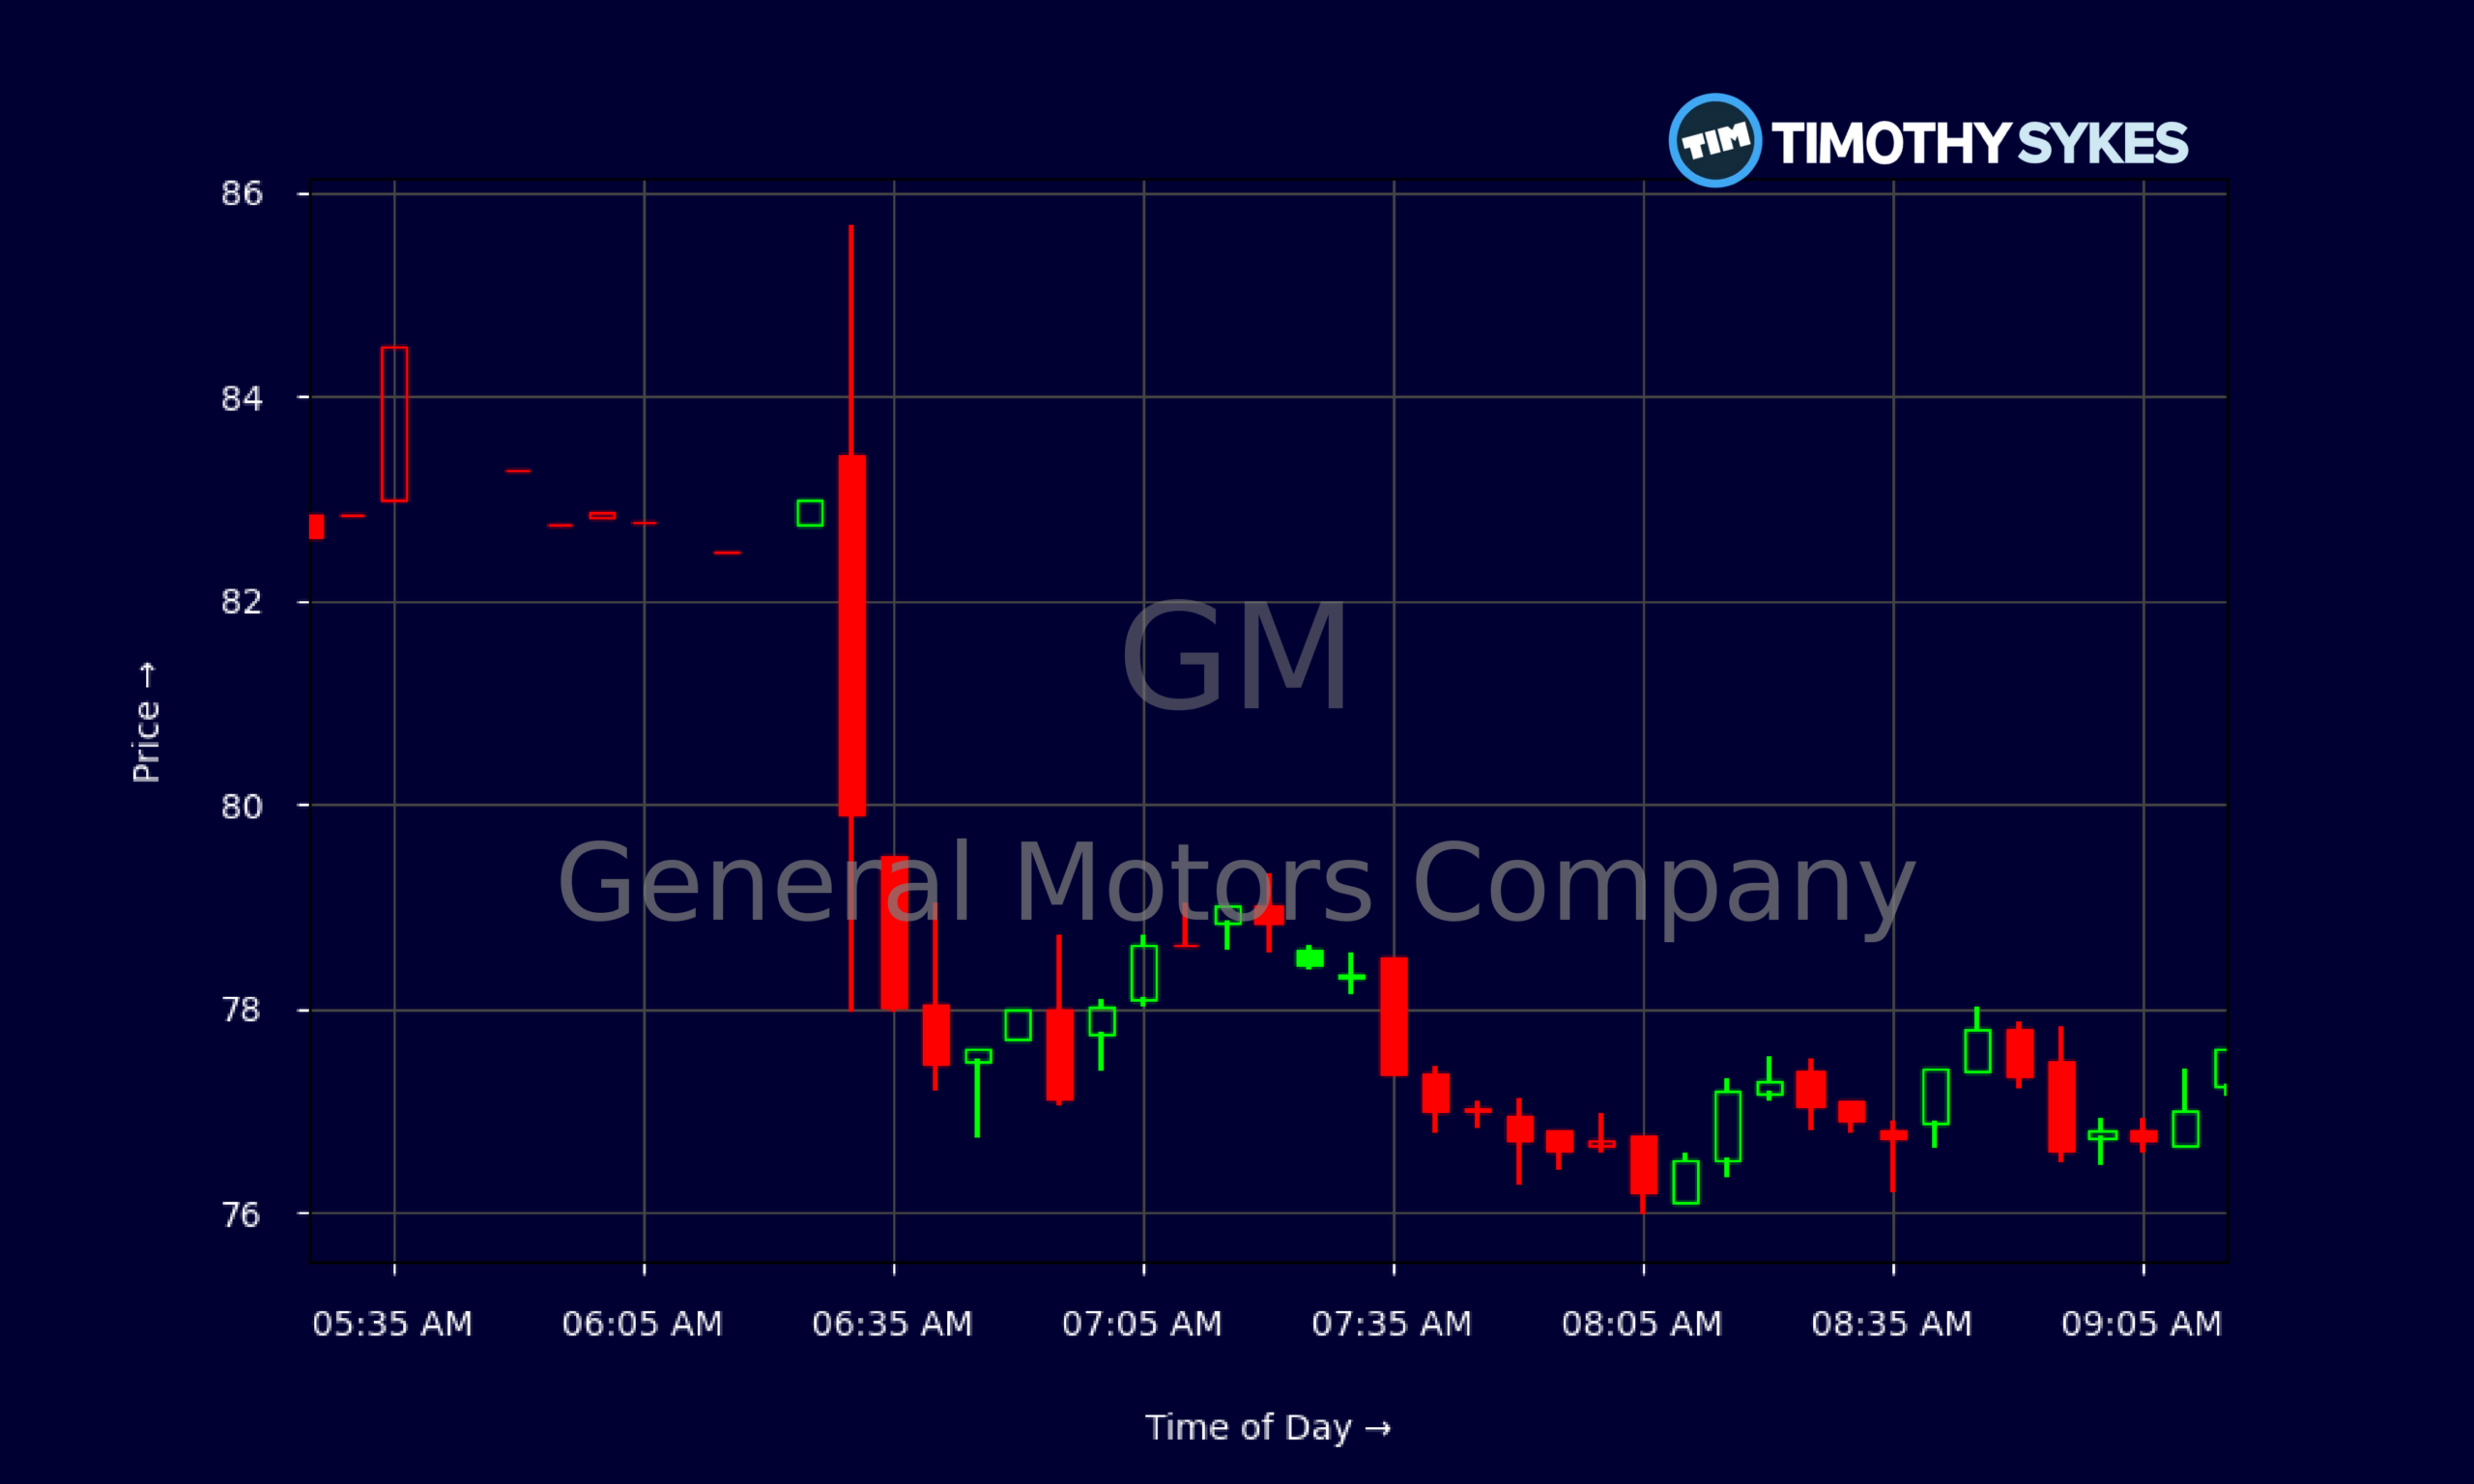
Live Update At 09:19:09 EDT: On Tuesday, October 20, 2026 General Motors Company stock [NYSE: GM] is trending down by -6.37%! Discover the key drivers behind this movement as well as our expert analysis in the detailed breakdown below.
Quick Financial Overview
GM looks like a classic “good chart, messy story” setup right now. The stock has marched from a late-September close around $77 to roughly $83–$84 by 2026/10/19, a solid mid-single-digit climb in just a few weeks. Daily candles show steady higher lows from about $78 on 2026/10/02 up toward the low $80s, with only brief shakeouts. Intraday, the 5‑minute tape shows GM absorbing volatility between $76 and $79 before stabilizing above $82 in premarket, a sign of dip buyers stepping in.
Under the hood, General Motors is a cash machine but a thin-margin one. GM pulled in about $48.0B of Q2 revenue with only $1.3B in net income, and profit margins around 1%–1.1% are razor-thin for a cyclical name. Yet GM still generated roughly $6.4B in operating cash flow and about $1.1B in free cash flow that quarter, keeping liquidity strong with about $23.6B in ending cash.
More Breaking News
Valuation looks deceptively cheap and rich at the same time. GM trades at roughly 0.39 times sales and about 1.17 times book value, but the price/earnings ratio sits near 36.9 because earnings are depressed. For traders, that screams “expect volatility” as margins and sentiment swing with every macro and EV headline.
Why Traders Are Watching GM’s EV Reset
The tape around GM is sending one message, while the business headlines send another. U.S. Q3 vehicle sales dropped about 5.5%–6% year over year to around 670,974 units, yet GM shares actually popped between 1.5% and 2.5% on the sales release. That sort of reaction tells traders one thing: the market expected worse. When bad news hits and GM stock still grinds higher, shorts can get trapped and momentum scalpers start circling.
But the core story is still heavy. Cox Automotive sees General Motors’ U.S. new‑vehicle volumes down 5.2% in Q3 even as the overall auto market grows. In plain English, the pie is getting bigger while GM’s slice shrinks. For active traders, loss of share in a rising market is a key red flag — it hints that pricing power and brand pull are slipping.
The EV side is where the real pressure sits. GM’s U.S. EV sales plunged about 62% in Q3. Some of that is timing; last year’s federal incentive cliff pulled demand forward into 2025. But a drop that steep says the GM electrification story is not on a clean up‑and‑to‑the‑right path.
General Motors is responding by slashing its Chevrolet Bolt EV production plan by roughly 75%, targeting about 35,000 units before ending production in Q1 2027 versus an original plan near 150,000. That is a major reset. For GM traders, it raises questions: where does the next wave of EV volume come from, and how much capital has been sunk into a product the company is now winding down?
Add in the CFO’s warning about rising competition from Toyota, Stellantis, and fast‑moving Chinese names like BYD and Chery, and you get the bigger picture: GM is fighting for share on multiple fronts while overhauling its lineup. Those remarks knocked GM stock down about 1.6%, proof that the market listens closely when a legacy giant admits the road is getting tougher.
Conclusion
For active traders, GM is turning into a battleground name. On one side, you have a legacy automaker that still generates over $48.0B in quarterly revenue, throws off billions in operating cash, and keeps more than $20B in cash on the balance sheet. The chart shows General Motors grinding higher from the high‑$70s into the low‑$80s, with buyers stepping in on every dip so far.
On the other side, you have shrinking U.S. market share, a roughly 5.5%–6% drop in Q3 unit sales, and a 62% collapse in U.S. EV volumes that forced GM to slash Chevrolet Bolt EV production plans by about three‑quarters. Pair that with CFO commentary about intensifying competition from Toyota, Stellantis, BYD, and Chery, and it’s clear General Motors is trading through a real structural test, not just a one‑quarter hiccup.
For short‑term players, volatility in GM around each sales update and EV headline is the opportunity. For longer‑term, thesis‑driven traders, the key question is whether this EV reset is a painful but necessary pivot or the start of a longer slide. As Tim Sykes likes to say, “The market doesn’t care about your opinion, only your discipline — cut losses fast and let the chart prove the story.” As millionaire penny stock trader and teacher Tim Sykes says, “The goal is not to win every trade but to protect your capital and keep moving forward.”.
This analysis of GM and General Motors is for educational and research purposes only and is not investment advice.
This is stock news, not investment advice. Timothy Sykes News delivers real-time stock market news focused on key catalysts driving short-term price movements. Our content is tailored for active traders and investors seeking to capitalize on rapid price fluctuations, particularly in volatile sectors like penny stocks. Readers come to us for detailed coverage on earnings reports, mergers, FDA approvals, new contracts, and unusual trading volumes that can trigger significant short-term price action. Some users utilize our news to explain sudden stock movements, while others rely on it for diligent research into potential investment opportunities.
Dive deeper into the world of trading with Timothy Sykes, renowned for his expertise in penny stocks. Explore his top picks and discover the strategies that have propelled him to success with these articles:
- Penny Stocks Trading Guide
- Best Penny Stocks Under $1 to Buy Today
- Top 8 Penny Stocks to Watch on Robinhood
Once you’ve got some stocks on watch, elevate your trading game with StocksToTrade the ultimate platform for traders. With specialized tools for swing and day trading, StocksToTrade will guide you through the market’s twists and turns.
Dig into StocksToTrade’s watchlists here:





Leave a reply