

Alpha Modus Holdings Inc. rallies as investors cheer its latest AI-driven fintech partnership, with stocks have been trading up by 51.14 percent
Key Takeaways
- Alpha Modus Holdings Inc. shares have retreated from early-October spikes above $5 to trade near the mid-$1s, signaling fading momentum and heavier selling pressure.
- Recent intraday action in AMOD shows wild swings between $1.28 and just under $2, a classic day-trading playground but a warning sign for slower traders.
- The latest report shows tiny revenue of about $7,000 against heavy losses, putting Alpha Modus Holdings Inc. deep in the red.
- AMOD’s balance sheet carries negative equity and high short-term debt, forcing traders to watch cash runway and potential dilution.
- Technical traders are tracking consolidation in the low $1s as a potential make-or-break support zone for AMOD.
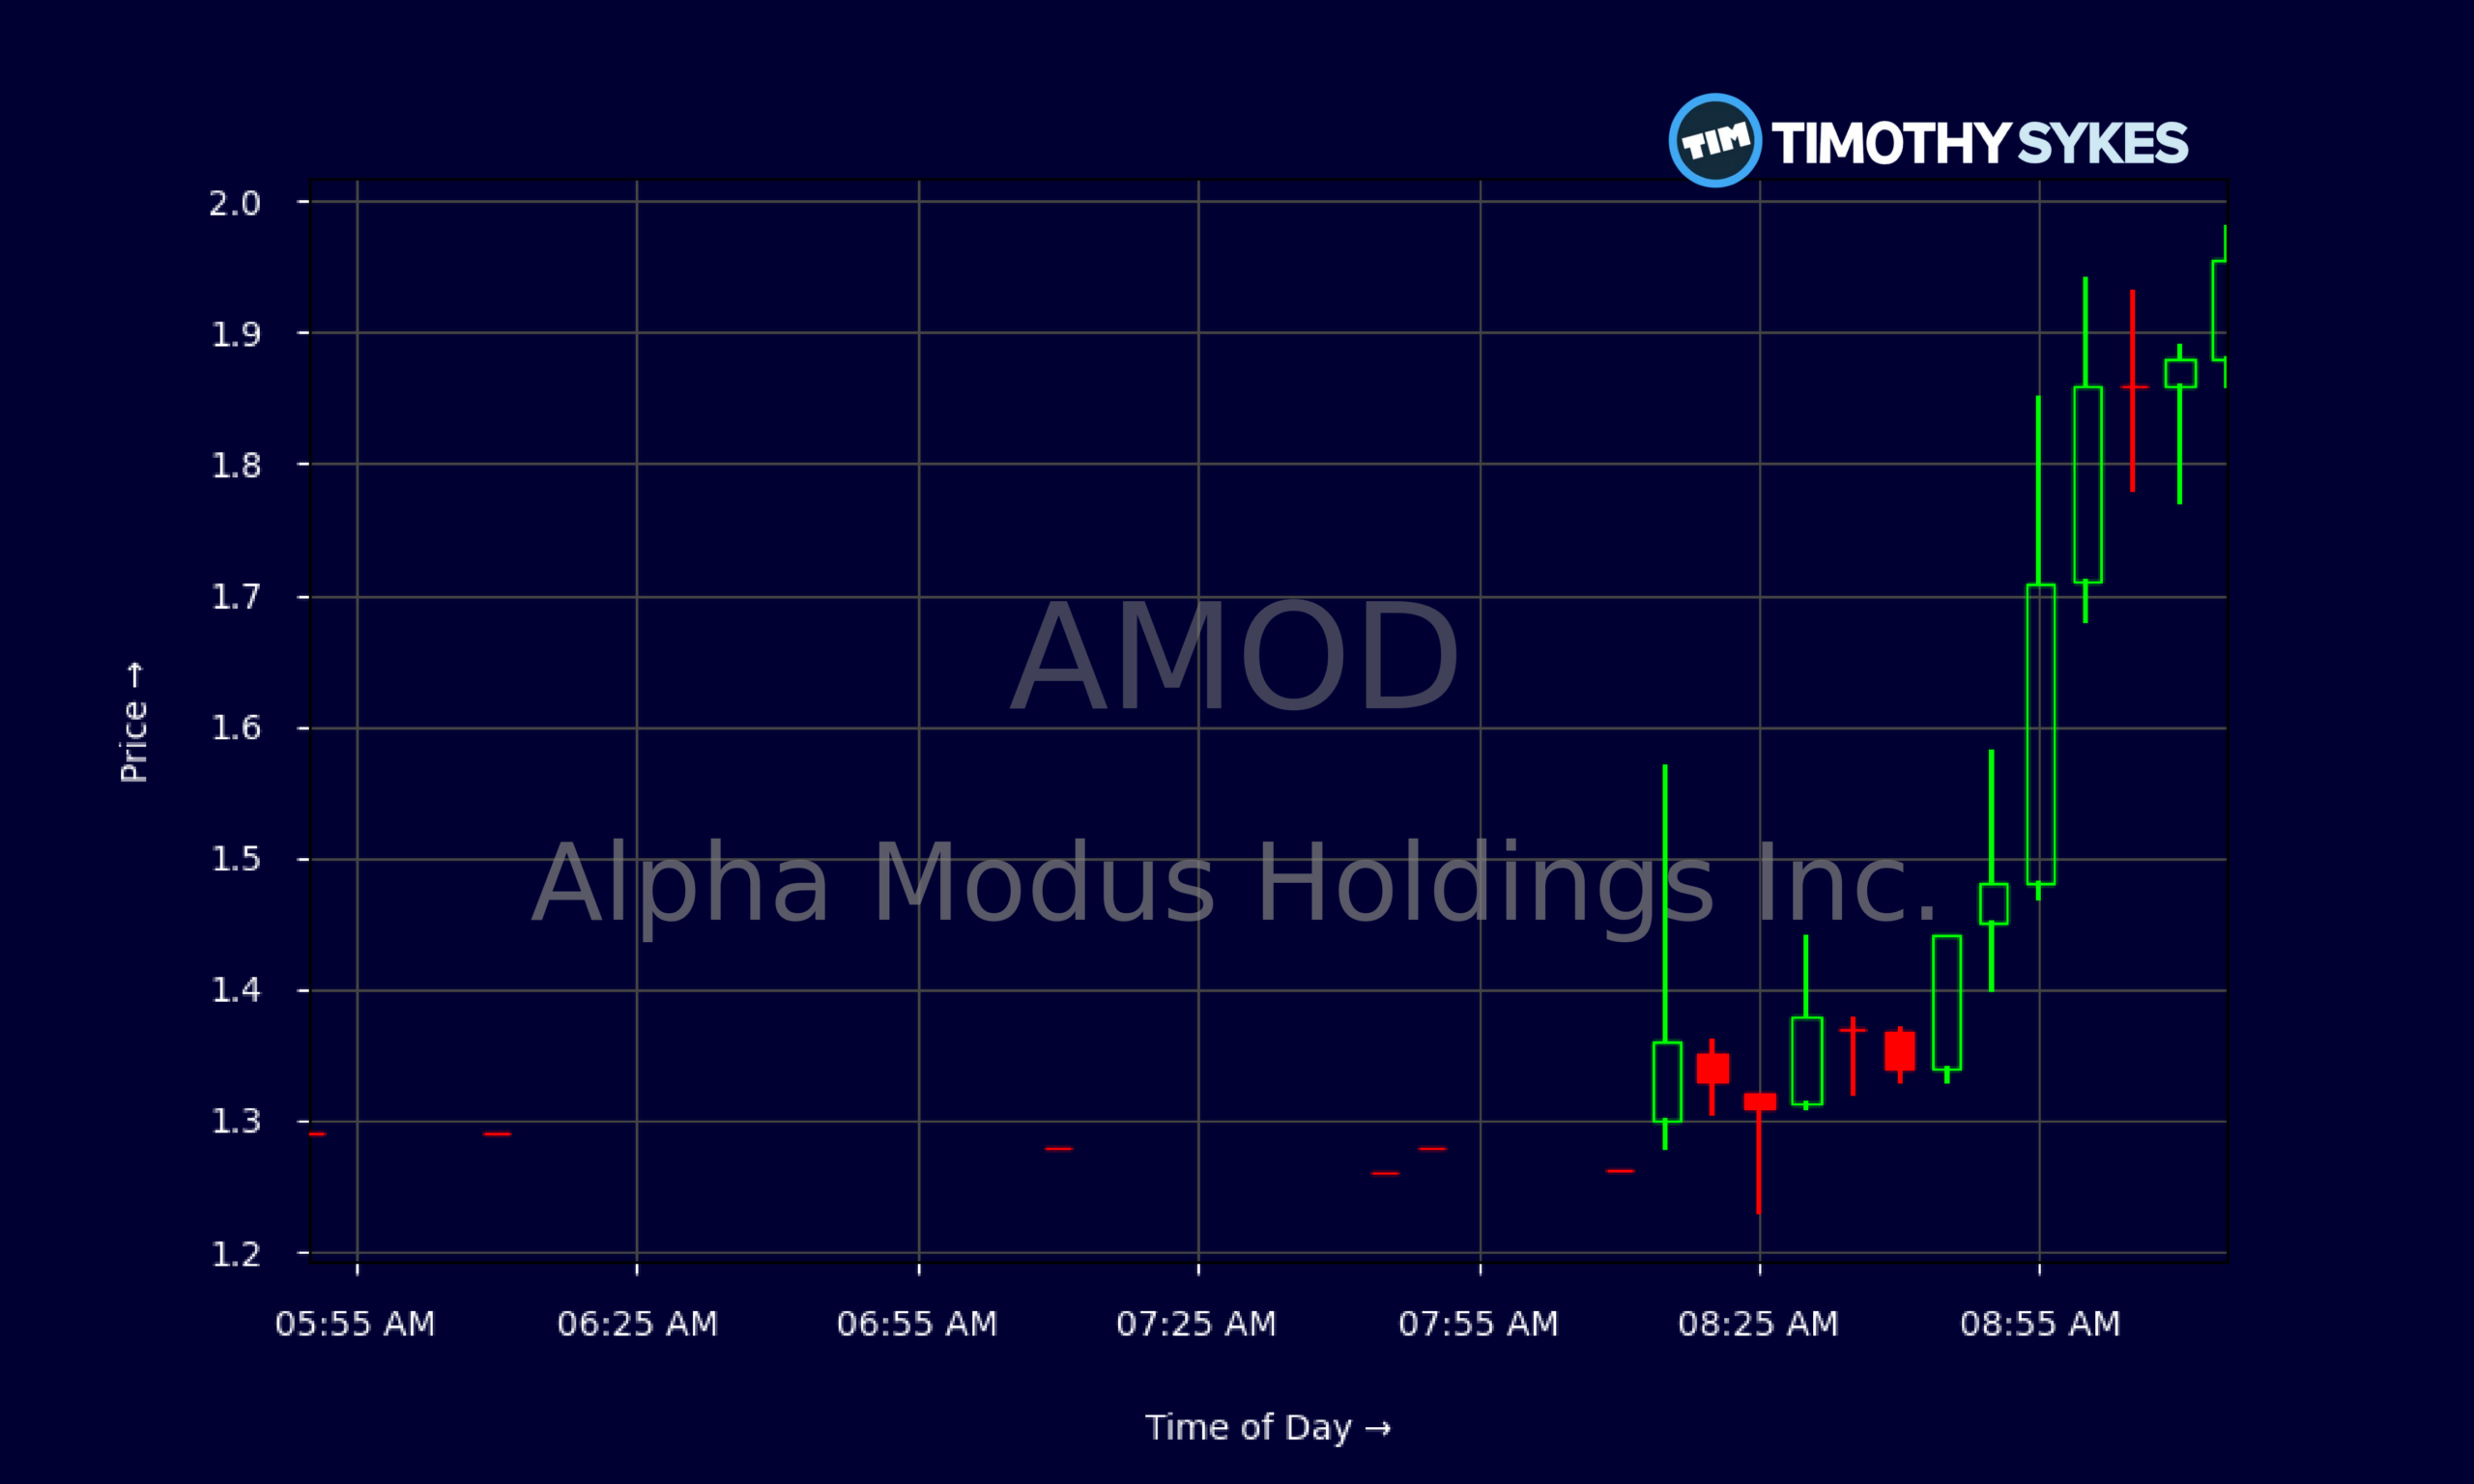
Live Update At 09:19:14 EDT: On Wednesday, October 21, 2026 Alpha Modus Holdings Inc. stock [NASDAQ: AMOD] is trending up by 51.14%! Discover the key drivers behind this movement as well as our expert analysis in the detailed breakdown below.
Quick Financial Overview
Alpha Modus Holdings Inc. is a tiny name with big volatility. On paper, AMOD generated only about $7,000 in revenue over the recent period. That is almost nothing for a listed company. At the same time, the income statement shows a net loss of roughly $2.15M and an EBITDA loss near $1.47M. For traders, that means AMOD is a story of speculation, not steady cash flow.
The balance sheet is even louder. Alpha Modus Holdings Inc. holds about $2.0M in cash but carries roughly $9.5M in total liabilities and negative equity of around -$6.1M. Working capital sits deep in the hole at about -$6.3M, with current debt near $6.2M. AMOD is using financing to stay alive, raising about $1.0M from stock issuance and roughly $2.0M from new debt in the latest quarter.
More Breaking News
Key ratios back this up. Return on assets is brutally negative, and book value per share is below zero. AMOD does not pay dividends and has high cash burn, with free cash flow around -$0.9M. For active traders, Alpha Modus Holdings Inc. is a classic high-risk, high-volatility ticker that lives and dies by sentiment and chart action rather than fundamentals.
Why Traders Are Watching AMOD’s Volatile Chart
The chart tells the story most clearly. At the start of October, AMOD ripped from the $1.50 area to intraday highs above $5. That kind of move attracts momentum traders fast. But just as quickly, Alpha Modus Holdings Inc. gave those gains back. Over the next sessions, the stock slid step by step: $3s, then $2s, now consolidating in the mid-$1s. That is a textbook pump-and-fade structure.
Look at the recent intraday tape. AMOD traded as low as $1.28 premarket, then ripped toward $1.95 within a couple of hours. That is more than a 50% intraday range on a sub-$2 stock. For short-term traders, this is opportunity. For anyone not watching level 2 and volume, it is danger.
Alpha Modus Holdings Inc. volume spikes often line up with those big wicks on the candles. You see early squeezes above $2 fading into lower highs, which hints that bagholders are selling into strength. AMOD now has a series of lower closes from the October peak, with each bounce being sold more aggressively.
At the same time, the stock has not completely broken down. The low-$1 zone has held several times, and that gives day traders a clear line in the sand. If AMOD holds above that support, short-covering pops back toward $1.80–$2 are always on the table. If it cracks, the chart opens up for a deeper washout. For traders who love volatility and tight risk control, Alpha Modus Holdings Inc. stays firmly on the watchlist.
Conclusion
AMOD is a classic example of a speculative, story-driven small cap where price action moves far faster than the fundamentals. Alpha Modus Holdings Inc. runs a business with minimal revenue, heavy operating losses, and negative equity, backed by constant financing activity. That is not a stable long-term profile. But it is exactly the type of name that can double or halve in a day when volume floods in.
For traders, the key is discipline. The daily chart shows AMOD unwinding from a parabolic spike above $5 down into the $1s, with clear resistance stacking up in the $2–$3 area. The intraday chart highlights violent swings and sharp reversals. Alpha Modus Holdings Inc. rewards those who plan entries around support and cut losses quickly when the pattern breaks.
Cash of roughly $2.0M against heavy current debt keeps the risk of future dilution and financing on the table. That reality often caps sustained rallies in stocks like AMOD. As Tim Sykes likes to say, “The market doesn’t care about your opinion, only your risk management.” As millionaire penny stock trader and teacher Tim Sykes, says, “The goal is not to win every trade but to protect your capital and keep moving forward.”. For anyone trading Alpha Modus Holdings Inc., the chart, the cash burn, and the debt load all point to the same lesson: trade the volatility, respect the risk, and never confuse a quick move with a secure long-term play.
This is stock news, not investment advice. Timothy Sykes News delivers real-time stock market news focused on key catalysts driving short-term price movements. Our content is tailored for active traders and investors seeking to capitalize on rapid price fluctuations, particularly in volatile sectors like penny stocks. Readers come to us for detailed coverage on earnings reports, mergers, FDA approvals, new contracts, and unusual trading volumes that can trigger significant short-term price action. Some users utilize our news to explain sudden stock movements, while others rely on it for diligent research into potential investment opportunities.
Dive deeper into the world of trading with Timothy Sykes, renowned for his expertise in penny stocks. Explore his top picks and discover the strategies that have propelled him to success with these articles:
- Penny Stocks Trading Guide
- Best Penny Stocks Under $1 to Buy Today
- Top 8 Penny Stocks to Watch on Robinhood
Once you’ve got some stocks on watch, elevate your trading game with StocksToTrade the ultimate platform for traders. With specialized tools for swing and day trading, StocksToTrade will guide you through the market’s twists and turns.
Dig into StocksToTrade’s watchlists here:





Leave a reply