

SLM Corporation faces heightened investor anxiety after news, as its stocks have been trading down by -9.42 percent.
What Traders Need To Know
- Q3 loss of $0.19 per share versus a $0.63 profit a year ago, with a double miss on EPS and revenue, drove a sharp negative reaction and a 4.4% after-hours drop.
- Q3 revenue of $375.5M badly trailed the roughly $453.3M consensus, signaling weaker core performance than the market expected.
- FY26 EPS guidance was slashed to $1.95–$2.05 from $3.10–$3.20, well under prior consensus near $3.11–$3.12 and pointing to weaker medium-term earnings power.
- Net charge-offs jumped to $90.4M in Q3 and $292M year-to-date, prompting higher full-year charge-off guidance of $400–$420M and more than a one-third cut to annual earnings guidance.
- Multiple securities law investigations, including Levi & Korsinsky, now target SLM Corporation disclosures and practices, adding legal and reputational overhang for those who bought shares before 2025/07/25 and still hold them.
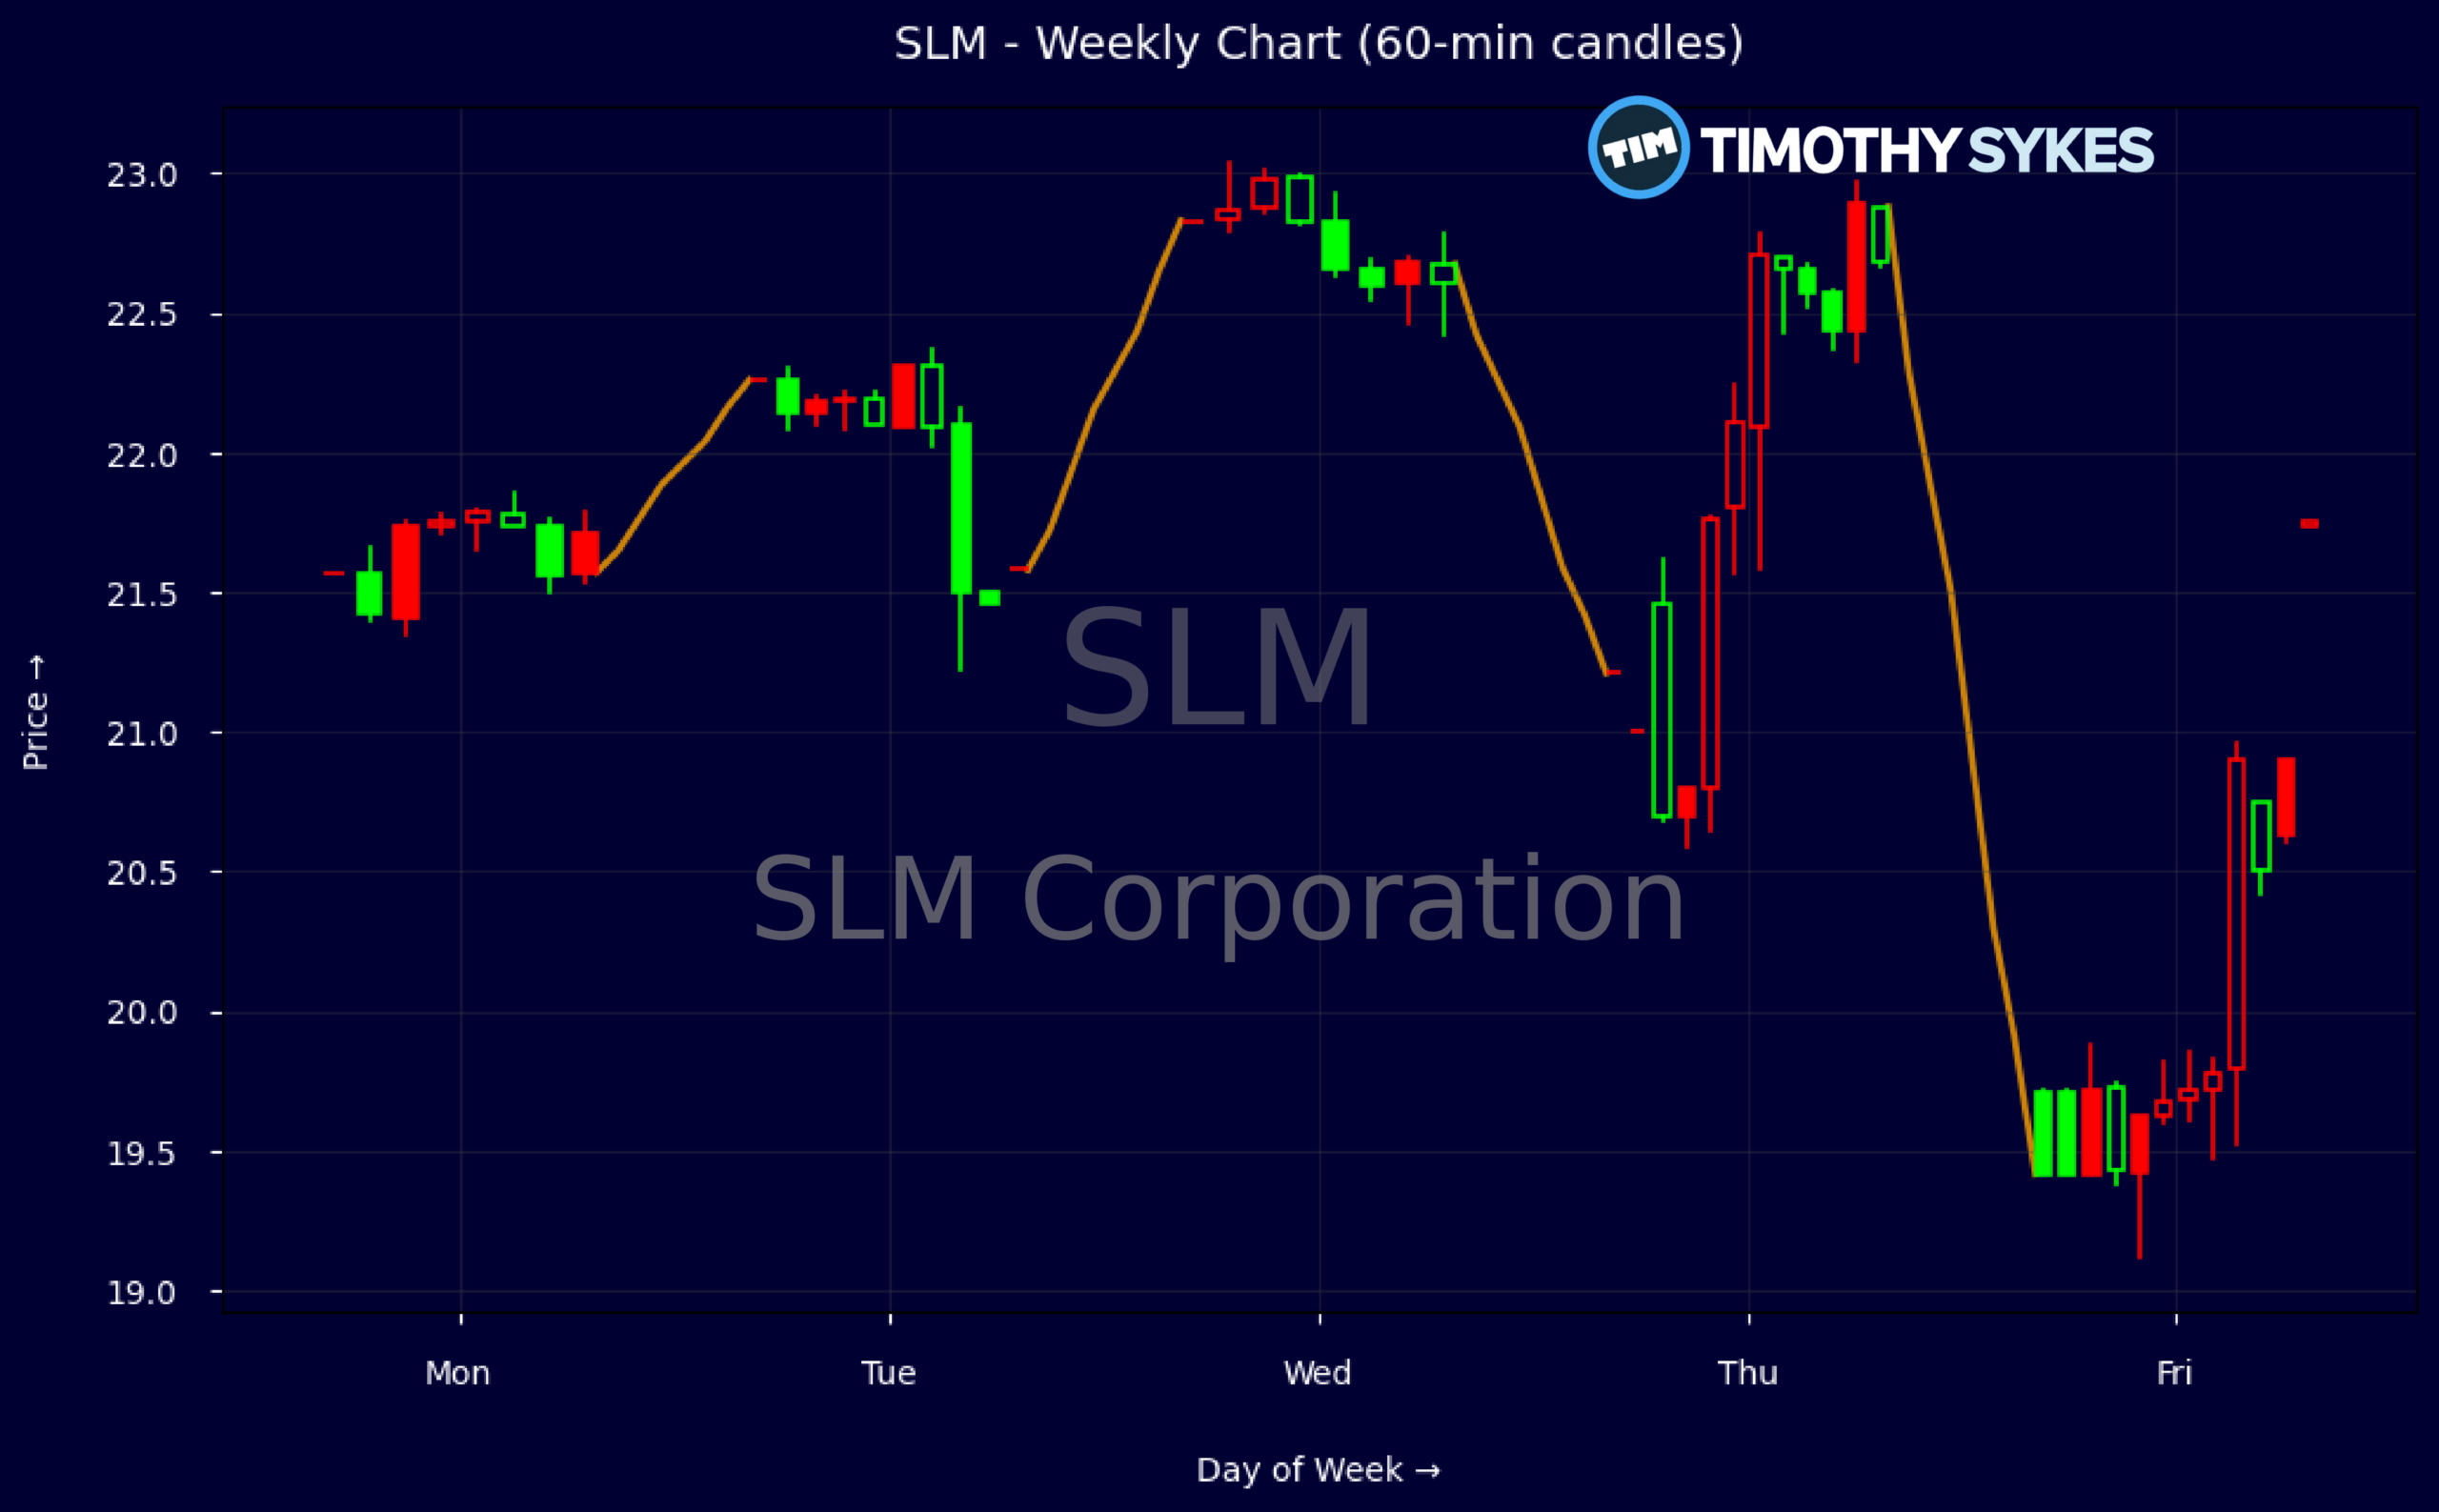
Weekly Update Oct 19 – Oct 23, 2026: On Sunday, October 25, 2026 SLM Corporation stock [NASDAQ: SLM] is trending down by -9.42%! Discover the key drivers behind this movement as well as our expert analysis in the detailed breakdown below.
Finance industry expert:
Analyst sentiment – negative
SLM sits in a niche U.S. private student‑lending and consumer finance position with historically strong profitability but now flashing deterioration. Pre‑tax and consolidated profit margins above 35% and ROE above 30% screen very well versus specialty finance peers, but the latest quarter delivered a net loss, negative operating cash flow, and rising charge‑offs. High leverage (D/E 2.6x, leverage ratio ~13x) and asset‑turnover of 0.1x underscore a capital‑intensive, credit‑cycle‑sensitive model. Dividend yield near 2.7% remains covered but increasingly vulnerable.
Technically, the stock has reversed from a short‑term uptrend (21.57 → 22.83) into a sharp weekly reversal, closing at 19.71 on clear post‑earnings distribution. Intraday 5‑minute action shows heavy sell volume on breaks below 21 and 20, confirming aggressive supply. The dominant trend is now down with momentum acceleration. For tactical traders, 20.50–21.00 is the first major resistance zone; risk‑defined short setups are attractive below 20.50 with a near‑term downside target around 18.50.
Fundamentally and from a catalyst standpoint, risk skew is negative. SLM badly missed Q3 expectations, swung to a loss, cut FY26 EPS guidance by over a third, and raised charge‑off guidance to $400–420M while pausing most third‑party recoveries. Multiple law‑firm investigations and a JPMorgan Underweight with a $22 target add legal and sentiment overhangs. Versus finance and credit‑finance benchmarks, credit quality and earnings visibility are materially worse. Fair value gravitates toward 18–19, with resistance at 21 and support near 18.
More Breaking News
Quick Financial Overview
SLM Corporation just delivered a very weak quarter. The company swung to a Q3 net loss of $0.19 per share from a $0.63 profit a year earlier, and both earnings and revenue missed Street expectations by a wide margin. Total revenue of $375.5M fell far short of the roughly $453.3M consensus, undercutting confidence in the strength of the loan book and fee streams.
Guidance was the second blow. Management cut FY26 EPS guidance to a $1.95–$2.05 range from $3.10–$3.20, well under prior consensus around $3.11–$3.12. JPMorgan responded by trimming its price target from $25 to $22 and kept an Underweight rating, pointing to macro pressure on U.S. consumers and higher-for-longer interest rates. Key ratios still show a low trailing P/E near 6.3 and strong reported return on equity above 28%, but those backward-looking figures now clash with much weaker forward guidance.
Credit quality is at the core of the problem. SLM paused most third-party recovery activities while net charge-offs surged to $90.4M in Q3 and $292M year-to-date, and full-year charge-off guidance jumped to $400–$420M. Heavy leverage (debt-to-equity near 2.6 and a leverage ratio about 12.9) means rising losses hit equity hard. On the chart, weekly closes slid from $22.83 to $19.71, and intraday action shows a dump from above $20 to a $19.11 low, confirming aggressive selling pressure.
Conclusion
Legal, Credit, And Earnings Headwinds Dominate The Tape
For traders, SLM now trades as a troubled credit story rather than a stable yield play. The Q3 loss, the large revenue miss, and the sharp cut to both near-term and FY26 EPS guidance all tell the same story: earnings power is resetting lower. Rising charge-offs and the pause in third-party recoveries, combined with higher full-year loss guidance, show that credit stress is not just a headline risk, it is hitting the income statement in real time.
On top of that, multiple securities law firms, including Levi & Korsinsky, are probing SLM Corporation for potential disclosure issues around collection and recovery practices and past communications. That legal overhang can cap rallies and keep volatility elevated. Price-wise, the drop from the $22–$23 area to sub-$20, plus the roughly 9% slide after the 10-Q disclosure, signals a broken short-term trend and a market that is repricing risk quickly.
For active traders, SLM is now a textbook high-risk, event-driven name: guidance is lower, macro headwinds are clear, and legal and credit questions are front and center. Any bounce will likely be sold until the company proves it can stabilize losses and rebuild trust. In this kind of tape, risk management and capital preservation matter more than trying to nail every short-term move. As millionaire penny stock trader and teacher Tim Sykes, says, “The goal is not to win every trade but to protect your capital and keep moving forward.”. As I tell my students worldwide, “When earnings roll over, credit losses spike, and lawyers start circling, you trade the volatility with tight risk — you don’t marry the stock.” This article is for educational and research use only, not a recommendation to trade.
“,”scores”:{“risk-level”:”high”},”trade”:”false
This is stock news, not investment advice. Timothy Sykes News delivers real-time stock market news focused on key catalysts driving short-term price movements. Our content is tailored for active traders and investors seeking to capitalize on rapid price fluctuations, particularly in volatile sectors like penny stocks. Readers come to us for detailed coverage on earnings reports, mergers, FDA approvals, new contracts, and unusual trading volumes that can trigger significant short-term price action. Some users utilize our news to explain sudden stock movements, while others rely on it for diligent research into potential investment opportunities.
Dive deeper into the world of trading with Timothy Sykes, renowned for his expertise in penny stocks. Explore his top picks and discover the strategies that have propelled him to success with these articles:
- Penny Stocks Trading Guide
- Best Penny Stocks Under $1 to Buy Today
- Top 8 Penny Stocks to Watch on Robinhood
Once you’ve got some stocks on watch, elevate your trading game with StocksToTrade the ultimate platform for traders. With specialized tools for swing and day trading, StocksToTrade will guide you through the market’s twists and turns.
Dig into StocksToTrade’s watchlists here:





Leave a reply