

PicoCELA Inc. stocks have been trading up by 34.12 percent amid strong optimism over its latest networking technology advancements.
Key Takeaways
- PCLA has bounced from the mid-$5s to near $8–$9, signaling fresh momentum after a multi-day pullback.
- Intraday trading in PicoCELA Inc. shows wide $1+ swings, offering clear range-trading and breakout setups for nimble traders.
- The latest balance sheet shows strong cash versus modest debt, giving PCLA room to execute without heavy funding pressure.
- Negative returns on equity and steep losses keep PCLA in high-risk, high-reward territory.
- Active traders are watching key support around $6 and resistance near $9 as the next big inflection zone for PCLA.
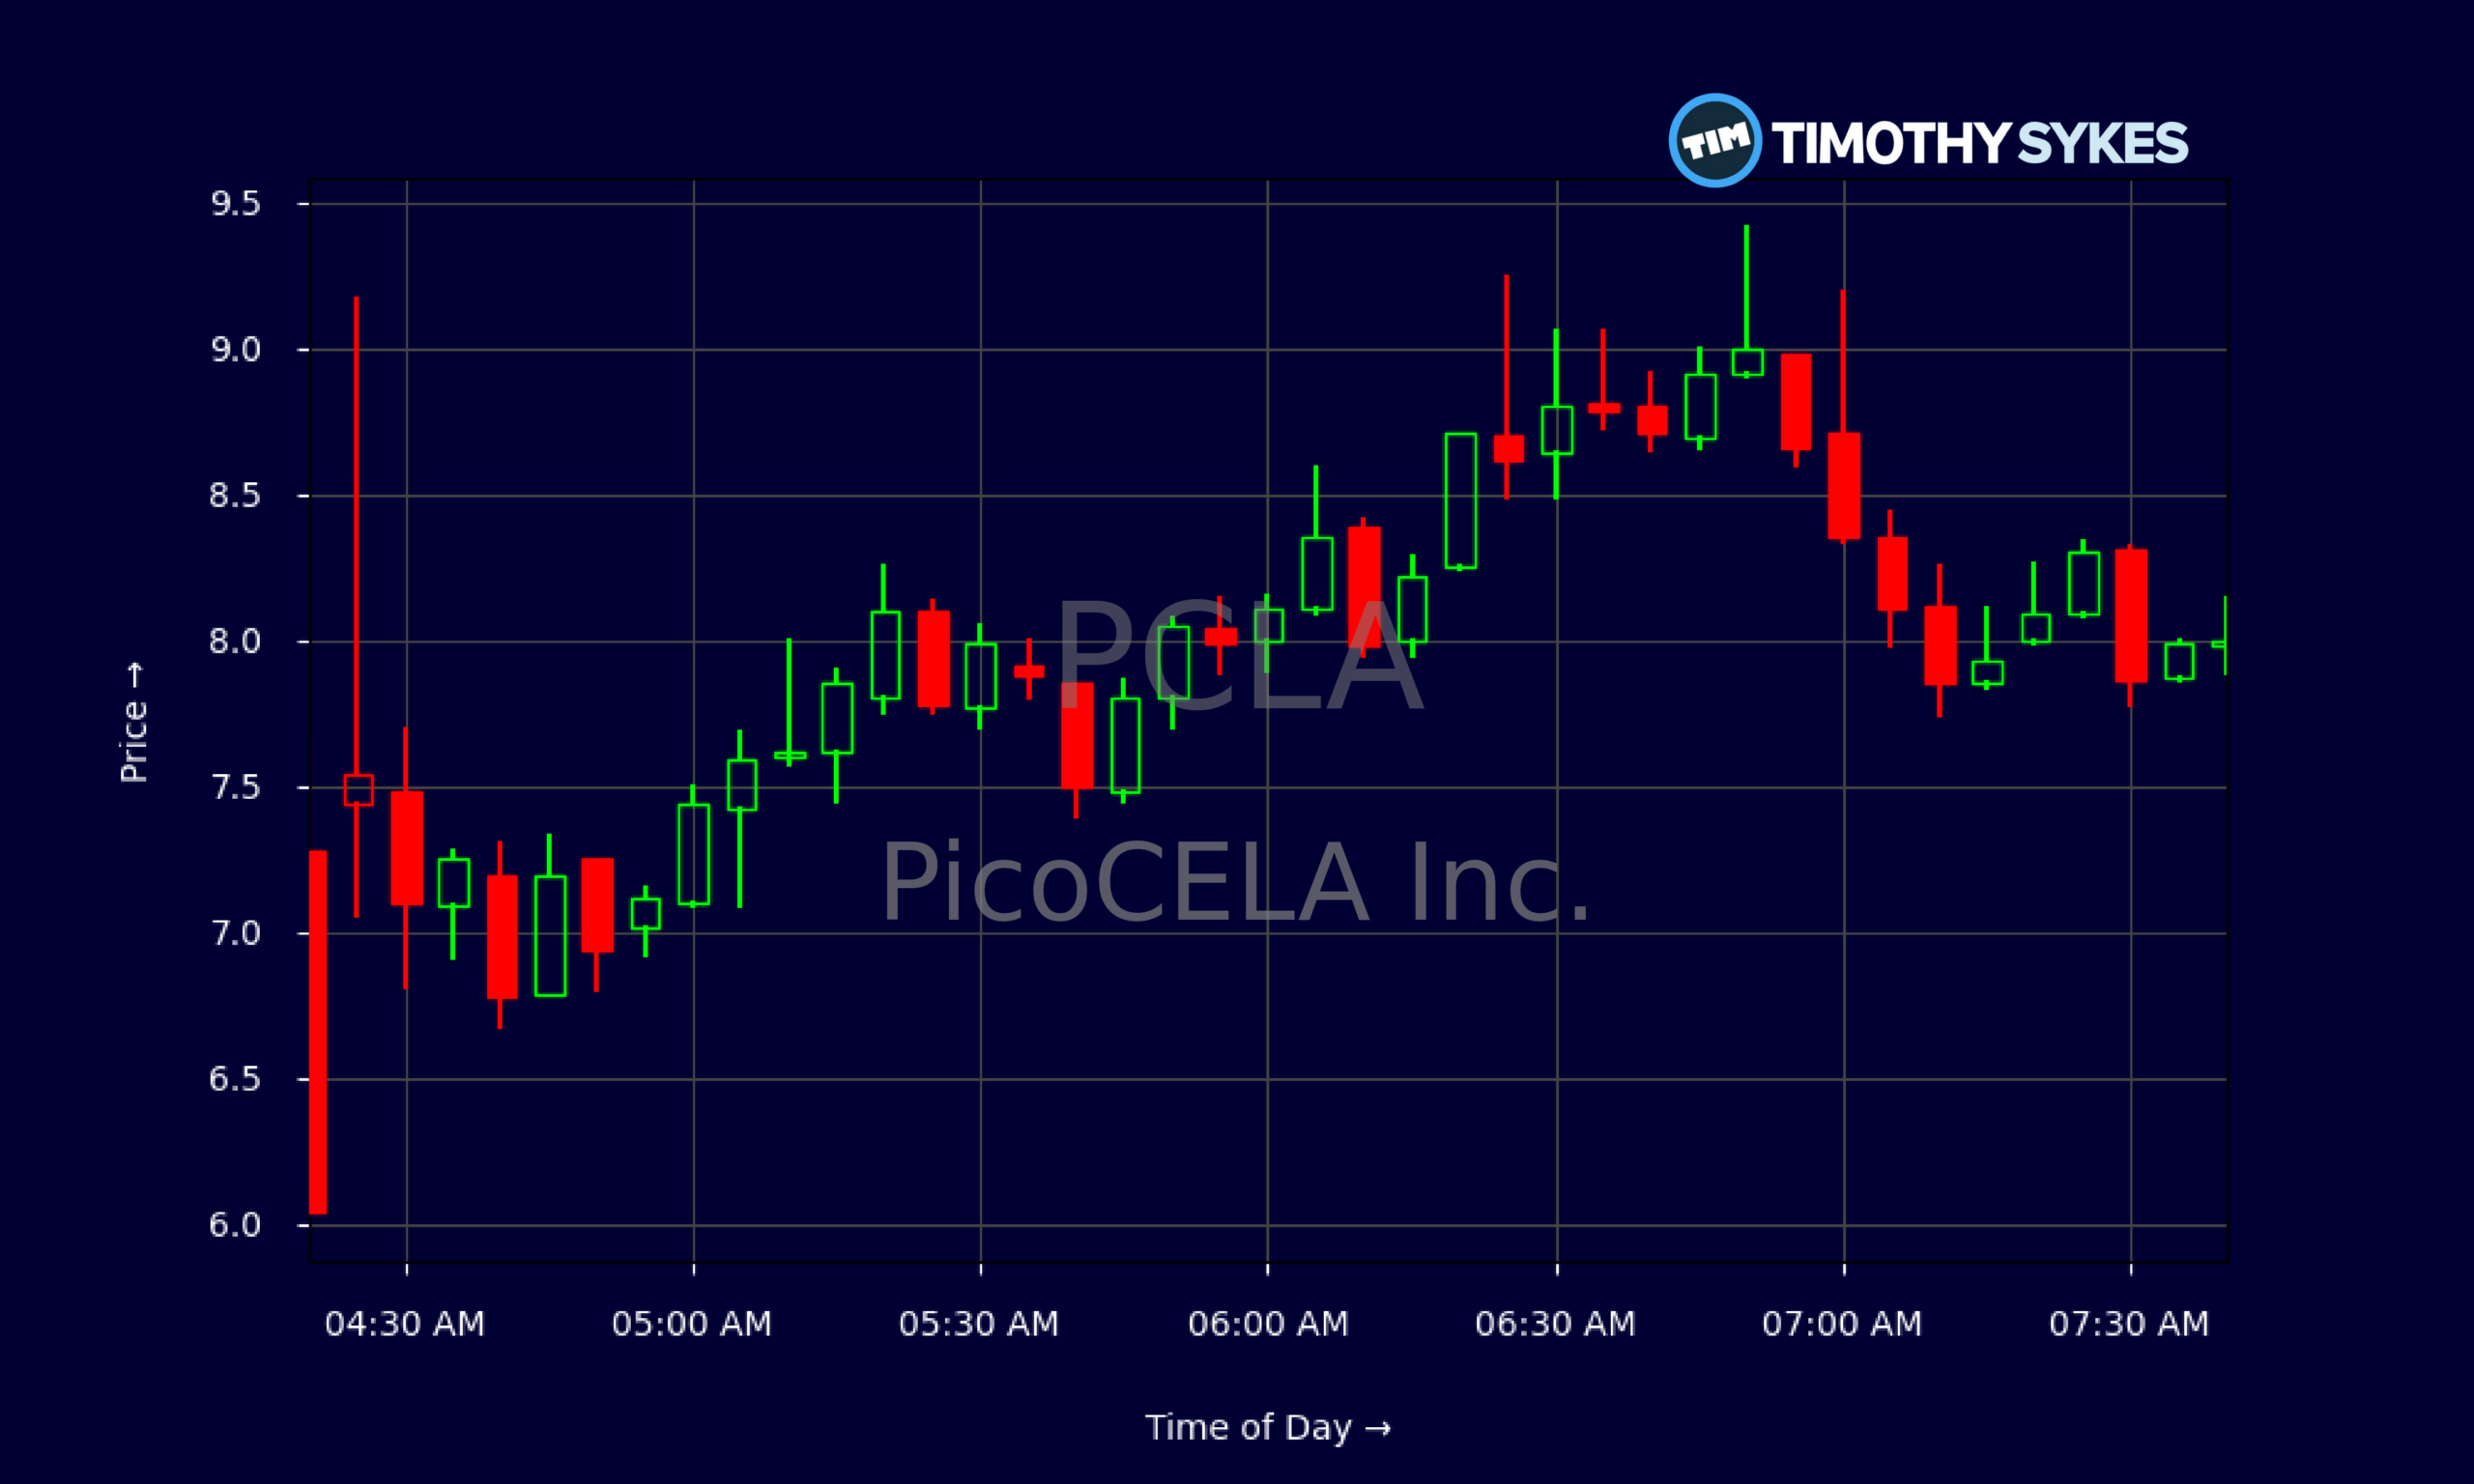
Live Update At 07:47:26 EDT: On Thursday, October 29, 2026 PicoCELA Inc. stock [NASDAQ: PCLA] is trending up by 34.12%! Discover the key drivers behind this movement as well as our expert analysis in the detailed breakdown below.
Quick Financial Overview
PicoCELA Inc., trading under ticker PCLA, is a classic high-growth, high-burn story. Revenue sits around $544.69M, yet the company is still very far from profitability. The pre-tax profit margin near -114% tells traders that PCLA is spending heavily to grow or sustain its business, and those losses are real, not just accounting noise.
The balance sheet is where PCLA gets more interesting. PicoCELA Inc. reports about $534.889M in cash and short-term investments against roughly $261.94M in current debt and only $10.44M in long-term debt. That level of cash gives PCLA meaningful runway, even with current losses, and keeps worst‑case dilution risk more controlled in the near term.
More Breaking News
On the equity side, PCLA shows about $469.948M of common stock equity but retained earnings of roughly -$2.83B. That deep deficit explains the ugly return on equity of about -16% and a return on assets near -7.6%. Valuation is rich: a price-to-sales ratio around 17.93 and price-to-book near 20.78 mean traders are paying up for potential, not current earnings. For momentum-focused traders, PicoCELA Inc. is a cash‑cushioned but speculative vehicle where trends can move fast.
Why Traders Are Watching PCLA Price Action
PCLA’s chart is where the story really heats up. On the daily side, PicoCELA Inc. spent recent sessions grinding lower from the $6.80–$6.90 zone down toward the mid-$5s, with closes slipping from about $6.60 to just under $6.00. That slow fade shook out weak hands and reset expectations. Now, the latest intraday tape shows a sharp character change: PCLA spiked from near $6.00 at 04:20 to above $9.00 within the first hour of premarket, printing heavy swings with big wicks in both directions.
This type of price action is what day traders live for. PCLA ran from roughly $7.20 to $9.24, then dipped back into the high-$7s before grinding in an $8.00–$9.00 band. Those are huge percentage moves in a single morning. For pattern traders, PicoCELA Inc. is showing classic momentum behavior: aggressive gap up, fast push to new highs, then consolidation with wide intraday ranges.
Technically, prior daily highs in the $6.70–$6.90 range now act as a pivot. Holding above that zone turns old resistance into support and confirms a possible trend change. On the upside, the premarket high around $9.24 becomes a clear level to watch. A strong push through $9 with volume could attract more breakout traders to PCLA, while repeated failures there may turn the move into a short‑term blow‑off top. With valuation already stretched, traders in PicoCELA Inc. should treat this as a pure price‑action play, not a value story.
Conclusion
PCLA sits in that sweet spot many active traders hunt: liquid enough to move cleanly, volatile enough to matter, and backed by a balance sheet that buys time. PicoCELA Inc. has a big cash pile, manageable debt, and strong revenue, but it is still deeply unprofitable and richly valued. That combination tends to amplify both rallies and pullbacks as sentiment shifts.
On the chart, the key levels are clear. Support in the mid-$6s marks the line where the new uptrend thesis starts to crack. Resistance around $9–$9.25 is the ceiling that separates a routine spike from a real momentum breakout. Traders who focus on PCLA now are tracking whether price can build higher lows above $7.50 and eventually chew through that $9 area on strong volume.
The core lesson from PicoCELA Inc. at this stage is about discipline. As Tim Sykes loves to say, “Cut losses quickly, because big losses start out as small ones.” That principle lines up perfectly with another of his trading reminders: As millionaire penny stock trader and teacher Tim Sykes, says, “It’s better to go home at zero than to go home in the red.”. For anyone trading PCLA, that mindset matters. This stock rewards preparation, strict risk management, and respect for volatility. Used the right way, PCLA’s wild swings are a training ground for reading momentum — not a place to marry a long‑term bias.
This is stock news, not investment advice. Timothy Sykes News delivers real-time stock market news focused on key catalysts driving short-term price movements. Our content is tailored for active traders and investors seeking to capitalize on rapid price fluctuations, particularly in volatile sectors like penny stocks. Readers come to us for detailed coverage on earnings reports, mergers, FDA approvals, new contracts, and unusual trading volumes that can trigger significant short-term price action. Some users utilize our news to explain sudden stock movements, while others rely on it for diligent research into potential investment opportunities.
Dive deeper into the world of trading with Timothy Sykes, renowned for his expertise in penny stocks. Explore his top picks and discover the strategies that have propelled him to success with these articles:
- Penny Stocks Trading Guide
- Best Penny Stocks Under $1 to Buy Today
- Top 8 Penny Stocks to Watch on Robinhood
Once you’ve got some stocks on watch, elevate your trading game with StocksToTrade the ultimate platform for traders. With specialized tools for swing and day trading, StocksToTrade will guide you through the market’s twists and turns.
Dig into StocksToTrade’s watchlists here:





Leave a reply