

Davion Healthcare Plc stocks have been trading up by 23.0 percent amid heightened investor optimism over its latest healthcare expansion.
Key Takeaways
- DAVI has dropped from a recent high above $12 to around $3, showing a sharp multi-day fade and heavy volatility.
- Intraday trading in Davion Healthcare Plc now sits in a tight $3.60–$3.70 band, signaling short-term consolidation after steep losses.
- The DAVI balance sheet is tiny, with just $1,058 in cash and over $900,000 in long-term liabilities, highlighting a fragile capital structure.
- Goodwill and intangibles dominate Davion Healthcare Plc assets, raising questions about tangible backing for the current market value.
- Active traders are watching whether DAVI holds the $3 level or unwinds further if selling pressure resumes.
Live Update At 09:18:44 EDT: On Wednesday, October 28, 2026 Davion Healthcare Plc stock [NASDAQ: DAVI] is trending up by 23.0%! Discover the key drivers behind this movement as well as our expert analysis in the detailed breakdown below.
Quick Financial Overview
DAVI is trading like a classic low-float story stock — big moves, thin backing. Over four recent sessions, Davion Healthcare Plc slid from a high of $12.30 down to a $3 close. That’s a rough drawdown, and it tells traders that momentum has flipped from aggressive chasing to aggressive selling.
On the balance sheet, DAVI reports total assets of about $2.33M. But most of that is goodwill and other intangibles, roughly $2.18M. Actual cash is only $1,058. Current assets total about $140,598 versus current liabilities of $88,511, leaving Davion Healthcare Plc with modest positive working capital, but not a lot of room for error.
More Breaking News
Total liabilities sit near $996,182, including $907,671 in non-current obligations. Retained earnings are deeply negative at about -$8.32M, which shows a history of losses. Against that, common stock equity is $1.33M, backed largely by intangibles. For traders, this combination — weak tangible base, negative earnings history, and extreme price swings — marks DAVI as a speculative trading vehicle, not a steady compounder.
Why Traders Are Watching DAVI Price Action
DAVI has turned into the type of chart that momentum traders love to study and hate to chase blindly. In just a few days, Davion Healthcare Plc ripped to the $12 area and then unwound to the low single digits. That kind of round trip is a textbook reminder: when a thinly traded name goes parabolic, gravity usually wins.
Look at the recent daily candles. On 2026/10/22, DAVI hit a high near $12.30 and still closed strong around $11.65. The next day, the stock opened at $8.89 and closed at $6. By 2026/10/26, Davion Healthcare Plc was printing a $4.91 high but finished at $4.07. Then on 2026/10/27, it closed at $3 after touching a low below $2.80. Each day, lower highs and lower closes. That’s a clear downtrend after the blow-off top.
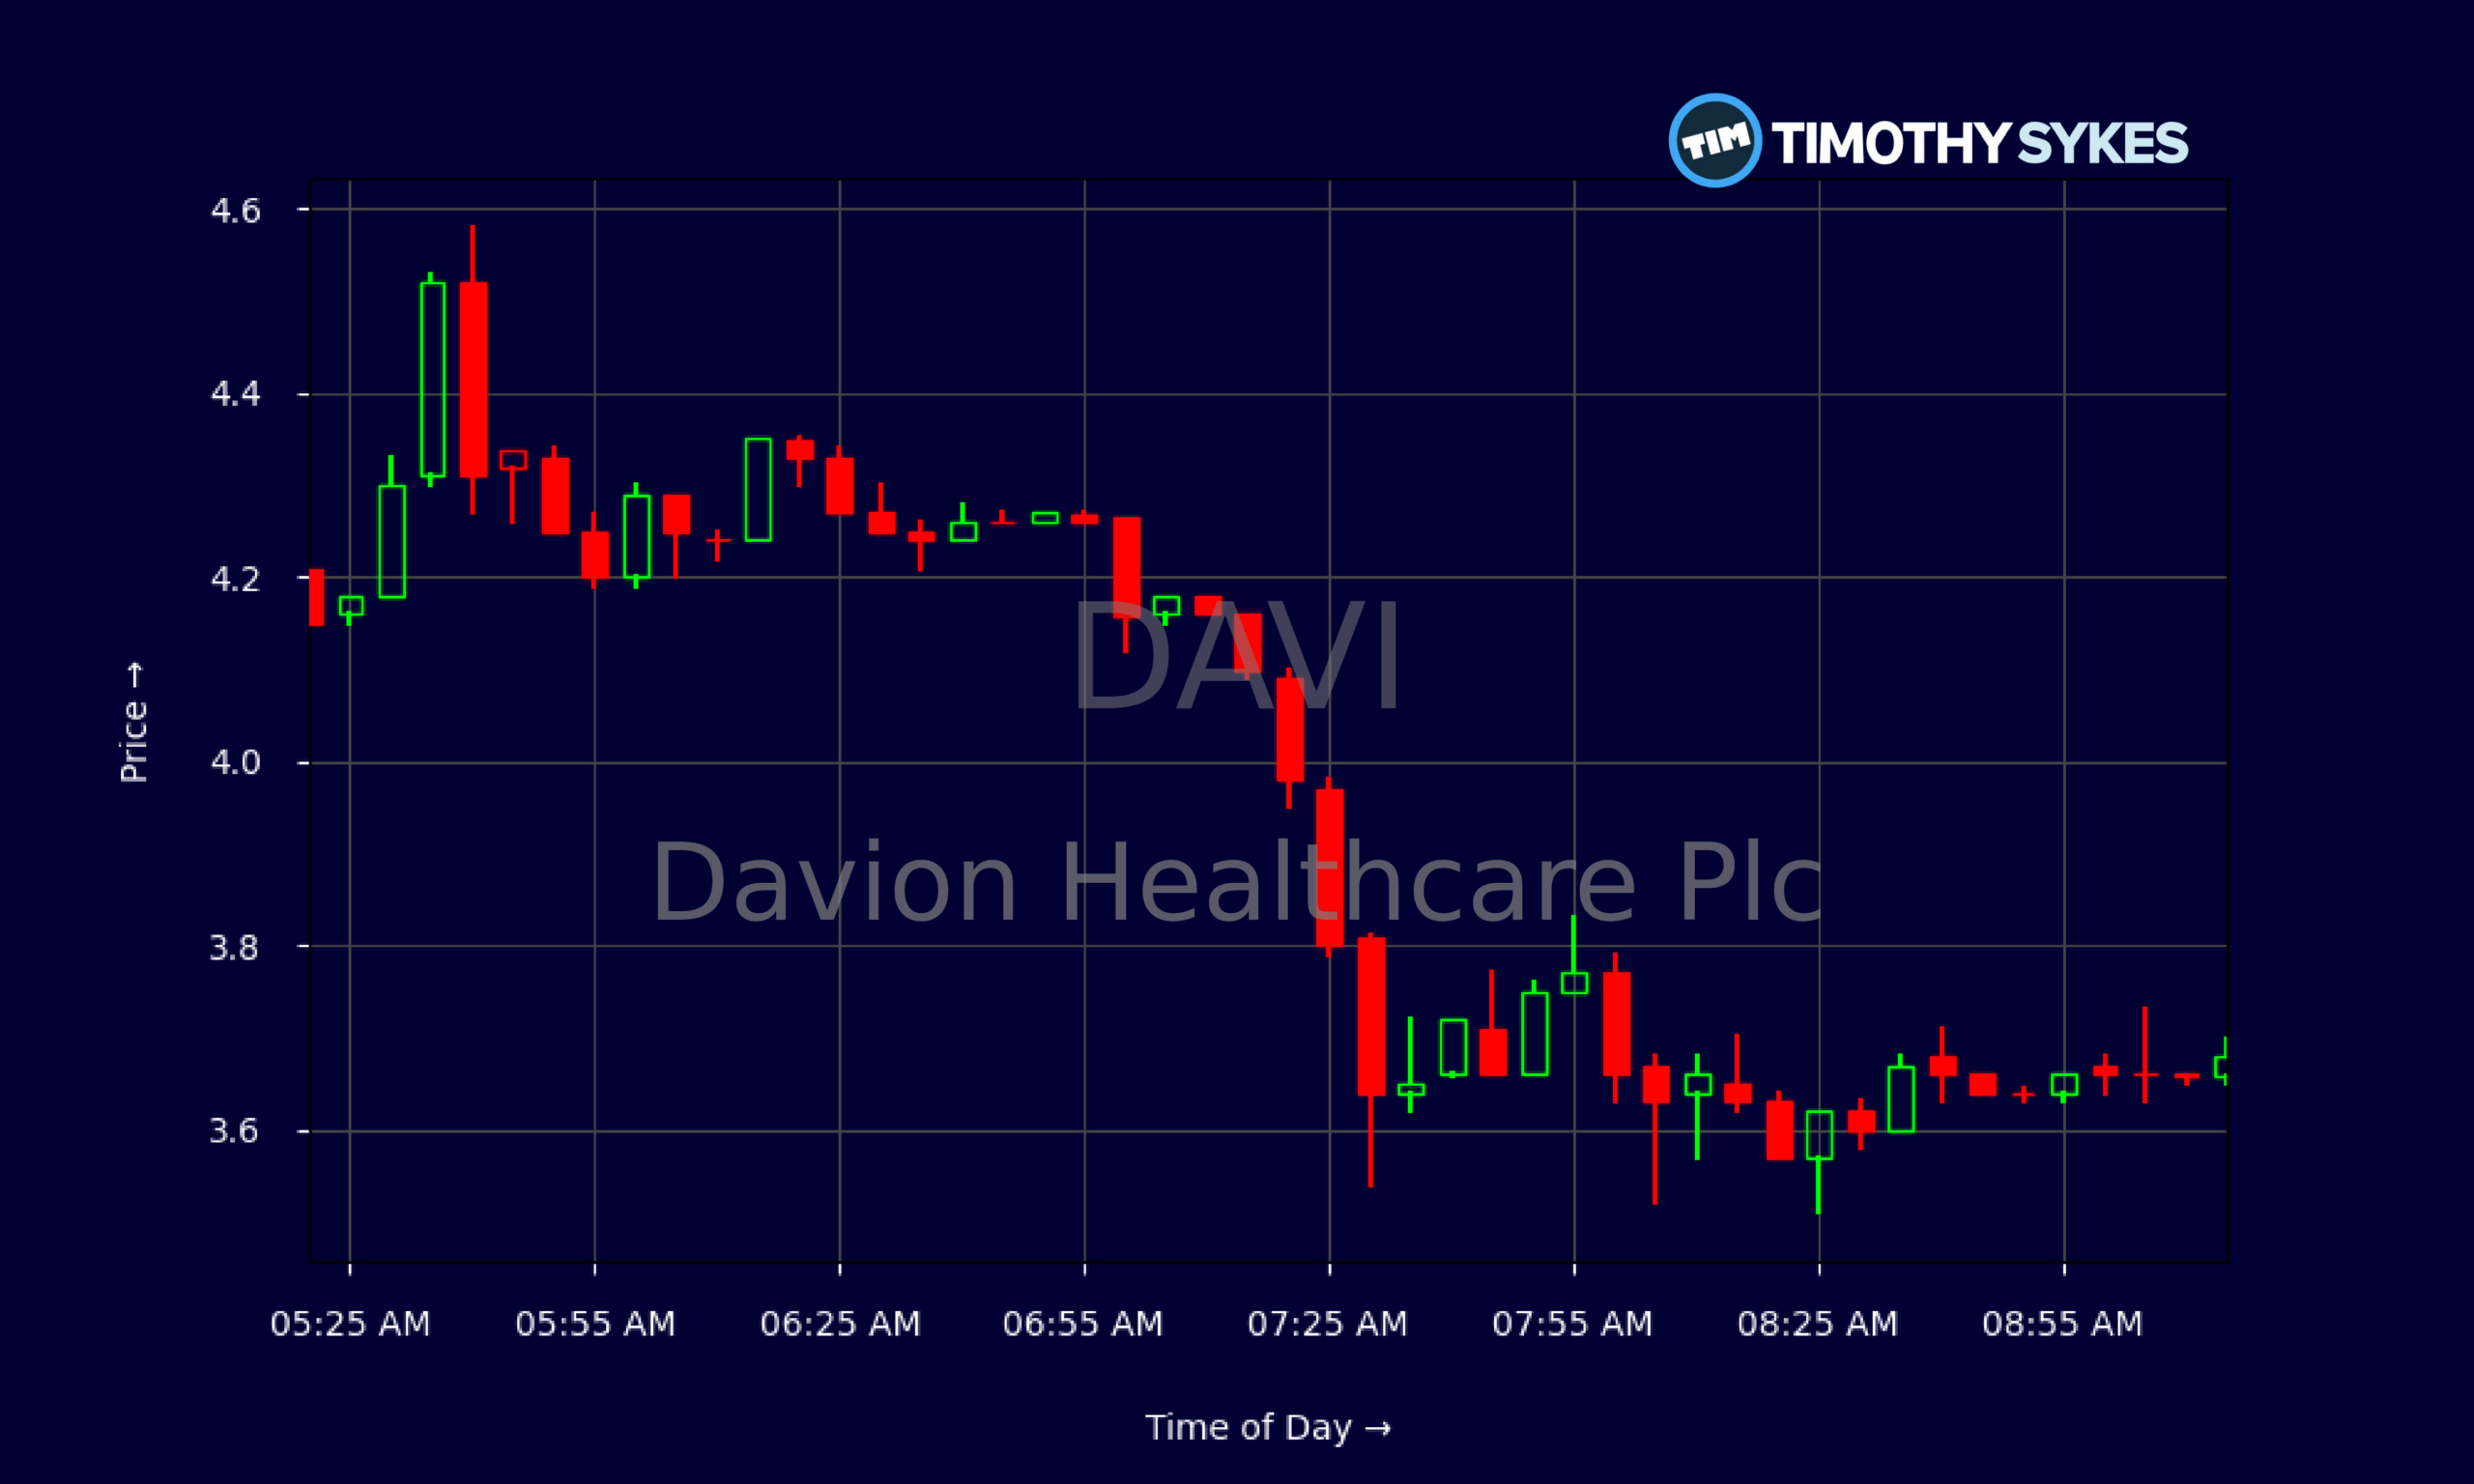
Zoom into the intraday action and you see Davion Healthcare Plc trying to base. Early in the session, DAVI traded around $4.20–$4.60, then steadily slipped, spending much of the later premarket and early regular session between $3.60 and $3.70. The range tightened, volume likely thinned, and the tape started to look like consolidation rather than panic.
For traders, the trade plan often starts with levels. DAVI around $3 is the obvious line in the sand. If that level holds and the stock grinds higher on volume, momentum players may look for a bounce toward prior resistance in the $4–$5 area. If $3 cracks with size and Davion Healthcare Plc fails to reclaim it quickly, the pattern shifts back to a fading pump, where short-biased traders typically press.
Conclusion
DAVI sits at an uncomfortable intersection of shaky fundamentals and explosive price action. Davion Healthcare Plc carries barely any cash, nearly $1M in liabilities, and heavily negative retained earnings. Most of its reported assets are goodwill and other intangibles, which don’t pay bills if the market turns cold. That backdrop matters when a stock runs from the low single digits into the teens and then collapses back toward where it started.
For short-term traders, though, DAVI is a live case study in momentum, liquidity, and risk control. The chart shows a violent spike, a series of lower highs, and now a tight intraday consolidation band. That’s the kind of setup where undisciplined traders often overstay, hoping for a full rebound while the trend still points down. Experienced players treat Davion Healthcare Plc differently — as a teaching tool and a potential trading vehicle, not a long-term bet.
The key is to respect both the chart and the balance sheet. Thin float plus weak financials equals danger if you size too big or refuse to take a loss. As Tim Sykes says, “The patterns repeat, but your job is to manage risk first, profit second.” As millionaire penny stock trader and teacher Tim Sykes, says, “It’s better to go home at zero than to go home in the red.”. DAVI gives traders another chance to apply that mindset in real time — study the moves, plan the trade, and be ready to cut fast if Davion Healthcare Plc fails to hold its key levels.
This is stock news, not investment advice. Timothy Sykes News delivers real-time stock market news focused on key catalysts driving short-term price movements. Our content is tailored for active traders and investors seeking to capitalize on rapid price fluctuations, particularly in volatile sectors like penny stocks. Readers come to us for detailed coverage on earnings reports, mergers, FDA approvals, new contracts, and unusual trading volumes that can trigger significant short-term price action. Some users utilize our news to explain sudden stock movements, while others rely on it for diligent research into potential investment opportunities.
Dive deeper into the world of trading with Timothy Sykes, renowned for his expertise in penny stocks. Explore his top picks and discover the strategies that have propelled him to success with these articles:
- Penny Stocks Trading Guide
- Best Penny Stocks Under $1 to Buy Today
- Top 8 Penny Stocks to Watch on Robinhood
Once you’ve got some stocks on watch, elevate your trading game with StocksToTrade the ultimate platform for traders. With specialized tools for swing and day trading, StocksToTrade will guide you through the market’s twists and turns.
Dig into StocksToTrade’s watchlists here:





Leave a reply