

SoFi Technologies Inc. stocks have been trading up by 2.93 percent amid bullish sentiment on its accelerating financial-services growth.
Key Takeaways
- Q3 numbers from SoFi Technologies smashed expectations, with adjusted EPS at $0.18 vs. $0.17 and revenue at $1.385B vs. $1.26B, confirming strong multi-line execution.
- Management raised its FY26 outlook to $5.04B in revenue, 40% adjusted revenue growth, and higher margin targets, reinforcing a shift toward profitable scale.
- FY27 guidance from SOFI topped Wall Street, pointing to $6.4B revenue and $0.90 adjusted EPS, with roughly mid‑30s EBITDA margins and 20% net margins.
- Shares ripped 10%–15% into the mid‑$16s after the Q3 beat and outlook hike, drawing aggressive momentum trading.
- The launch of SoFi Earn (SOFIE) and an embedded Prudential term-life partnership expand the SOFI product ecosystem and monetization per member.
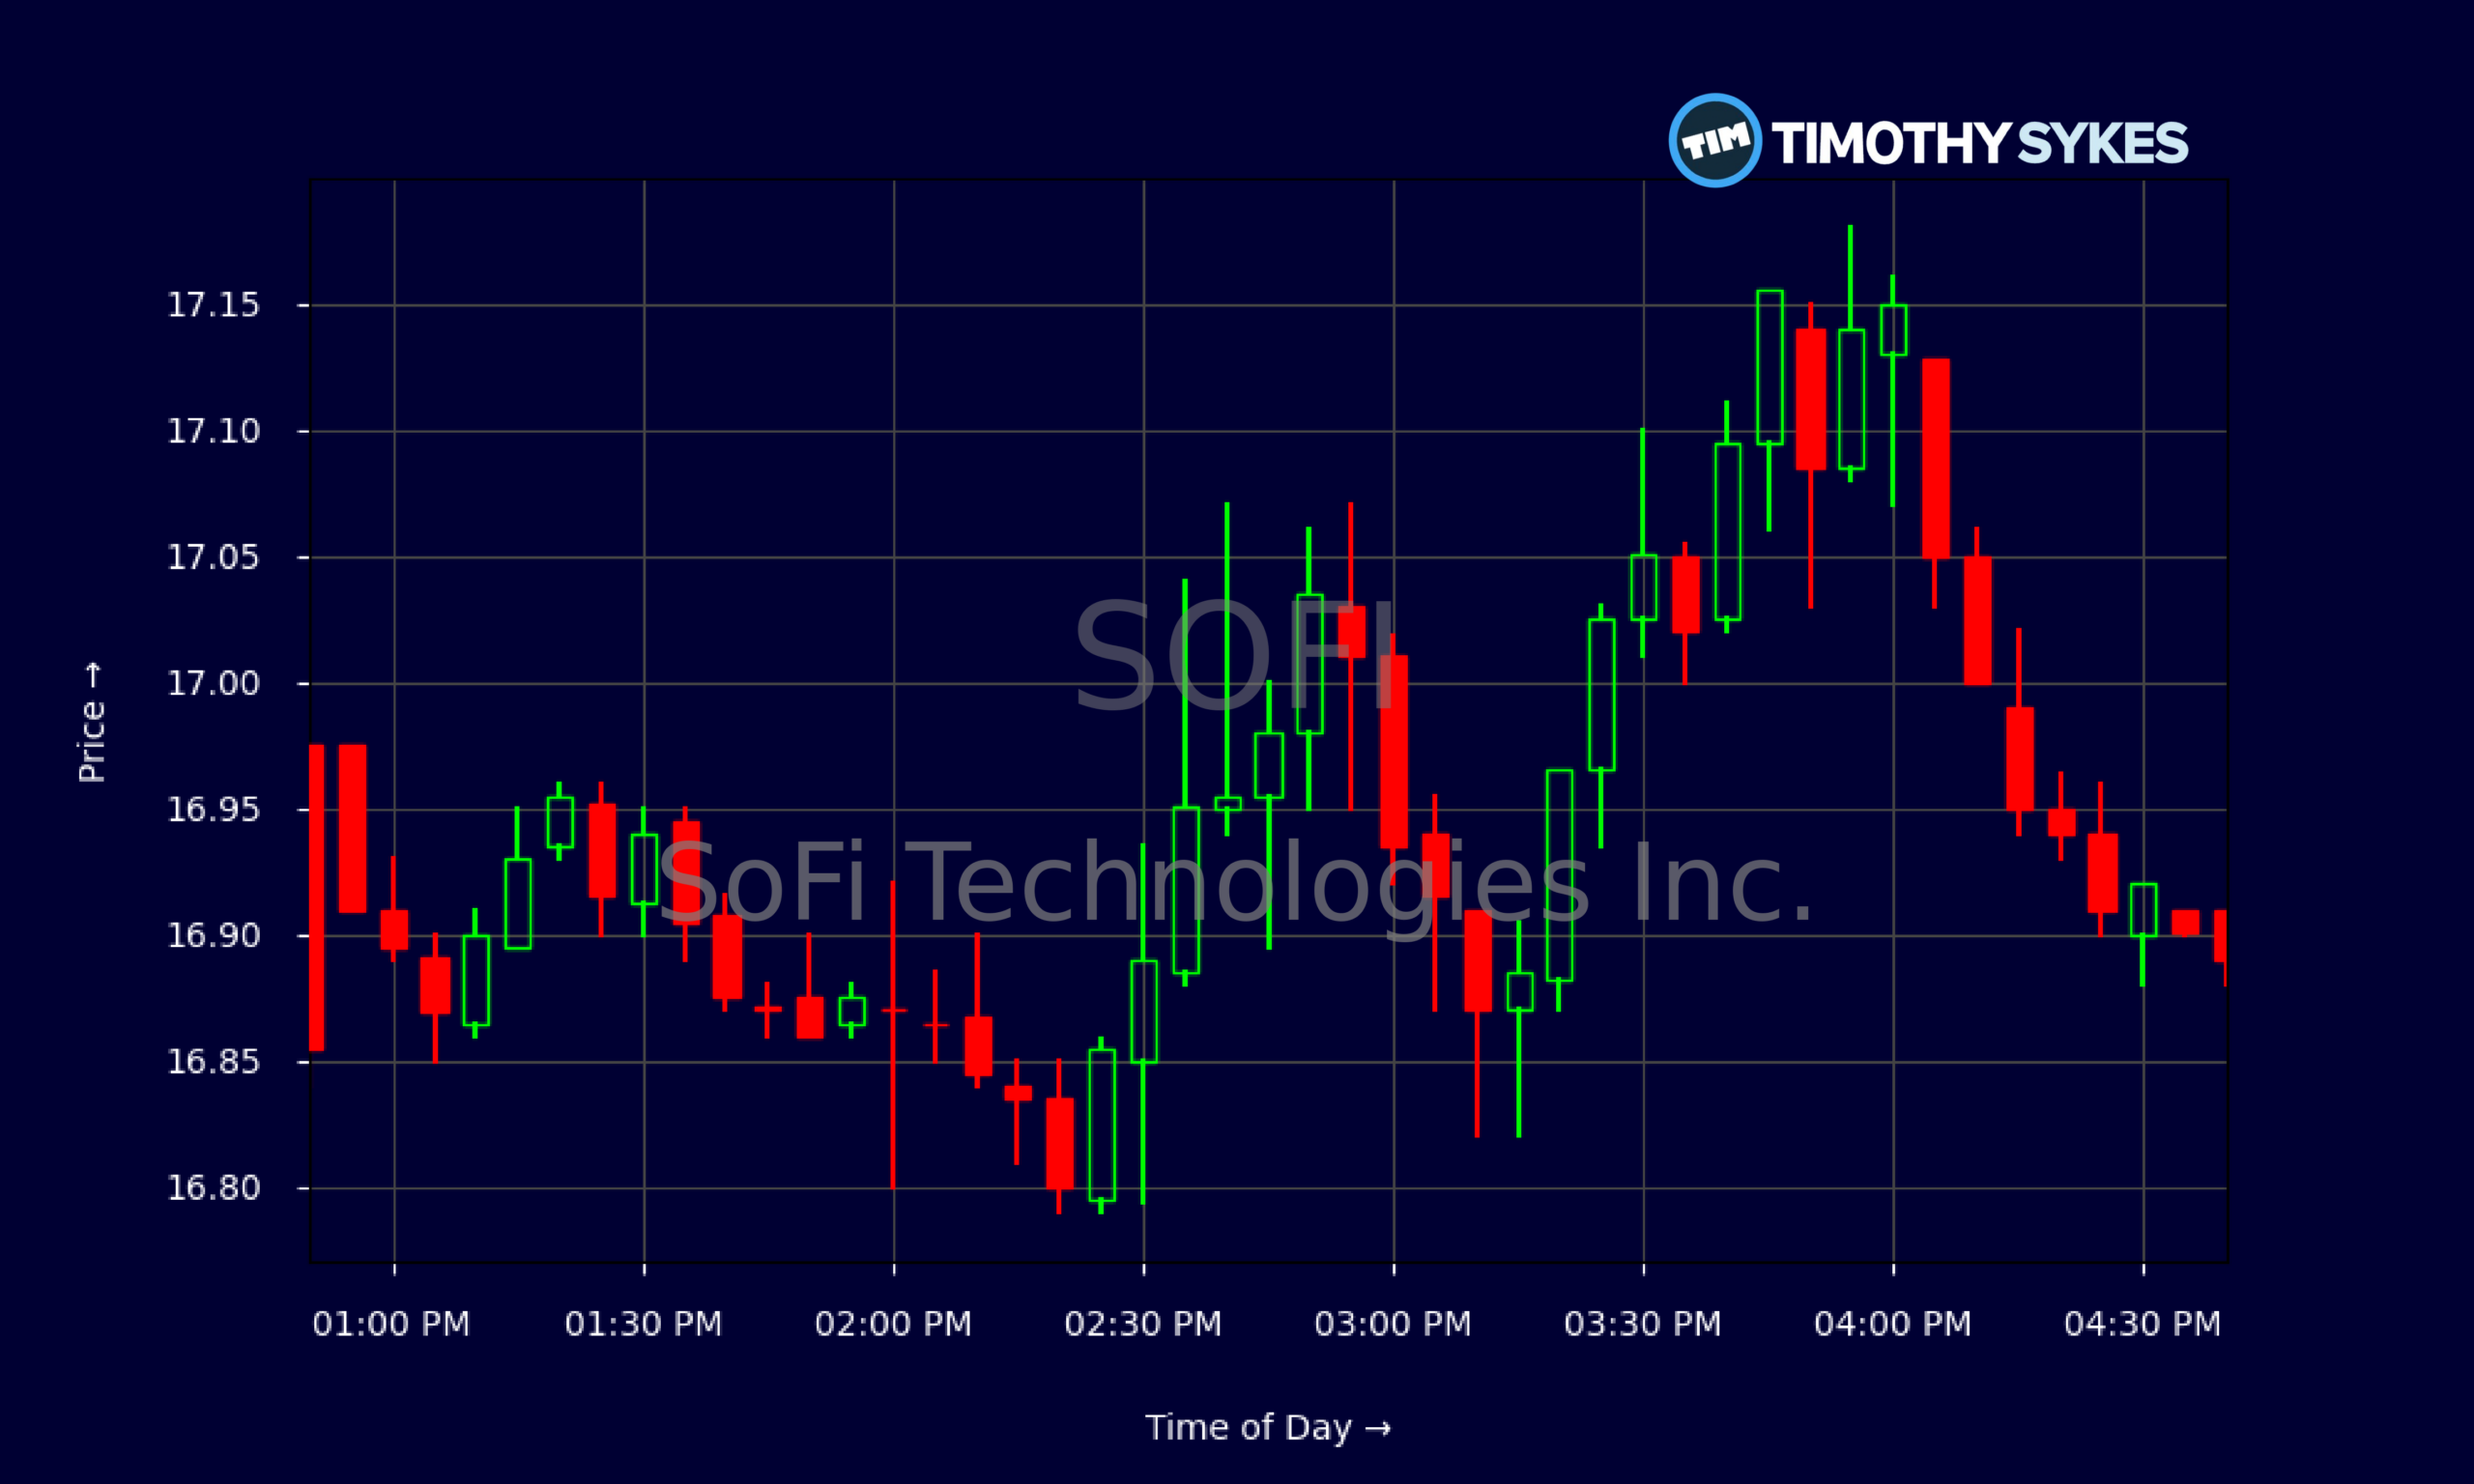
Live Update At 16:46:59 EDT: On Wednesday, October 28, 2026 SoFi Technologies Inc. stock [NASDAQ: SOFI] is trending up by 2.93%! Discover the key drivers behind this movement as well as our expert analysis in the detailed breakdown below.
Quick Financial Overview
SOFI is trading like a momentum name again. The daily chart shows a clean step-up: from $14.46 on 2026/10/26 to $16.40 on 2026/10/27, then to $17.14 on 2026/10/28. That is a powerful two‑day post‑earnings repricing.
Intraday, the 5‑minute tape for SOFI on 2026/10/28 shows tight consolidation between roughly $16.80 and $17.15 for most of the regular session. Dips into the high‑$16s kept getting bought, and the stock closed near the highs. That is classic trend‑day behavior, with traders defending every pullback.
On fundamentals, SoFi Technologies posted trailing revenue of about $3.61B, growing more than 30% annually. A price‑to‑sales ratio near 4.7 prices in growth but not bubble levels for a fintech platform. The forward P/E implied by 2026–2027 guidance is lower than the current 32.24, suggesting the valuation leans on that growth actually showing up.
More Breaking News
Profitability metrics are finally turning. SOFI’s profit margin near 15% and return on equity above 7% signal a maturing bank-style model rather than a cash‑burning startup. Leverage looks controlled with total debt to equity around 0.31, and deposits north of $45B back the lending engine. For active traders, this mix of breakout price action and improving fundamentals justifies keeping SOFI on the momentum watchlist.
Why Traders Are Watching SOFI Now
The latest quarter changed the narrative around SoFi Technologies. Q3 adjusted EPS landed at $0.18 versus $0.17 expected, while revenue came in around $1.385B vs. $1.26B consensus. SOFI is not just growing fast; it is beating numbers that were already optimistic. That matters because traders chase names that repeatedly surprise the Street.
The market reaction tells the story. After the print and guidance, SOFI ripped more than 10% in premarket trading and extended gains during regular hours. One headline flagged a 14.9% surge to $16.62, another highlighted an 11.2% early pop to $16.07. That kind of one‑day expansion in price and volume often pulls in momentum funds, day traders, and options players all at once.
Guidance is where SoFi Technologies really leaned in. For 2026, management now sees $5.04B in adjusted net revenue, 40% adjusted revenue growth, $1.66B in adjusted EBITDA (a 33% margin), and about $840M in adjusted net income (17% margin). For 2027, SOFI is targeting $6.4B revenue, 27% annual growth, with roughly a 35% adjusted EBITDA margin and 20% net margin, plus $0.90 adjusted EPS vs. $0.82 previously expected by the Street. That is a clear profitability ramp, not just a growth story.
Layer on the Monness Crespi & Hardt Buy initiation and $20 price target, broadly in line with the roughly $20 analyst mean, and you have a stock now trading in the mid‑$16s with clearly defined upside in the models most traders follow. For short‑term players, that gap between $16–$17 and $20 becomes a natural magnet as long as the SOFI chart holds higher lows.
Conclusion
For active traders, the SOFI setup right now combines three things you rarely get at once: fresh earnings momentum, bullish long‑term guidance, and visible product innovation. SoFi Technologies has rolled out SoFi Earn, a tokenized deposit (SOFIE) paying 4.40% APY, backed by dollars at SoFi Bank and FDIC‑insured up to standard limits. Users can flip SOFIE 1:1 into SoFiUSD for crypto and blockchain transfers. That keeps SOFI straddling traditional banking and digital assets in a way few regulated players can.
At the same time, the Prudential partnership embeds SimplyTerm life insurance directly inside the SoFi app. Over 15 million members can quote, apply, and often buy term coverage without a medical exam, all in a few taps. For SoFi Technologies, that is new fee and commission revenue layered onto existing banking, lending, and brokerage relationships. Higher revenue per user, lower churn, stronger cross‑sell — that is what the long‑range revenue targets are built on.
The key for traders is discipline. Big moves like this in SOFI often tempt people to chase at any price. As Tim Sykes loves to say, “The market doesn’t owe you anything — protect your capital first, always.” As millionaire penny stock trader and teacher Tim Sykes, says, “Consistency is key in trading; don’t let emotions dictate your trades.”. For those studying this name, that means tracking support levels on the daily chart, watching whether post‑news volume stays elevated, and being ready to cut fast if SOFI breaks its new uptrend. This analysis is for educational and research purposes only, but the message is clear: SOFI has turned itself into a real momentum leader, and serious traders are paying attention.
This is stock news, not investment advice. Timothy Sykes News delivers real-time stock market news focused on key catalysts driving short-term price movements. Our content is tailored for active traders and investors seeking to capitalize on rapid price fluctuations, particularly in volatile sectors like penny stocks. Readers come to us for detailed coverage on earnings reports, mergers, FDA approvals, new contracts, and unusual trading volumes that can trigger significant short-term price action. Some users utilize our news to explain sudden stock movements, while others rely on it for diligent research into potential investment opportunities.
Dive deeper into the world of trading with Timothy Sykes, renowned for his expertise in penny stocks. Explore his top picks and discover the strategies that have propelled him to success with these articles:
- Penny Stocks Trading Guide
- Best Penny Stocks Under $1 to Buy Today
- Top 8 Penny Stocks to Watch on Robinhood
Once you’ve got some stocks on watch, elevate your trading game with StocksToTrade the ultimate platform for traders. With specialized tools for swing and day trading, StocksToTrade will guide you through the market’s twists and turns.
Dig into StocksToTrade’s watchlists here:





Leave a reply