

Itau Unibanco Banco Holding SA stocks have been trading down by -3.19 percent amid heightened concerns over Brazil’s banking outlook.
Key Takeaways
- Price action in ITUB shows a sharp breakdown from the $10 area into the mid-$7s, putting recent buyers underwater.
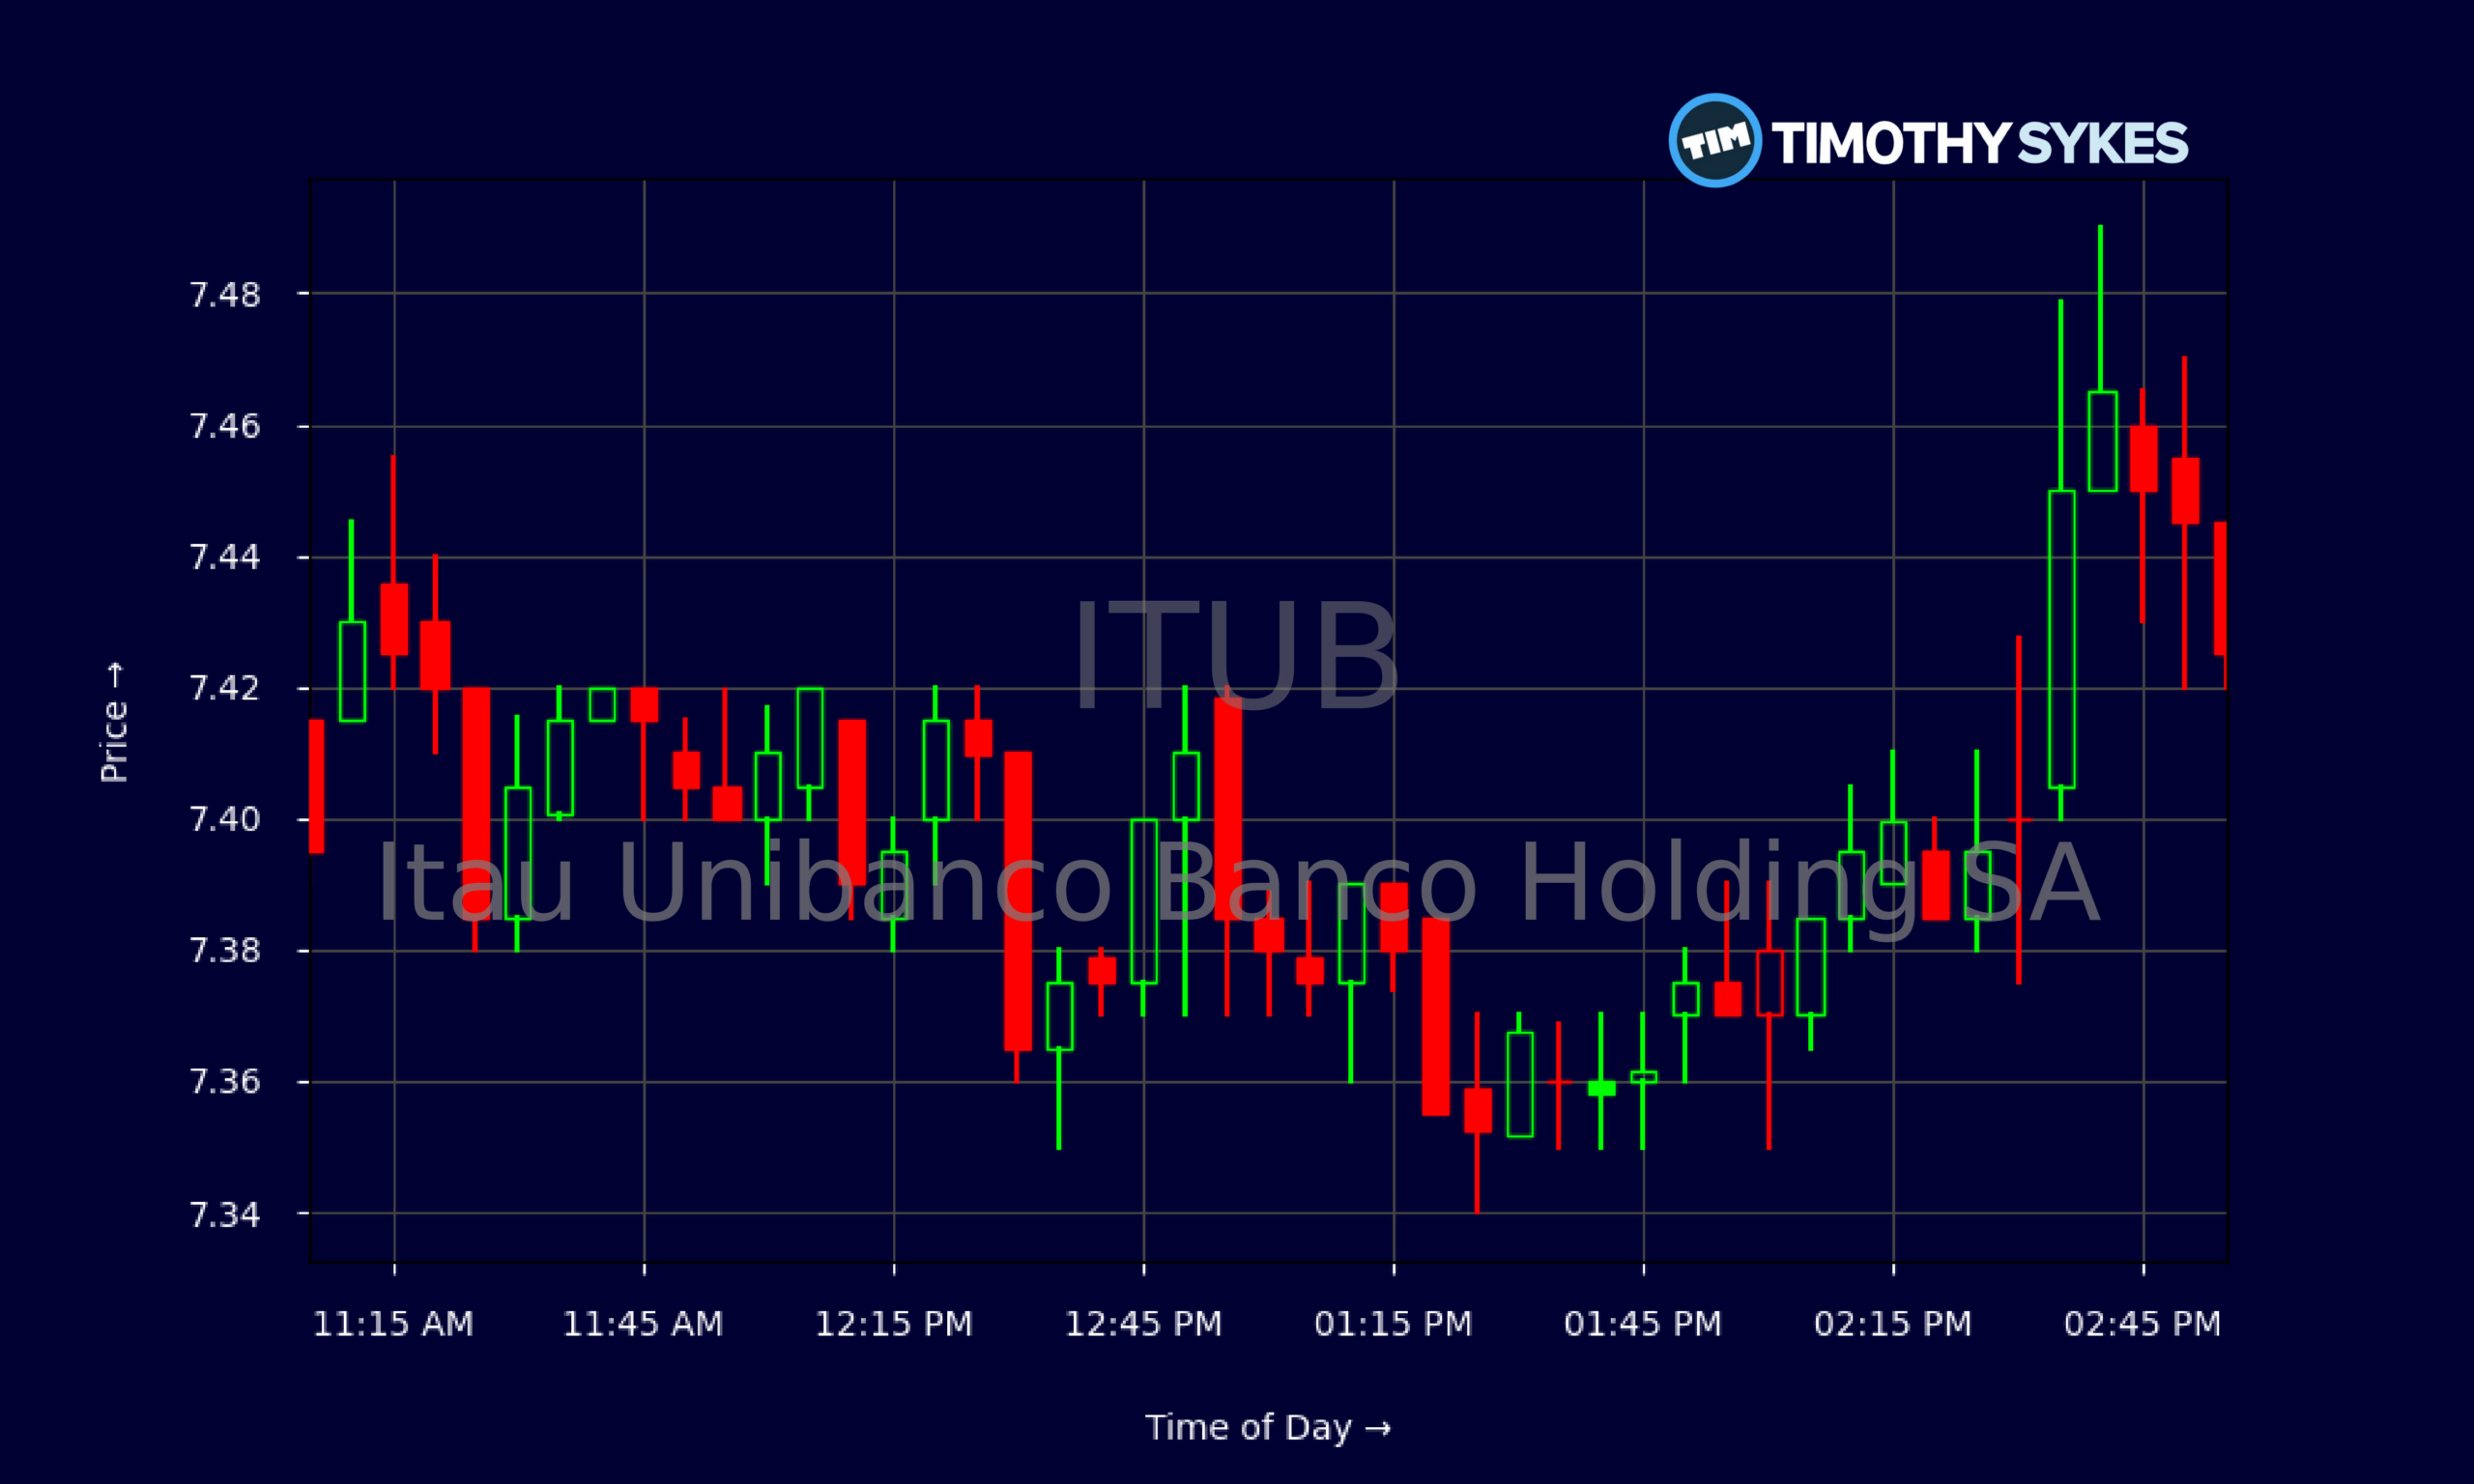
- Intraday trading in ITUB is stuck in a tight range around $7.40, signaling consolidation after heavy selling.
- Profitability at Itau Unibanco Banco Holding SA remains solid, with pretax margins above 25%, even as the stock pulls back.
- Leverage is high, but ITUB’s asset base and deposits are massive, keeping the bank firmly in the “too-important-to-ignore” bucket for traders.
Live Update At 15:02:31 EDT: On Wednesday, October 28, 2026 Itau Unibanco Banco Holding SA stock [NYSE: ITUB] is trending down by -3.19%! Discover the key drivers behind this movement as well as our expert analysis in the detailed breakdown below.
Quick Financial Overview
ITUB is a big bank, and the numbers prove it. Itau Unibanco Banco Holding SA shows total assets of about $3,066.2B and total deposits around $1,114.8B. That is serious scale. For active traders, size matters because it usually means deep liquidity and tighter spreads.
On the income side, ITUB booked roughly $215.8B in revenue with a pretax profit margin of 26.5%. In plain English, the bank keeps more than a quarter of its revenue as profit before taxes. That is strong for any financial name. A price-to-earnings ratio of 12.97 and price-to-sales around 2.66 place ITUB in “reasonably valued” territory, not some hyped-up momentum bubble.
More Breaking News
The leverage ratio near 15 tells traders this is a classic highly levered bank model, but with equity of about $204.5B backing it. Book value per share sits at 18.55, well above the current single‑digit share price. For chart‑driven traders, that gap between book value and market price helps frame just how discounted sentiment has become around ITUB right now.
Why Traders Are Watching ITUB Price Action
Look at the daily chart and ITUB jumps out. Earlier in the period, Itau Unibanco Banco Holding SA was trading near $10–$10.20. Then the floor gave way. Over roughly two weeks, ITUB slid from that zone down into the mid‑$7s, closing most recently around $7.43. That is a steep pullback of roughly 25% from the recent highs, fast enough to force weak hands out and wake up short‑biased traders.
The daily candles tell a clear story: after grinding around $9.50–$10, ITUB broke lower and has not bounced with any real strength yet. The gap between the $9.50s and $7s is where trapped longs sit. Many of them are now down big, and that psychological pressure often caps any near‑term rallies as they rush to exit on pops.
Zoom into the intraday 5‑minute chart and the tone shifts from panic to pause. ITUB spent most of the session chopping between about $7.35 and $7.47. The candles are tight, with repeated closes near $7.40–$7.42. That is classic consolidation after a strong move down. Traders in the Tim Sykes community watch this pattern all the time: big slide, then sideways churn as the market decides the next leg.
If ITUB cracks cleanly below the $7.30 low area on volume, momentum traders will treat it as a breakdown continuation. On the flip side, a push back through $7.60–$7.70 with range expansion could mark the start of a short squeeze toward the $8s. The key for day traders is to respect those levels, wait for range breaks, and avoid getting chopped up inside the midday noise.
Conclusion
ITUB sits at a crossroads where fundamentals and charts are telling very different stories. On the one hand, Itau Unibanco Banco Holding SA is a highly profitable banking giant with over $3,000B in assets, more than $1,100B in deposits, and pretax margins north of 25%. The balance sheet shows massive loans, securities, and cash, supported by more than $200B of common equity. On paper, that looks like a powerhouse, not a penny stock.
On the other hand, the market does not care about the story right now. It cares about price. ITUB has been crushed from roughly $10 to the mid‑$7s and is consolidating near the lows. That is where emotions spike and opportunity appears for disciplined traders. Breakdowns, failed bounces, and sharp relief rallies are all on the table as liquidity rotates. This is precisely where patience and discipline matter most; as millionaire penny stock trader and teacher Tim Sykes, says, “There is always another play around the corner; don’t chase just because you feel FOMO.” Keeping that in mind can help traders wait for clean setups instead of forcing trades in choppy action.
Traders studying ITUB should mark the recent intraday range around $7.35–$7.47 and the higher daily zone near $9.50–$10 as key reference points. The space between them is pure air. As Tim Sykes likes to say, “The chart is the only truth that matters in the short term.” Use that mindset here: respect the trend, keep risk tight, and let the price action in ITUB, not hope, drive every trading decision.
This is stock news, not investment advice. Timothy Sykes News delivers real-time stock market news focused on key catalysts driving short-term price movements. Our content is tailored for active traders and investors seeking to capitalize on rapid price fluctuations, particularly in volatile sectors like penny stocks. Readers come to us for detailed coverage on earnings reports, mergers, FDA approvals, new contracts, and unusual trading volumes that can trigger significant short-term price action. Some users utilize our news to explain sudden stock movements, while others rely on it for diligent research into potential investment opportunities.
Dive deeper into the world of trading with Timothy Sykes, renowned for his expertise in penny stocks. Explore his top picks and discover the strategies that have propelled him to success with these articles:
- Penny Stocks Trading Guide
- Best Penny Stocks Under $1 to Buy Today
- Top 8 Penny Stocks to Watch on Robinhood
Once you’ve got some stocks on watch, elevate your trading game with StocksToTrade the ultimate platform for traders. With specialized tools for swing and day trading, StocksToTrade will guide you through the market’s twists and turns.
Dig into StocksToTrade’s watchlists here:





Leave a reply