

Medical Properties Trust Inc. stocks have been trading down by -7.8 percent after alarming liquidity and tenant-risk concerns resurfaced.
Key Takeaways
- Price action shows Medical Properties Trust Inc. sliding from the $3.20s to near $2.00, signaling sustained selling pressure in MPT.
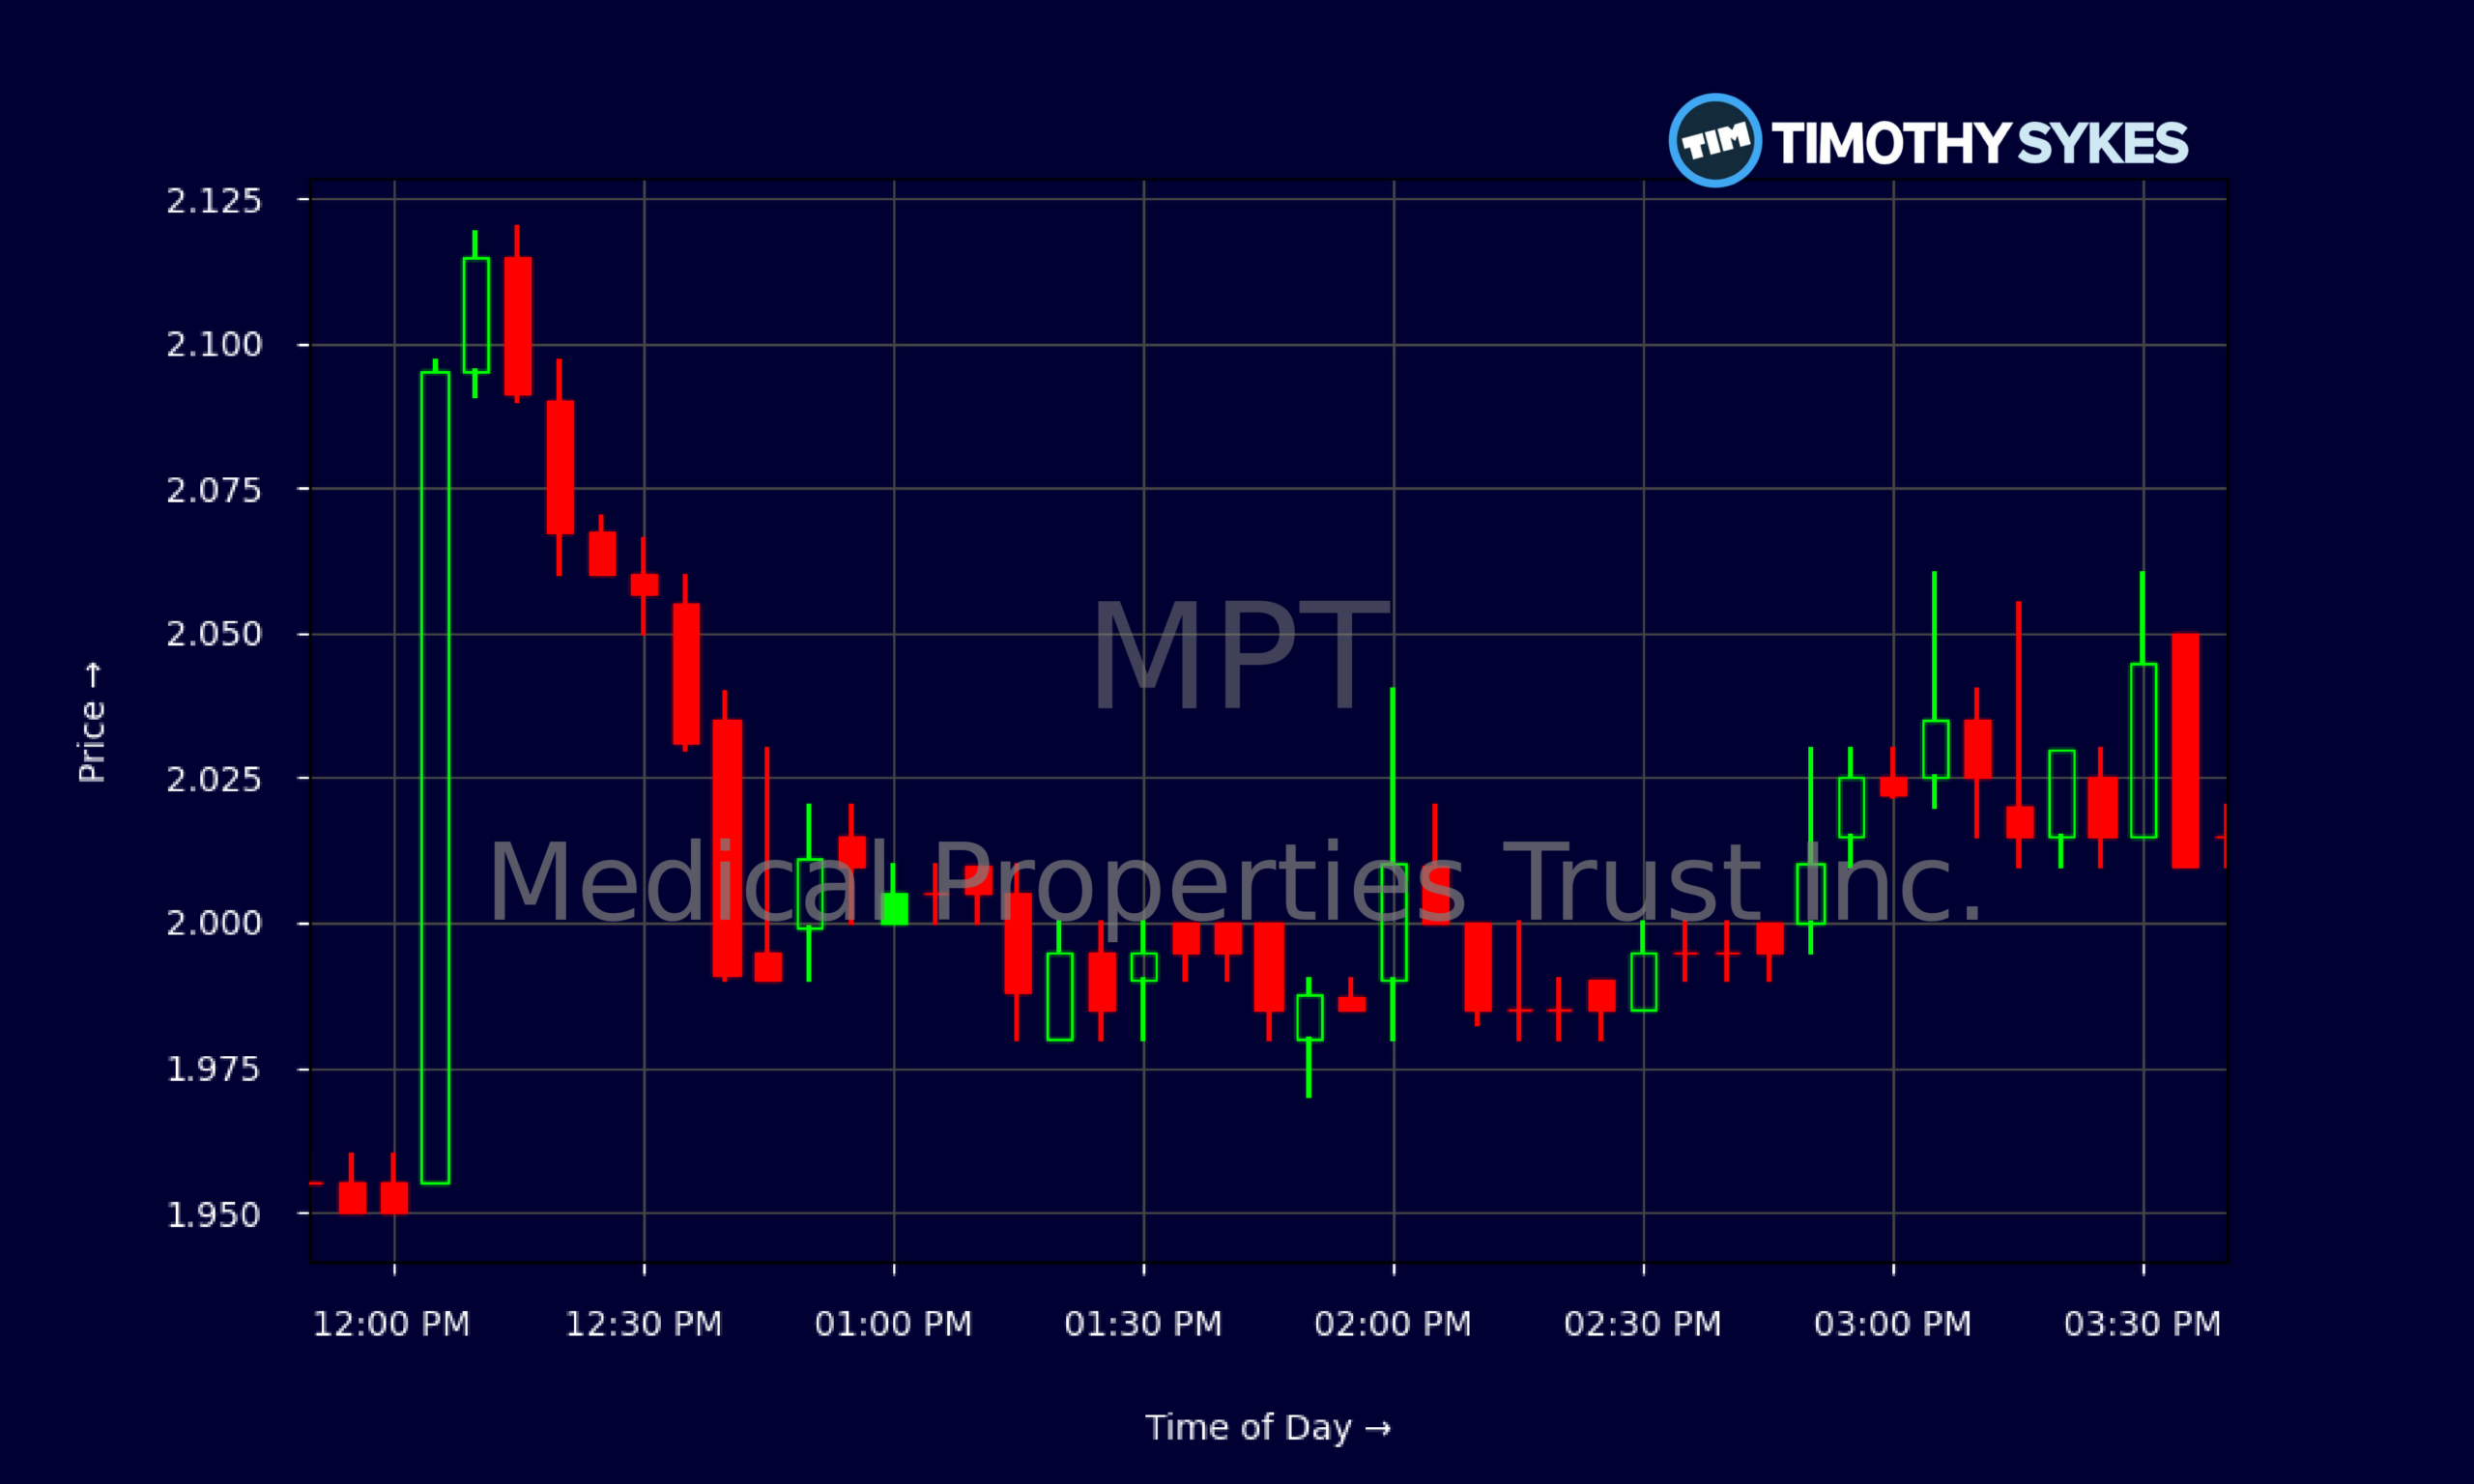
- Intraday trading around $2.00 has tightened into a narrow range, hinting at a possible base-building zone for MPT.
- Financials show MPT with roughly $396.6M in cash versus heavy long-term debt above $8.9B, keeping leverage front and center.
- Despite solid operating cash flow, MPT posts a small net loss, reminding traders that earnings quality still matters.
- Valuation ratios place MPT well below book value, which can attract bargain hunters but also reflect real balance-sheet risk.
Live Update At 15:46:53 EST: On Tuesday, November 03, 2026 Medical Properties Trust Inc. stock [NYSE: MPT] is trending down by -7.8%! Discover the key drivers behind this movement as well as our expert analysis in the detailed breakdown below.
Quick Financial Overview
Medical Properties Trust Inc. is a classic “broken-down chart meets heavy balance sheet” story that active traders love to study. MPT pulled total revenue of about $972.0M over the last year, but revenue trends are sliding, with multi‑year declines in the low double digits. Profit margins tell the real story: operating metrics look strong on paper, yet bottom‑line profit is negative.
MPT shows a gross margin near 97%, which is typical for a real estate landlord model. But once interest expense and other charges hit, profit margin flips to a small loss. The latest quarterly numbers show total revenue around $259.3M with EBITDA of roughly $230.2M, yet net income is still slightly negative. That gap between EBITDA and true earnings is what traders should study.
More Breaking News
On the balance sheet, MPT carries about $14.7B in assets and roughly $10.2B in total liabilities. Long‑term debt is close to $8.99B, driving a debt‑to‑equity ratio above 2.0 and interest coverage near 1.0. Cash stands around $396.6M, with free cash flow for the recent quarter near $62.4M. For traders, that combination means MPT has runway, but not much room for big mistakes.
Why Traders Are Watching MPT Price Action
The chart on Medical Properties Trust Inc. is a clean example of steady downtrend turning into a possible consolidation. Over the last several weeks, MPT has dropped from closes above $3.10 down toward $2.00. The stock has slipped from a high near $3.20 to a recent close just over $2.01, a drawdown of roughly one‑third. That kind of slide always gets short‑term traders interested.
Daily candles show a series of lower highs: $3.20s, then $3.10s, then $2.90s, then $2.70s, and now the $2.10–$2.20 area. Every bounce has been sold into. That is textbook downtrend behavior, telling trend traders to be careful with long entries and forcing dip buyers to stay disciplined. MPT is now testing the low $2.00 range, with a low print near $1.95 in the latest session.
Zoom in to the intraday 5‑minute chart and MPT trades like a coiled spring. After the open around $2.15–$2.19, the stock faded steadily toward $1.95 by midday. From there, it churned between roughly $1.98 and $2.05 all afternoon. That tight band shows neither side in full control. Short sellers are locking gains; bottom fishers are quietly soaking up shares; scalpers are clipping pennies inside the range.
For active traders, this is the homework zone. MPT offers volatility, defined levels, and a clear trend. The key questions now: does $1.95 hold as support, and does any push above $2.20 bring real volume, or just another lower high to short into?
Conclusion
Medical Properties Trust Inc. sits at a crossroads where fundamentals and price action both matter. On one side, MPT trades at a steep discount to its reported book value of about $7.53 per share, with a price‑to‑book ratio near 0.42. That kind of discount often attracts value‑oriented traders who like beaten‑down names. On the other side, leverage is heavy, interest coverage is thin, and net income is still negative despite strong EBITDA and high gross margins.
The cash‑flow picture gives MPT some breathing room. The company generated operating cash flow of roughly $62.4M in the latest quarter and ended with nearly $399.4M in cash. But long‑term debt close to $9.0B keeps pressure on management to keep properties productive and financing flexible. Any slip in rental revenues or funding costs would show up fast on the income statement and, by extension, on the chart.
For now, MPT traders are left with a simple playbook: respect the downtrend, map the key levels, and let price confirm any thesis. The $1.95 area is the line in the sand on the downside, while the $2.20–$2.40 zone is the next key resistance band overhead. As Tim Sykes likes to say, “The market doesn’t care about your opinion, only about price and volume.” As millionaire penny stock trader and teacher Tim Sykes, says, “Cut losses quickly, let profits ride, and don’t overtrade.”. With Medical Properties Trust Inc., that means studying every tick, cutting losses fast, and letting the chart—not hope—drive your trading plan.
This is stock news, not investment advice. Timothy Sykes News delivers real-time stock market news focused on key catalysts driving short-term price movements. Our content is tailored for active traders and investors seeking to capitalize on rapid price fluctuations, particularly in volatile sectors like penny stocks. Readers come to us for detailed coverage on earnings reports, mergers, FDA approvals, new contracts, and unusual trading volumes that can trigger significant short-term price action. Some users utilize our news to explain sudden stock movements, while others rely on it for diligent research into potential investment opportunities.
Dive deeper into the world of trading with Timothy Sykes, renowned for his expertise in penny stocks. Explore his top picks and discover the strategies that have propelled him to success with these articles:
- Penny Stocks Trading Guide
- Best Penny Stocks Under $1 to Buy Today
- Top 8 Penny Stocks to Watch on Robinhood
Once you’ve got some stocks on watch, elevate your trading game with StocksToTrade the ultimate platform for traders. With specialized tools for swing and day trading, StocksToTrade will guide you through the market’s twists and turns.
Dig into StocksToTrade’s watchlists here:





Leave a reply