

Nextpower Inc. stocks have been trading up by 14.57 percent following strong investor optimism over its latest renewable energy expansion.
Key Takeaways
- NXT smashed Q2 expectations, with adjusted EPS of $1.31 versus $1.10 and record revenue, bookings, and a backlog now above $6B, signaling strong demand across its solar platform.
- Management lifted fiscal 2027 EPS guidance to $4.61–$4.87 and revenue to $4.20B–$4.45B, both ahead of prior ranges and above Wall Street’s consensus for NXT.
- Record Q2 for Nextpower was driven by acquisitions plus fast-growing energy storage, eBOS, and inverter deals, even as the company warned of near-term margin pressure from higher input costs and integration expenses.
- Major banks like Susquehanna, JPMorgan, UBS, Citi, Deutsche Bank, and RBC cut price targets but kept Positive/Buy/Overweight/Outperform ratings on NXT, citing strong backlog growth and long-term earnings power.
- Citi highlighted that negative sentiment toward renewables contrasts with robust real-world demand, reinforcing the fundamental long-term case around Nextpower and the NXT ticker.
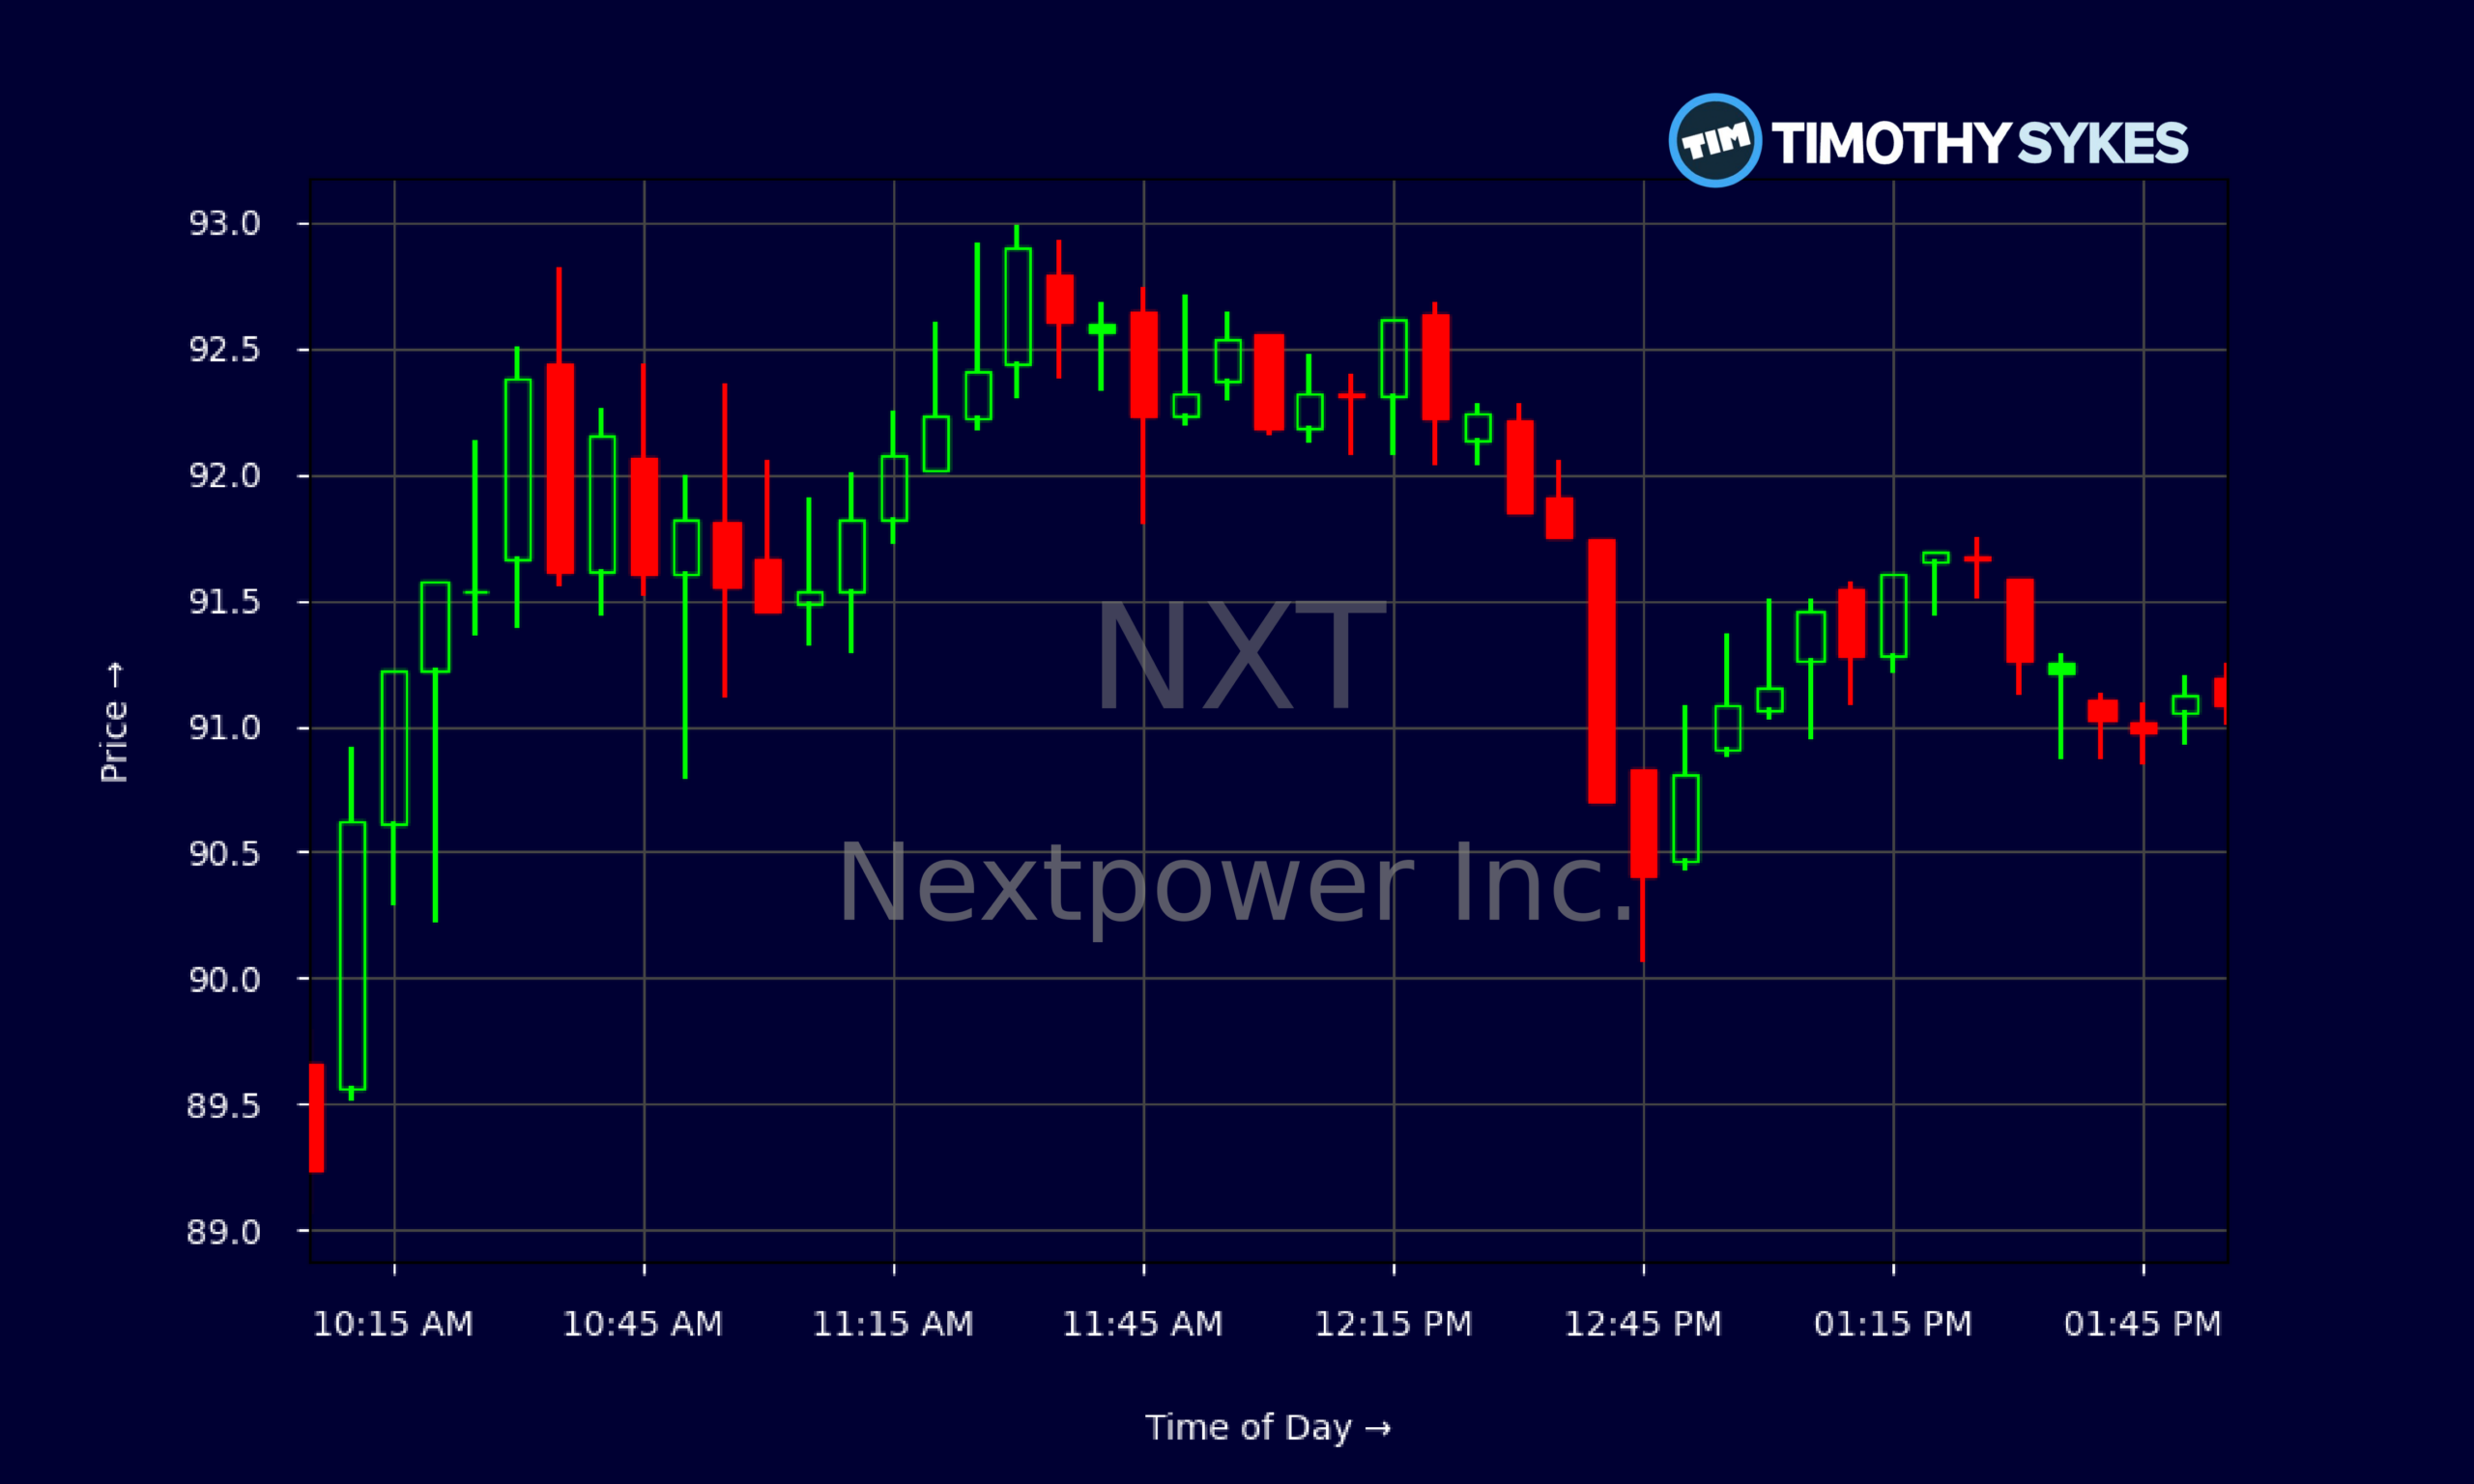
Live Update At 14:02:34 EST: On Monday, November 02, 2026 Nextpower Inc. stock [NASDAQ: NXT] is trending up by 14.57%! Discover the key drivers behind this movement as well as our expert analysis in the detailed breakdown below.
Quick Financial Overview
NXT is trading like a momentum name again. Over the past few weeks, Nextpower shares have climbed from the mid-$70s to close near $90.91 on 2026/11/02. That’s a sharp bounce after a choppy October tape for solar and renewables.
The daily chart shows NXT grinding higher with higher lows from around $76–$77 up to the low $80s, then accelerating after the Q2 beat and raised 2027 guidance. Intraday, the 5‑minute chart prints a strong trend day: a gap up from the low $80s, heavy volume early, and a steady push into the low $90s with only shallow pullbacks. That is classic momentum behavior, the kind of action short-term traders love to see.
Under the hood, Nextpower’s fundamentals back the move. Revenue sits around $3.56B with revenue growth above 50% over three years. NXT runs gross margins near 33.5% and EBITDA margins around 19%, strong for hardware-heavy solar. Returns on equity and capital are high, while debt metrics look conservative, with solid liquidity and no heavy leverage.
More Breaking News
For traders, that combo – clean balance sheet, expanding earnings, and a strong chart – often supports dip-buying strategies, with risk defined against recent support zones rather than chasing emotional spikes.
Why Traders Are Watching NXT After The Q2 Shock
Nextpower just delivered the kind of quarter that wakes up a sleepy ticker. NXT didn’t only beat Q2 numbers; it crushed them. Adjusted EPS came in at $1.31 versus the $1.10 FactSet consensus. On top of that, the company posted record quarterly revenue and bookings and pushed its backlog over $6B. For traders, that backlog matters. It’s future revenue already lined up.
What’s driving it? NXT is no longer just a solar tracker story. Nextpower is seeing fast growth from energy storage, eBOS, and inverter agreements. That means a broader, more integrated platform tied to the buildout of utility-scale solar and grid infrastructure. More products per project usually equal better revenue per customer and stickier relationships.
Management backed up the beat with a bold 2027 outlook. NXT now guides fiscal 2027 adjusted EPS to $4.61–$4.87 and revenue to $4.20B–$4.45B, both above prior ranges and above current Street models. That tells traders one thing: the company itself thinks the runway is longer and steeper than analysts were modeling.
Wall Street is still on board, even as targets reset. Susquehanna, JPMorgan, UBS, Citi, Deutsche Bank, and RBC all tweaked price targets – many lower – but they kept ratings like Positive, Buy, Overweight, and Outperform on NXT. RBC talked about record Q2 earnings and the $6B+ backlog backing a $116 target versus a prior $81 handle on the stock. UBS still leans bullish, seeing long-term earnings upside from Nextpower’s M&A push into adjacent products and from on-shoring policies.
There are caveats. Management flagged near-term margin pressure from higher input costs and integration spending. JPMorgan also warned of possible order timing issues around potential Section 232 tariffs on renewables. For active traders, those are the catalysts that can create volatility and sharp intraday swings, even in a longer-term uptrend.
Conclusion
For NXT, this is what a “good problem” quarter looks like. Nextpower is growing fast, with record Q2 earnings, a backlog above $6B, and 2027 guidance that tops Wall Street. At the same time, the company is juggling inflation, integration costs from acquisitions, and policy risk around tariffs. That’s why price targets are bending while ratings stay bullish.
Analysts on average still rate NXT Overweight or Buy, with mean targets well above the recent ~$90 print and, in some cases, comparing against earlier prices near $78–$81. That gap between current price and Street targets shows how much upside traditional models still see if Nextpower executes on its integrated solar and storage strategy. For traders, that kind of disconnect often creates a fertile hunting ground – but only with tight risk management and a clear plan.
The balance sheet and key ratios show NXT as a quality growth story, not a lottery ticket. Strong returns on equity, high interest coverage, and solid liquidity give Nextpower room to keep scaling, even through short-term margin noise. Price action confirms that institutions are reacting to the story. The trend is up, with rising support levels and strong intraday demand on green days.
This is where the Sykes-style approach matters. As Tim Sykes loves to remind traders, “The market doesn’t care about your opinion, only your discipline.” As millionaire penny stock trader and teacher Tim Sykes, says, “Preparation plus patience leads to big profits.”. For anyone trading NXT, that means respecting support and resistance, cutting losses fast if the thesis breaks, and letting the data – earnings, guidance, and the chart – lead the way, not emotions.
This is stock news, not investment advice. Timothy Sykes News delivers real-time stock market news focused on key catalysts driving short-term price movements. Our content is tailored for active traders and investors seeking to capitalize on rapid price fluctuations, particularly in volatile sectors like penny stocks. Readers come to us for detailed coverage on earnings reports, mergers, FDA approvals, new contracts, and unusual trading volumes that can trigger significant short-term price action. Some users utilize our news to explain sudden stock movements, while others rely on it for diligent research into potential investment opportunities.
Dive deeper into the world of trading with Timothy Sykes, renowned for his expertise in penny stocks. Explore his top picks and discover the strategies that have propelled him to success with these articles:
- Penny Stocks Trading Guide
- Best Penny Stocks Under $1 to Buy Today
- Top 8 Penny Stocks to Watch on Robinhood
Once you’ve got some stocks on watch, elevate your trading game with StocksToTrade the ultimate platform for traders. With specialized tools for swing and day trading, StocksToTrade will guide you through the market’s twists and turns.
Dig into StocksToTrade’s watchlists here:




Leave a reply