

Leverage Shares 2X Long SNDK Daily ETF stocks have been trading down by -17.81 percent amid sharply negative sentiment.
Key Takeaways
- Leverage Shares 2X Long SNDK Daily ETF has dropped sharply from early-month highs, signaling a momentum shift that active traders cannot ignore.
- Recent daily candles in SNDG show wide trading ranges and heavy reversals, a classic setup for short-term breakout and fade strategies.
- Intraday SNDG price action now reflects tighter consolidation, hinting that traders are waiting for the next big move.
- With no earnings or balance sheet metrics, SNDG trading is driven almost entirely by technicals and underlying SNDK sentiment.
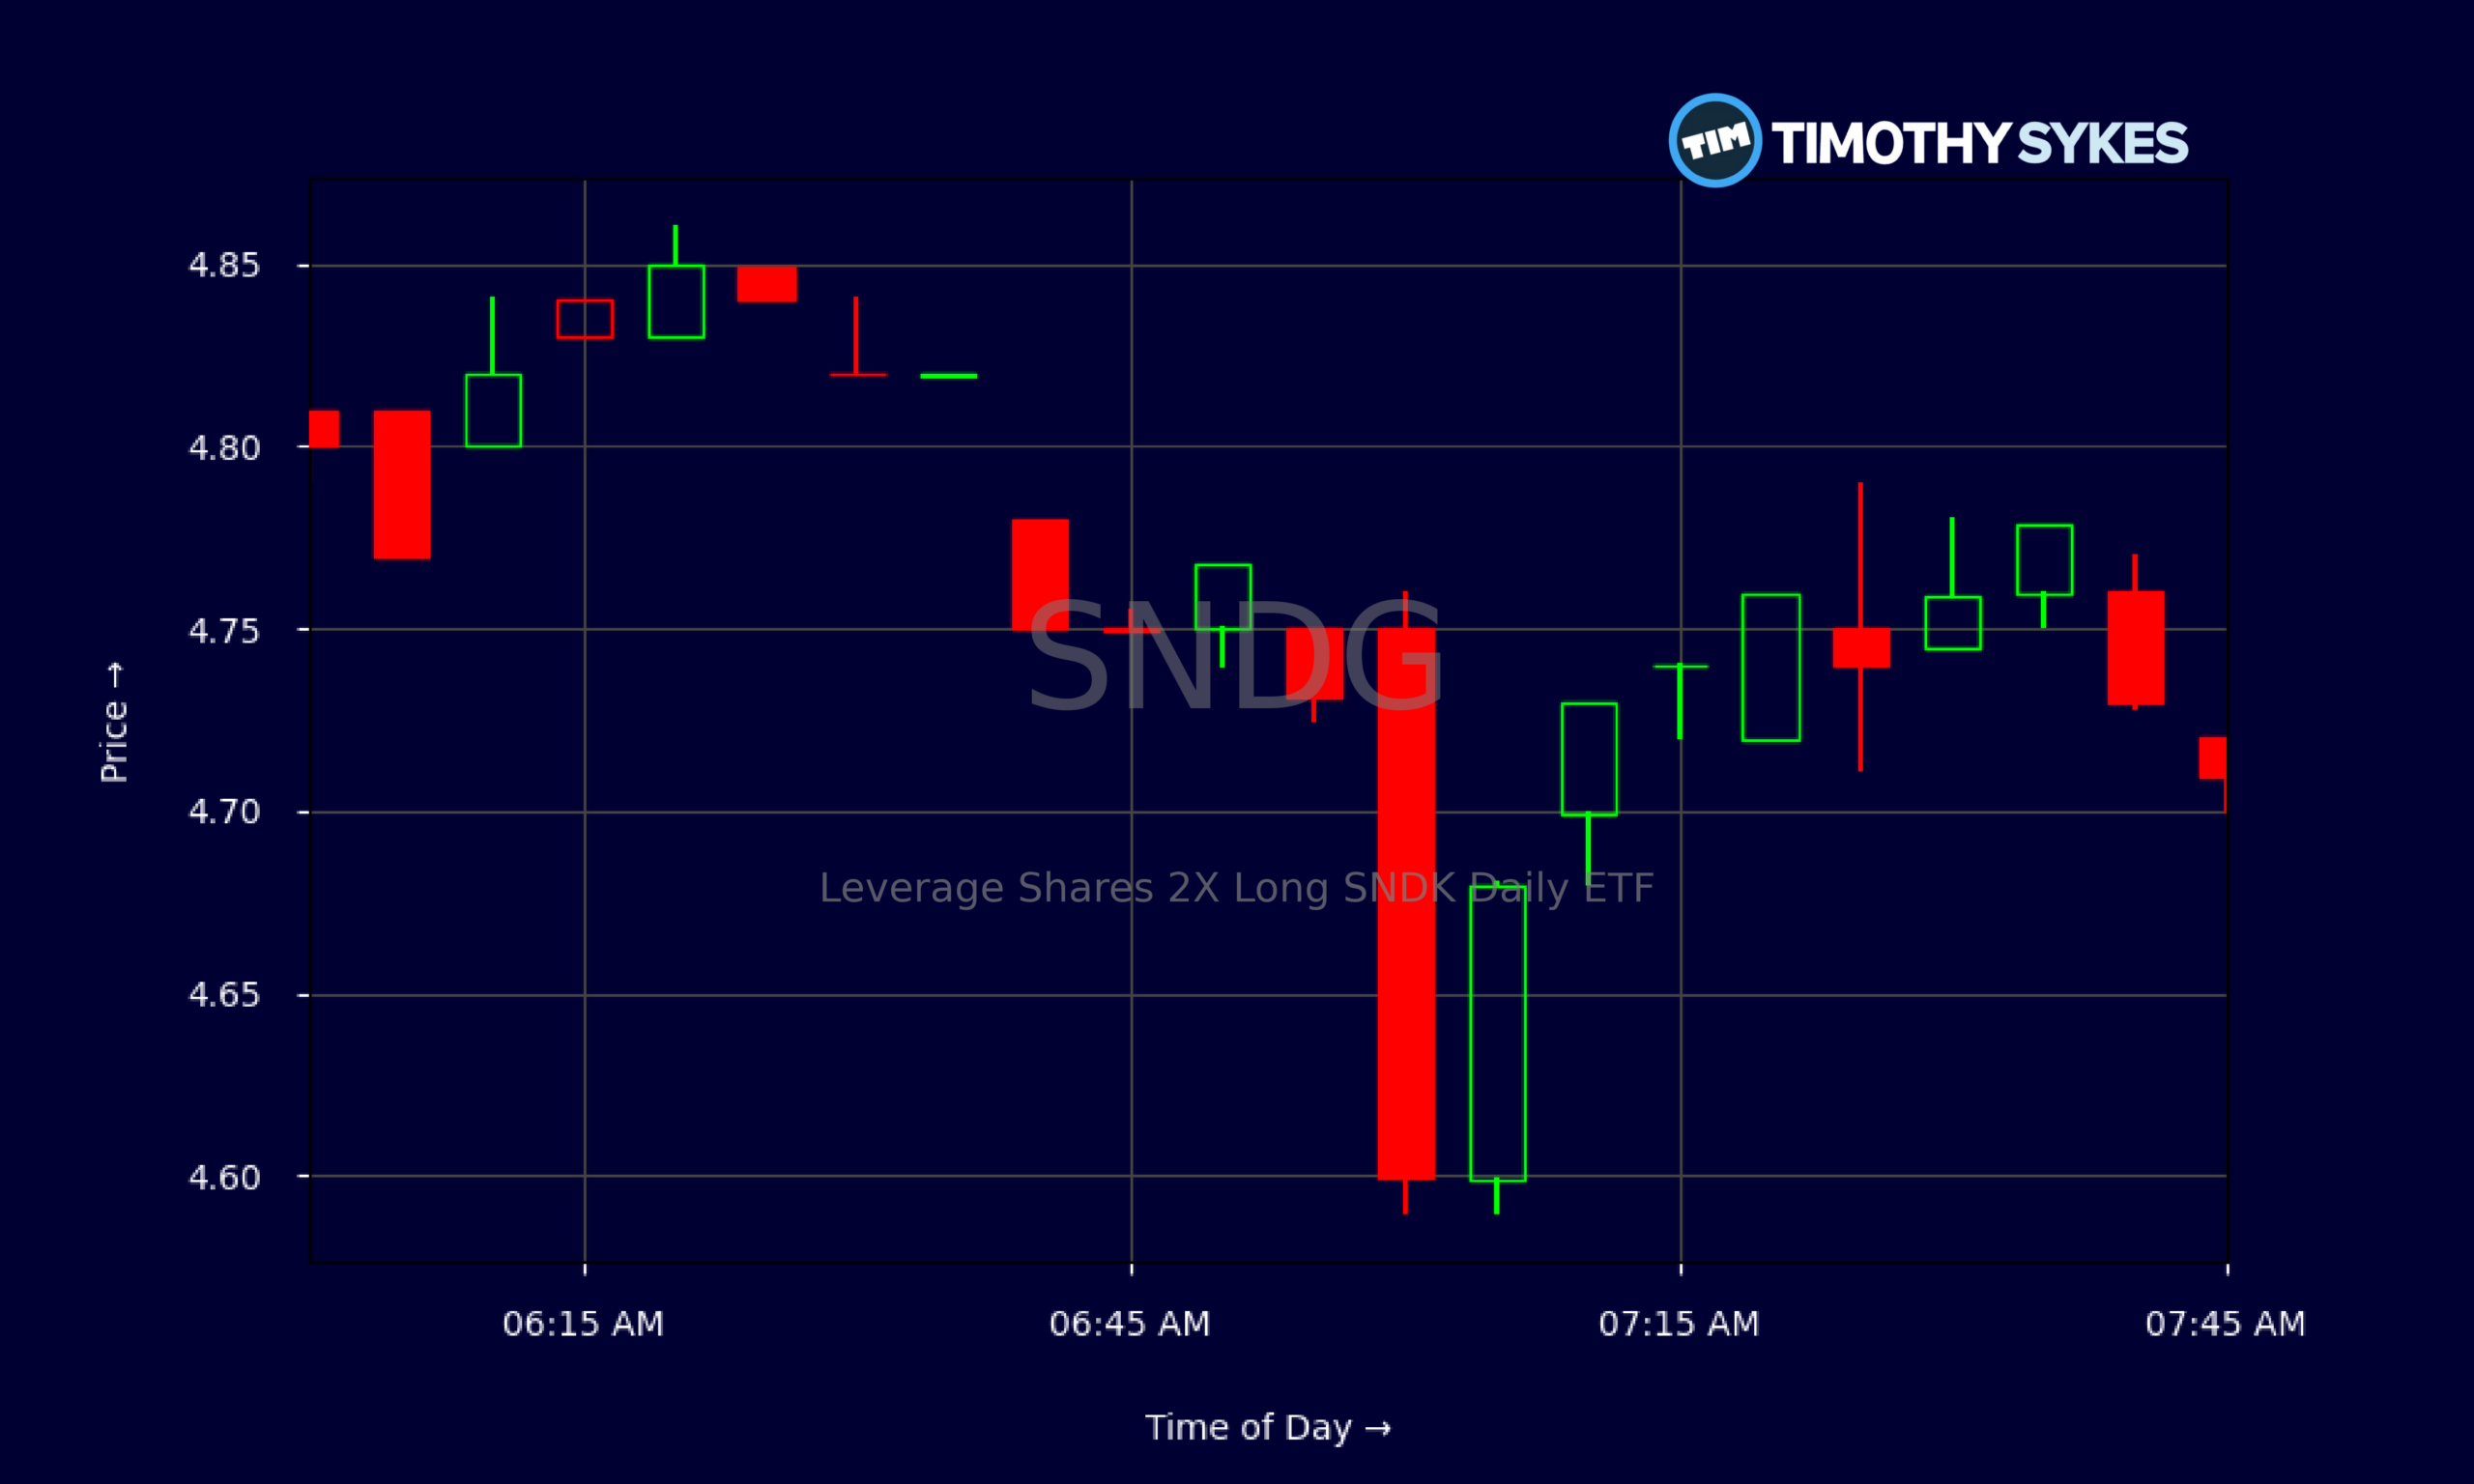
Live Update At 07:48:12 EDT: On Friday, October 30, 2026 Leverage Shares 2X Long SNDK Daily ETF stock [BATS Global Markets: SNDG] is trending down by -17.81%! Discover the key drivers behind this movement as well as our expert analysis in the detailed breakdown below.
Quick Financial Overview
SNDG, the Leverage Shares 2X Long SNDK Daily ETF, is a leveraged product built to amplify daily moves in its underlying exposure. That means traders are not dealing with traditional revenue, profit, or debt ratios here. Instead, SNDG is all about price action, leverage, and risk control. The empty fundamental ratios tell you one thing: this is a pure trading vehicle, not a long-term fundamental play.
Looking at the daily chart, SNDG closed at $9.90 on 2026/10/05 and has since bled lower to $5.73 by 2026/10/29. That is roughly a 42% drawdown in less than a month. For a 2x ETF like SNDG, that kind of slide is not unusual, but it is brutal for anyone holding without a plan.
More Breaking News
The candles show big ranges and quick reversals. SNDG ran above $10 early in the period, then printed several failed bounces around $9.50–$9.70, and finally rolled over into the mid-$5s. For active traders, the message is clear: respect the leverage, trade the trend, and never forget how fast SNDG can move against you.
Why Traders Are Watching SNDG Price Action
SNDG has become a textbook example of how leveraged ETFs reward discipline and punish hope. Earlier in the month, SNDG pushed from around $9.45 on 2026/10/08 to intraday highs above $10.35 on 2026/10/05 and $10.21 on 2026/10/07. That stretch drew in momentum traders chasing upside volatility. Then the floor gave way.
From there, SNDG started printing a series of lower highs and lower lows. Each bounce got weaker. The ETF dropped from $9.73 to $8.78, then to $8.46, then into the mid-$7s, and finally down toward $5.73 by 2026/10/29. This stair-step pattern is what experienced SNDG traders watch closely: strength early, then exhaustion, then trend breakdown.
More recently, SNDG’s intraday 5‑minute chart shows something different. Prices around $4.60–$4.85 in the premarket and early trading window show tighter consolidation, with small candles clustering in a narrow band. That tells traders the panic phase is cooling and SNDG is pausing.
For active SNDG trading, that pause matters. Consolidation after a heavy selloff often becomes the staging area for the next leg, up or down. Breaks above the upper band can fuel sharp short covers. Breaks under the lower band can trigger another flush as late dip-buyers bail. Either way, SNDG remains on watch because this kind of coiled action after a steep trend usually does not stay quiet for long.
Conclusion
SNDG is not a quiet, “set it and forget it” product. The recent slide from near $10 to the mid-$5s shows how unforgiving leveraged exposure can be when the underlying trend turns. At the same time, those wide daily ranges and intraday swings are exactly what short-term traders hunt. Leverage Shares 2X Long SNDK Daily ETF gives outsized moves both ways, so every tick matters.
With no earnings, no revenue, and no classic valuation metrics, SNDG trading comes down to three things: chart levels, volatility, and strict risk rules. The current consolidation zone on the intraday chart tells traders to map clear lines in the sand and plan both breakout and breakdown scenarios. SNDG rewards preparation and punishes hesitation.
Tim Sykes always says, “Cut losses quickly; small losses are fine, big losses are not.” As millionaire penny stock trader and teacher Tim Sykes, says, “Cut losses quickly, let profits ride, and don’t overtrade.”. That rule fits SNDG perfectly. Traders studying this ETF learn how leverage magnifies both gains and mistakes. For those willing to do the homework, track SNDG’s trend, and stick to a plan, the recent action offers a live classroom in momentum, breakdowns, and disciplined execution. This is trading education in real time, not advice to hold and hope.
This is stock news, not investment advice. Timothy Sykes News delivers real-time stock market news focused on key catalysts driving short-term price movements. Our content is tailored for active traders and investors seeking to capitalize on rapid price fluctuations, particularly in volatile sectors like penny stocks. Readers come to us for detailed coverage on earnings reports, mergers, FDA approvals, new contracts, and unusual trading volumes that can trigger significant short-term price action. Some users utilize our news to explain sudden stock movements, while others rely on it for diligent research into potential investment opportunities.
Dive deeper into the world of trading with Timothy Sykes, renowned for his expertise in penny stocks. Explore his top picks and discover the strategies that have propelled him to success with these articles:
- Penny Stocks Trading Guide
- Best Penny Stocks Under $1 to Buy Today
- Top 8 Penny Stocks to Watch on Robinhood
Once you’ve got some stocks on watch, elevate your trading game with StocksToTrade the ultimate platform for traders. With specialized tools for swing and day trading, StocksToTrade will guide you through the market’s twists and turns.
Dig into StocksToTrade’s watchlists here:




Leave a reply