

Blue Owl Capital Inc. stocks have been trading up by 5.95 percent following upbeat sentiment around its alternative credit strategies.
Key Takeaways For OWL Traders
- Shares of Blue Owl Capital are still down about 67% from early‑2025 highs, drawing M&A interest and forcing management to accelerate its strategic pivot beyond private credit.
- A Wall Street Journal report says bankers are exploring a full or partial sale, lifting OWL as TD Cowen stresses deep value, scarcity in a consolidating sector, and suitors like T. Rowe Price and Carlyle.
- Analyst views cluster around cautious optimism: targets range from $11 to $16, with Buy, Overweight, Outperform, and Equal Weight ratings into the Q3 2026 earnings release on 2026/10/29.
- Redemption caps at 5% on two private credit funds initially sounded scary, but OWL rose roughly 1.5%–2.7%, signaling trader relief that outflows are being contained.
- Management is leaning into insurance capital, large data‑center loans, and AI‑infrastructure financings through Stack Infrastructure and Wingspire, showing OWL still lands big, complex deals.
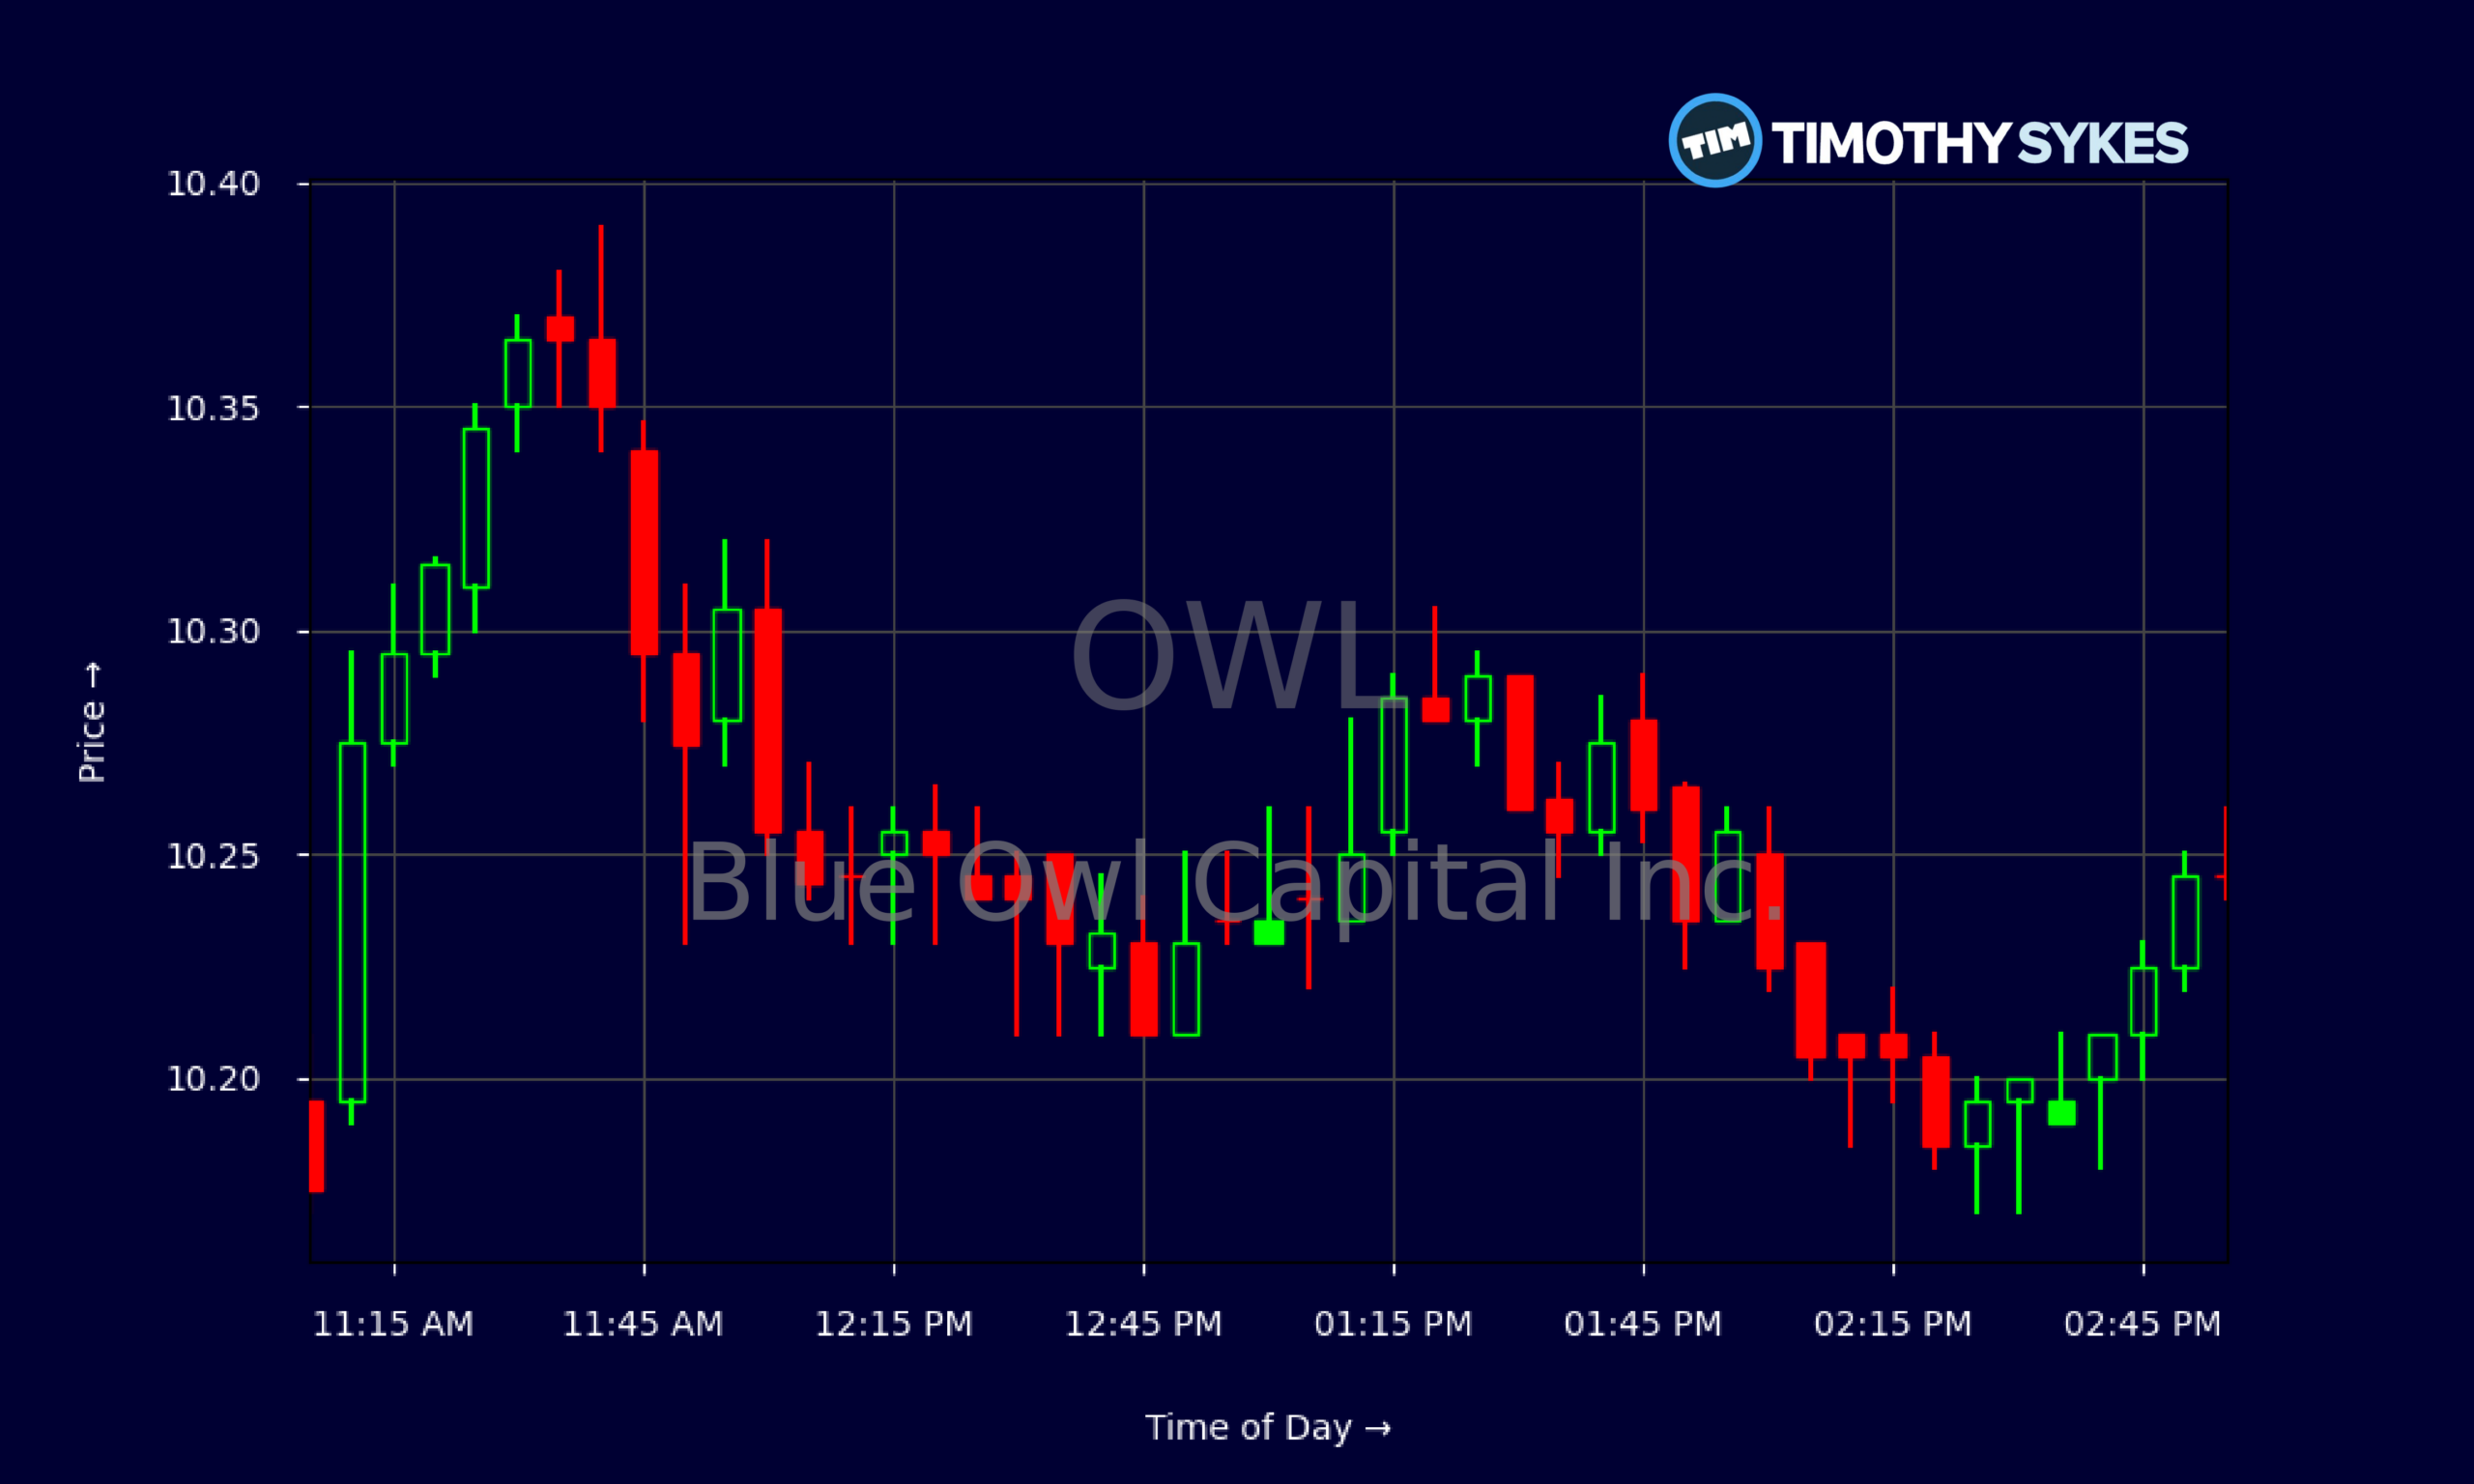
Live Update At 15:02:23 EDT: On Thursday, October 29, 2026 Blue Owl Capital Inc. stock [NYSE: OWL] is trending up by 5.95%! Discover the key drivers behind this movement as well as our expert analysis in the detailed breakdown below.
Quick Financial Overview
OWL has been in a tight but powerful grind higher this month. The daily chart shows Blue Owl Capital climbing from the high‑$8s in mid‑October to about $10.25 on 2026/10/29. That is a clean, near‑term uptrend after a brutal longer‑term slide of roughly 67% from early‑2025 peaks. For short‑term traders, OWL is now riding above prior congestion around $9.20–$9.40, turning old resistance into new support.
Intraday action on the latest session backs that story up. OWL opened near $9.80, pushed through $10, and then spent most of the day flagging between $10.18 and $10.32 with very controlled pullbacks. That kind of tight range after a morning push often signals steady dip‑buying and strong hands in control rather than wild chasey momentum.
More Breaking News
Fundamentally, OWL is still priced as a growth‑plus‑income story. Revenue runs around $2.87B a year, growing at about 24% over three years. Profit margins on a continuing basis sit near 11%, but the headline P/E near 79 and price‑to‑book above 7 tell traders this is not a deep‑value balance‑sheet play. The hook is fee power and scale: $319B in assets under management across credit, real assets, and GP stakes. A near‑9.5% dividend yield, backed by about $453M in quarterly free cash flow and roughly $0.92 per share in annual dividends, means income‑focused traders will watch payout safety closely as volatility plays out.
Why Traders Are Watching OWL Right Now
The real drama around OWL is not today’s 5‑minute candles. It is the tug‑of‑war between a crushed stock and a platform that Wall Street and strategics still want a piece of.
Blue Owl Capital’s share price collapse — down about 67% from its January 2025 high — has flipped the script. What was a crowded growth trade is now an M&A story. According to a Wall Street Journal report, investment bankers are pitching a full or partial sale. TD Cowen leans into that angle, calling out OWL’s “deep fundamental value” and “scarcity value” as asset‑management consolidators like T. Rowe Price and Carlyle keep hunting scale.
For traders, that M&A overhang matters. Any confirmation of a formal sale process, or even a credible leak, can reprice OWL fast. That helps explain why, despite the pain, TD Cowen just hiked its target from $15 to $16 with a Buy rating and named OWL a top pick into Q3 earnings. At the same time, Piper Sandler and BMO trimmed targets to $12 and $11 but stayed Overweight and Outperform, while Wells Fargo came in at Equal Weight with a $10 level. The Street is not abandoning Blue Owl Capital; it is just demanding more proof.
On the operational side, management is trying to supply that proof. OWL is capping redemptions at 5% in two private credit funds — a clear sign of outflow pressure — yet the stock actually climbed about 1.5%–2.7% on the news. Traders read that as management protecting the franchise, not panicking. OWL is also expanding its insurance‑related business with a balance‑sheet‑light model, aiming for longer‑duration capital without swallowing an insurer.
Deal flow backs up the narrative. Stack Infrastructure, an OWL platform, is arranging an A$8.6B (about $6B) five‑year loan for a Melbourne data center, one of Asia’s largest potential data‑center financings. Wingspire Equipment Finance, tied to Blue Owl Capital Corporation and OWL, just led a $363M AI‑infrastructure deal for IREN and additional financing for Skylight, a fast‑growing consumer name. These complex private‑credit and AI‑infrastructure trades show OWL is still at the table on marquee transactions, even as analysts warn of greater scrutiny around data‑center risk.
For active traders, that mix — bombed‑out chart, event‑driven upside, and real underlying deal activity — is exactly why OWL is on more watchlists this month.
Conclusion
OWL sits at a familiar crossroads for beaten‑up Wall Street stories. The long‑term chart screams damage, yet the latest tape, the analyst notes, and the deal headlines all point to a franchise that still matters. Blue Owl Capital has $319B in AUM, a high‑margin fee engine, and a juicy dividend yield that many asset‑light managers cannot match. At the same time, the firm is wrestling with redemption caps, higher‑for‑longer rates, and softer realizations, especially in private equity and data‑center‑linked credit.
Management’s response is clear: push beyond plain‑vanilla private credit, lean into institutional mandates from pensions and insurers, build a balance‑sheet‑light insurance platform, and keep winning high‑profile financings in data centers and AI infrastructure via units like Stack Infrastructure and Wingspire. The outside world’s response is just as important. Bankers are circling OWL with sale pitches, and the Street still clusters around positive or neutral ratings, with targets roughly bracketing the current price.
For day and swing traders, that sets up OWL as a pure “catalyst plus chart” name into the 2026/10/29 earnings print and any future M&A headlines. The risk is real, the volatility is real, and the liquidity pressure is not fully gone. But the range is defined, and the story is in motion.
As Tim Sykes likes to remind traders, “The market doesn’t care about your opinion, only about your preparation.” As millionaire penny stock trader and teacher Tim Sykes, says, “Consistency is key in trading; don’t let emotions dictate your trades.”. With OWL, that preparation means knowing the M&A chatter, understanding the redemption caps, tracking the AI and data‑center deals, and having a clear trading plan before the next headline hits. This discussion is for educational and research purposes only and is not investment advice.
This is stock news, not investment advice. Timothy Sykes News delivers real-time stock market news focused on key catalysts driving short-term price movements. Our content is tailored for active traders and investors seeking to capitalize on rapid price fluctuations, particularly in volatile sectors like penny stocks. Readers come to us for detailed coverage on earnings reports, mergers, FDA approvals, new contracts, and unusual trading volumes that can trigger significant short-term price action. Some users utilize our news to explain sudden stock movements, while others rely on it for diligent research into potential investment opportunities.
Dive deeper into the world of trading with Timothy Sykes, renowned for his expertise in penny stocks. Explore his top picks and discover the strategies that have propelled him to success with these articles:
- Penny Stocks Trading Guide
- Best Penny Stocks Under $1 to Buy Today
- Top 8 Penny Stocks to Watch on Robinhood
Once you’ve got some stocks on watch, elevate your trading game with StocksToTrade the ultimate platform for traders. With specialized tools for swing and day trading, StocksToTrade will guide you through the market’s twists and turns.
Dig into StocksToTrade’s watchlists here:




Leave a reply