

PicoCELA Inc. stocks have been trading up by 36.8 percent after announcing a strategic partnership expansion in wireless networking.
Key Takeaways
- PCLA has bounced between roughly $5.80 and $6.70 over recent days, signaling an active trading range.
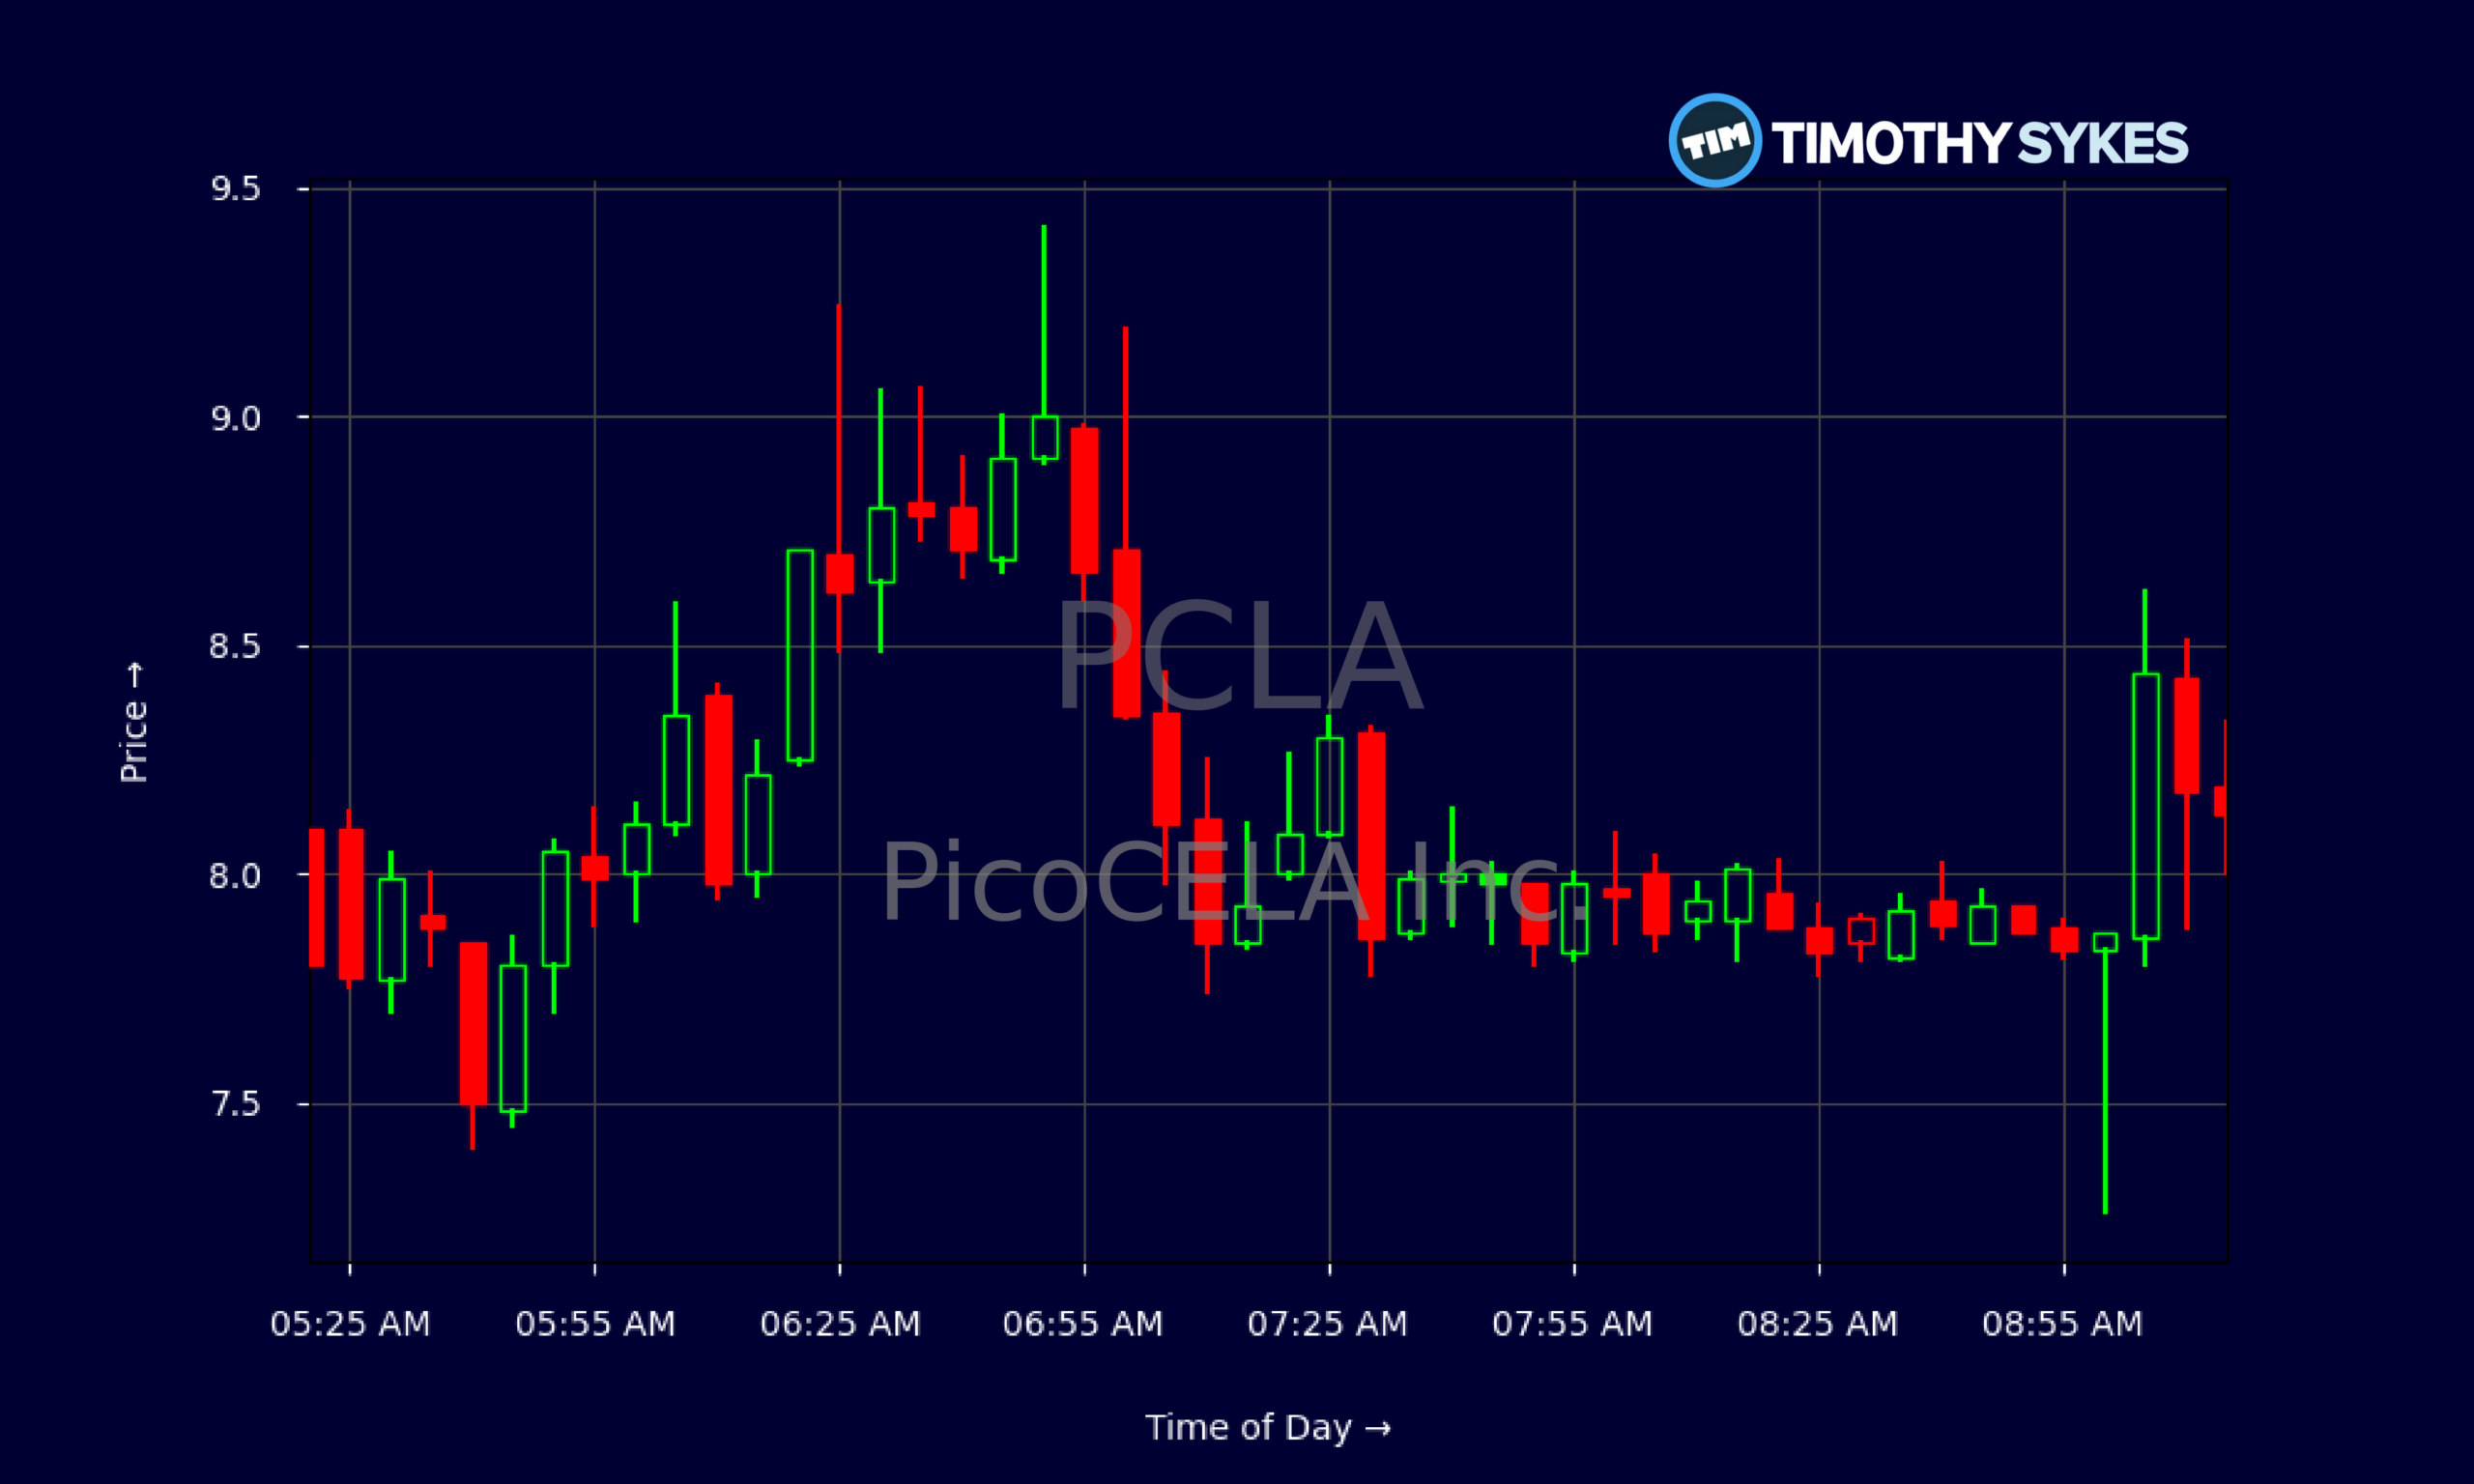
- Intraday, PicoCELA Inc. spiked from the low $7s toward $9 before fading, showing heavy momentum and fast reversals.
- PCLA’s revenue of about $544.7M contrasts with steep negative margins, highlighting a growth story still burning cash.
- A strong cash balance above $500M gives PicoCELA Inc. room to operate despite deep losses.
- Traders are watching PCLA’s support near $5.80–$6.00 and the recent push into the $8–$9 zone for the next move.
Live Update At 09:20:00 EDT: On Thursday, October 29, 2026 PicoCELA Inc. stock [NASDAQ: PCLA] is trending up by 36.8%! Discover the key drivers behind this movement as well as our expert analysis in the detailed breakdown below.
Quick Financial Overview
PicoCELA Inc., trading under ticker PCLA, is a classic high-growth, high-burn story on the numbers. The company generated about $544.7M in revenue, which is real scale, but the pretax profit margin sits near -114%. That tells traders PCLA is spending aggressively to drive growth, and the business is far from breakeven.
Return on assets around -7.6% and return on equity close to -16% back up that picture. PicoCELA Inc. is not yet turning its asset base into profits. At the same time, PCLA holds roughly $534.9M in cash and short-term investments against total liabilities of about $617.2M and current liabilities near $465.0M. Working capital of roughly $527.4M suggests the company has breathing room.
More Breaking News
On valuation, a price-to-sales ratio near 17.9 and price-to-book above 20 mean traders are paying a rich premium relative to current fundamentals. This is typical of speculative growth names. Leverage is moderate with long-term debt of about $10.4M and a low long-term debt-to-capital number, which keeps balance-sheet risk manageable. For active traders, PCLA’s numbers scream “story stock” driven more by momentum than traditional value metrics.
Why Traders Are Watching PCLA Price Swings
PCLA has turned into a lively trading vehicle, and the charts tell the story. On the multi-day view, PicoCELA Inc. has been chopping between about $5.80 and $6.70. Recent closes around $5.87–$6.00 mark the lower end of that band, after failing to hold pushes above $6.50 and $6.70 earlier in the month. That range gives short-term traders clear reference points for support and resistance.
Intraday action is where PCLA really lights up. The 5-minute chart shows a wild premarket and early session move: PicoCELA Inc. traded near $6.00–$7.00 before squeezing up into the $8s and tagging the $9 area. From there, PCLA faded back into the mid-$8s, with repeated spikes and pullbacks of $0.30–$0.60 in minutes. That type of volatility is exactly what momentum traders hunt.
The pattern looks like a classic morning spike with profit-taking and then choppy consolidation. When a stock like PCLA pulls from $9 back into the high $7s–low $8s but holds that zone, it often sets up a second push — or a hard crack if support fails. Volume is not shown here, but the price behavior alone signals heavy participation.
For day traders and scalpers, the tight intraday swings around whole-dollar levels — $7.50, $8.00, $8.50, $9.00 — create repeatable risk-reward setups. Swing traders watching PCLA see the bigger band near $5.80–$6.70 on the daily, combined with this intraday strength into the $8–$9 pocket, as a sign the stock is trying to shift into a higher trading range.
Conclusion
For active traders, PCLA sits at the crossroads of aggressive growth fundamentals and explosive technical action. PicoCELA Inc. generates meaningful revenue, but the deep negative margins and weak returns on capital confirm this is not a steady cash machine yet. Instead, PCLA trades like a momentum name: expensive on traditional ratios, fueled by story and speculation, and powered by a sizable cash pile that keeps the narrative alive.
The daily chart shows PicoCELA Inc. defending the mid-$5s to low-$6s while failing, so far, to build a lasting trend above $6.70. The intraday tape, though, shows PCLA stretching into the $8–$9 range with sharp spikes and equally sharp pullbacks. That split between daily consolidation and intraday fireworks is where many in the Tim Sykes-style community thrive.
As Tim Sykes likes to say, “Volatility is your best friend if you respect it and your worst enemy if you don’t.” As millionaire penny stock trader and teacher Tim Sykes says, “Be patient, don’t force trades, and let the perfect setups come to you.” PCLA fits that line perfectly right now. Traders focusing on PicoCELA Inc. should map their key levels, size small, and cut losses fast. The edge is not in predicting where PCLA “should” trade based on its business, but in reacting with discipline to what the chart is actually doing minute by minute.
This is stock news, not investment advice. Timothy Sykes News delivers real-time stock market news focused on key catalysts driving short-term price movements. Our content is tailored for active traders and investors seeking to capitalize on rapid price fluctuations, particularly in volatile sectors like penny stocks. Readers come to us for detailed coverage on earnings reports, mergers, FDA approvals, new contracts, and unusual trading volumes that can trigger significant short-term price action. Some users utilize our news to explain sudden stock movements, while others rely on it for diligent research into potential investment opportunities.
Dive deeper into the world of trading with Timothy Sykes, renowned for his expertise in penny stocks. Explore his top picks and discover the strategies that have propelled him to success with these articles:
- Penny Stocks Trading Guide
- Best Penny Stocks Under $1 to Buy Today
- Top 8 Penny Stocks to Watch on Robinhood
Once you’ve got some stocks on watch, elevate your trading game with StocksToTrade the ultimate platform for traders. With specialized tools for swing and day trading, StocksToTrade will guide you through the market’s twists and turns.
Dig into StocksToTrade’s watchlists here:





Leave a reply