

Equinor ASA stocks have been trading up by 4.56 percent following upbeat headlines on expanding offshore energy project approvals.
Market Insights For EQNR Traders
- Shares jumped about 3–3.4% after a new gas discovery at the Gullfaks South field offshore Norway, adding to Equinor ASA’s resource base in a strong gas‑price backdrop.
- A fresh oil and gas discovery near the Oseberg field, with partners TotalEnergies and Petoro, lifted the stock roughly 1% and reinforced EQNR’s Norwegian offshore pipeline.
- Multi‑year gas supply deals with Eneco for about 9 TWh annually over five years pushed the shares up around 2.4–2.5%, showing the market likes contracted European gas exposure.
- Stock traded more than 1% higher pre‑market after extending the Deepsea Atlantic drilling contract to late Q4 2027 by adding two more wells, signaling ongoing exploration commitment.
- JPMorgan raised its price target from NOK 360 to NOK 400 but kept an Underweight rating, flagging only modest upside despite the strong run of positive operational news.
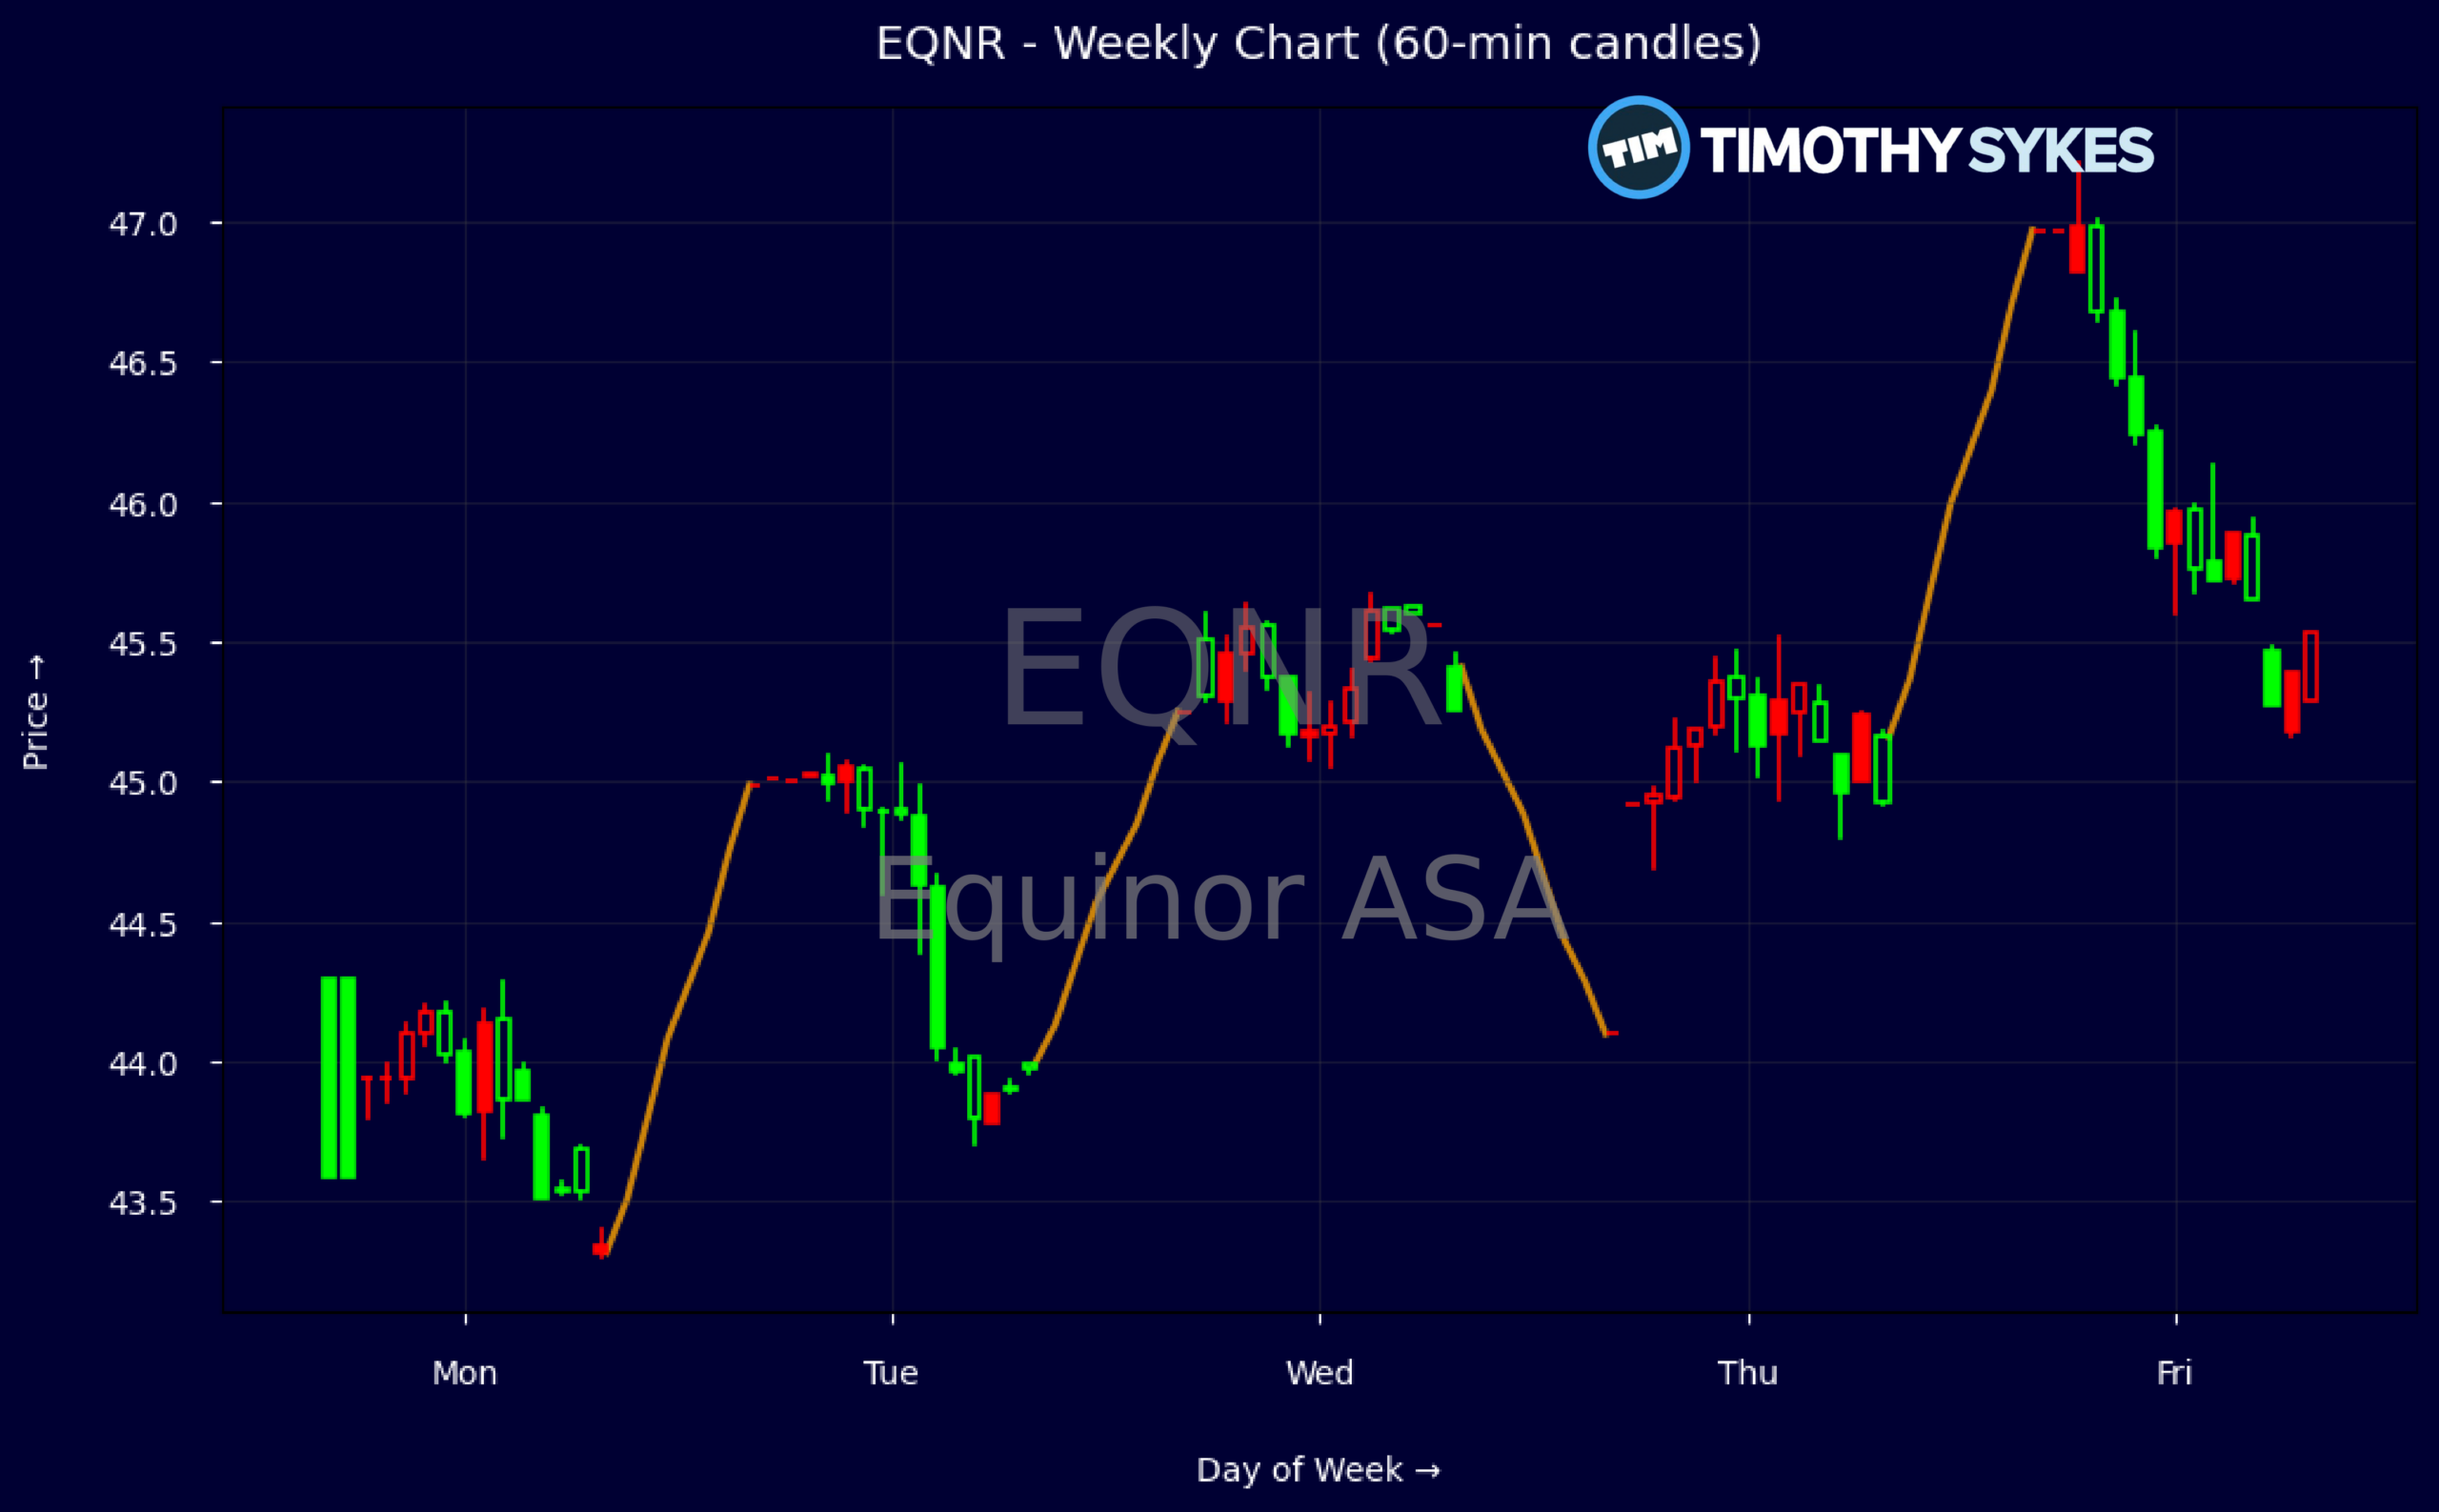
Weekly Update Oct 12 – Oct 16, 2026: On Saturday, October 17, 2026 Equinor ASA stock [NYSE: EQNR] is trending up by 4.56%! Discover the key drivers behind this movement as well as our expert analysis in the detailed breakdown below.
Energy industry expert:
Analyst sentiment – positive
Equinor holds a solid integrated position with a balanced upstream and gas-weighted portfolio, underpinned by NOK ~104bn in revenue and a strong 40.2% pre-tax margin, placing it at the high end of European majors on profitability. Valuation is full but not extreme at 22.2x earnings and 1.0x sales, reflecting defensiveness and Norwegian sovereign backing. Leverage is moderate with a 3.3x ratio and long-term debt of NOK 23.8bn vs cash of NOK 19.3bn, supporting a sustainable 3.3% dividend yield.
Technically, EQNR shows a short-term bullish inflection: after consolidating in the NOK 44–45 range, price broke higher to close at 46.97 with a strong weekly candle and minimal upper wick, indicating aggressive buying into the close. Intraday 5‑minute action (not shown numerically) aligns with steady bid and healthy volume build above NOK 45.50. Dominant trend is now up; key actionable level is NOK 45.00, which should act as first support and a tactical buy-on-dip zone with tight risk control below NOK 44.10.
Fundamentally and news-wise, Equinor is outperforming the broader energy complex, with multiple North Sea oil and gas discoveries (Gullfaks South, near Oseberg) and long-dated gas contracts (Eneco, ~9 TWh/year for five years) reinforcing cash flow visibility versus peers more exposed to spot volatility. JPMorgan’s NOK 400 target with Underweight underscores relative valuation richness but not balance sheet or asset quality risk. I see upside toward NOK 50 over 6–12 months, with support at NOK 45 and resistance at NOK 48 then NOK 50.
More Breaking News
Quick Financial Overview
Equinor ASA (EQNR) is trading with clear upside momentum in the latest data. On the weekly tape, price pushed from the mid‑$43 area to close near $46.97, after printing highs above $47. That move, combined with multiple news‑driven pops of 1–3% on different days, tells traders money is leaning bullish on fresh catalysts rather than fading them.
Intraday, the 5‑minute snapshot shows EQNR opening in the mid‑$45s, flushing briefly toward $45.60, then driving up through $47 before closing just under the high. That intraday pattern is classic trend‑day behavior: early dip gets bought, range expands to the upside, and closing strength confirms demand. For short‑term traders, that kind of action usually defines $45–$46 as key support and the $47 zone as near‑term resistance to watch for either a breakout or a rejection.
On the fundamental side, Equinor ASA printed about $103.7B in revenue, with a price‑to‑sales ratio near 1.0 and a P/E around 22. These are not distressed levels; the market is already pricing in solid profitability, backed by a pretax margin above 40% and returns on equity around 16–17%. An enterprise value near $110.7B, combined with total assets of roughly $131.7B and long‑term debt about $23.8B, points to a company with scale and manageable leverage. The roughly 3.3% dividend yield and upcoming ex‑dividend date on 2026/11/16 add a steady‑income angle that can support dips, though the negative multi‑year revenue growth metrics warn that EQNR is more about margin strength and capital discipline than top‑line expansion right now.
Conclusion
Equinor ASA has lined up a cluster of bullish catalysts that explain why EQNR is pushing higher on the chart. New gas and oil discoveries at Gullfaks South and near Oseberg expand the company’s resource base close to existing Norwegian infrastructure, which tends to be capital‑efficient. Add in the five‑year, roughly 9 TWh‑per‑year gas deal with Eneco and the extended Deepsea Atlantic drilling contract through late Q4 2027, and you get a story of visible volumes plus ongoing exploration upside.
For traders, the key is how that story interacts with price. The recent drive from the low‑$40s into the high‑$40s, plus intraday strength near $47, sets up a simple map: pullbacks toward $45–$46 are where you watch for higher‑low bounces, while a clean push and hold above $47 would confirm bulls still control EQNR’s short‑term tape. At the same time, JPMorgan’s Underweight rating, even with a higher NOK 400 target, reminds everyone that valuation is no longer cheap and that sector peers may screen better on some metrics. This is where disciplined trade management matters: as millionaire penny stock trader and teacher Tim Sykes says, “Small gains add up over time; focus on building wealth gradually, not chasing jackpots.”, a mindset that fits well with taking measured setups in a name that has already re‑rated higher.
Risk‑reward here leans toward momentum tactics rather than deep‑value positioning. Traders should track gas prices, further exploration headlines, and any changes to contract visibility, because those are the levers that have been moving Equinor ASA lately. As I often tell my students, “The edge is rarely in the story itself, it’s in how price reacts to that story and whether you can define your risk around those levels.” This remains a research‑driven trading vehicle, not a set‑and‑forget holding.
This is stock news, not investment advice. Timothy Sykes News delivers real-time stock market news focused on key catalysts driving short-term price movements. Our content is tailored for active traders and investors seeking to capitalize on rapid price fluctuations, particularly in volatile sectors like penny stocks. Readers come to us for detailed coverage on earnings reports, mergers, FDA approvals, new contracts, and unusual trading volumes that can trigger significant short-term price action. Some users utilize our news to explain sudden stock movements, while others rely on it for diligent research into potential investment opportunities.
Dive deeper into the world of trading with Timothy Sykes, renowned for his expertise in penny stocks. Explore his top picks and discover the strategies that have propelled him to success with these articles:
- Penny Stocks Trading Guide
- Best Penny Stocks Under $1 to Buy Today
- Top 8 Penny Stocks to Watch on Robinhood
Once you’ve got some stocks on watch, elevate your trading game with StocksToTrade the ultimate platform for traders. With specialized tools for swing and day trading, StocksToTrade will guide you through the market’s twists and turns.
Dig into StocksToTrade’s watchlists here:





Leave a reply