

Exascale Labs Holdings Inc. soared as stocks have been trading up by 57.35 percent following transformative AI infrastructure breakthroughs.
What Traders Need To Know
- Exascale Labs shares rose 20% after the company disclosed an SEC-filed contract to supply NVIDIA GPU servers to Sunon.
- The newly disclosed contract with Sunon is valued at about $8.2M, a meaningful win versus current revenue.
- The contract and the sharp stock move were detailed through an SEC filing, underscoring this as a confirmed, material deal.
- Recent price action shows a momentum shift, with XLAB breaking out from sub-$1 levels into the $2 area on heavy interest.
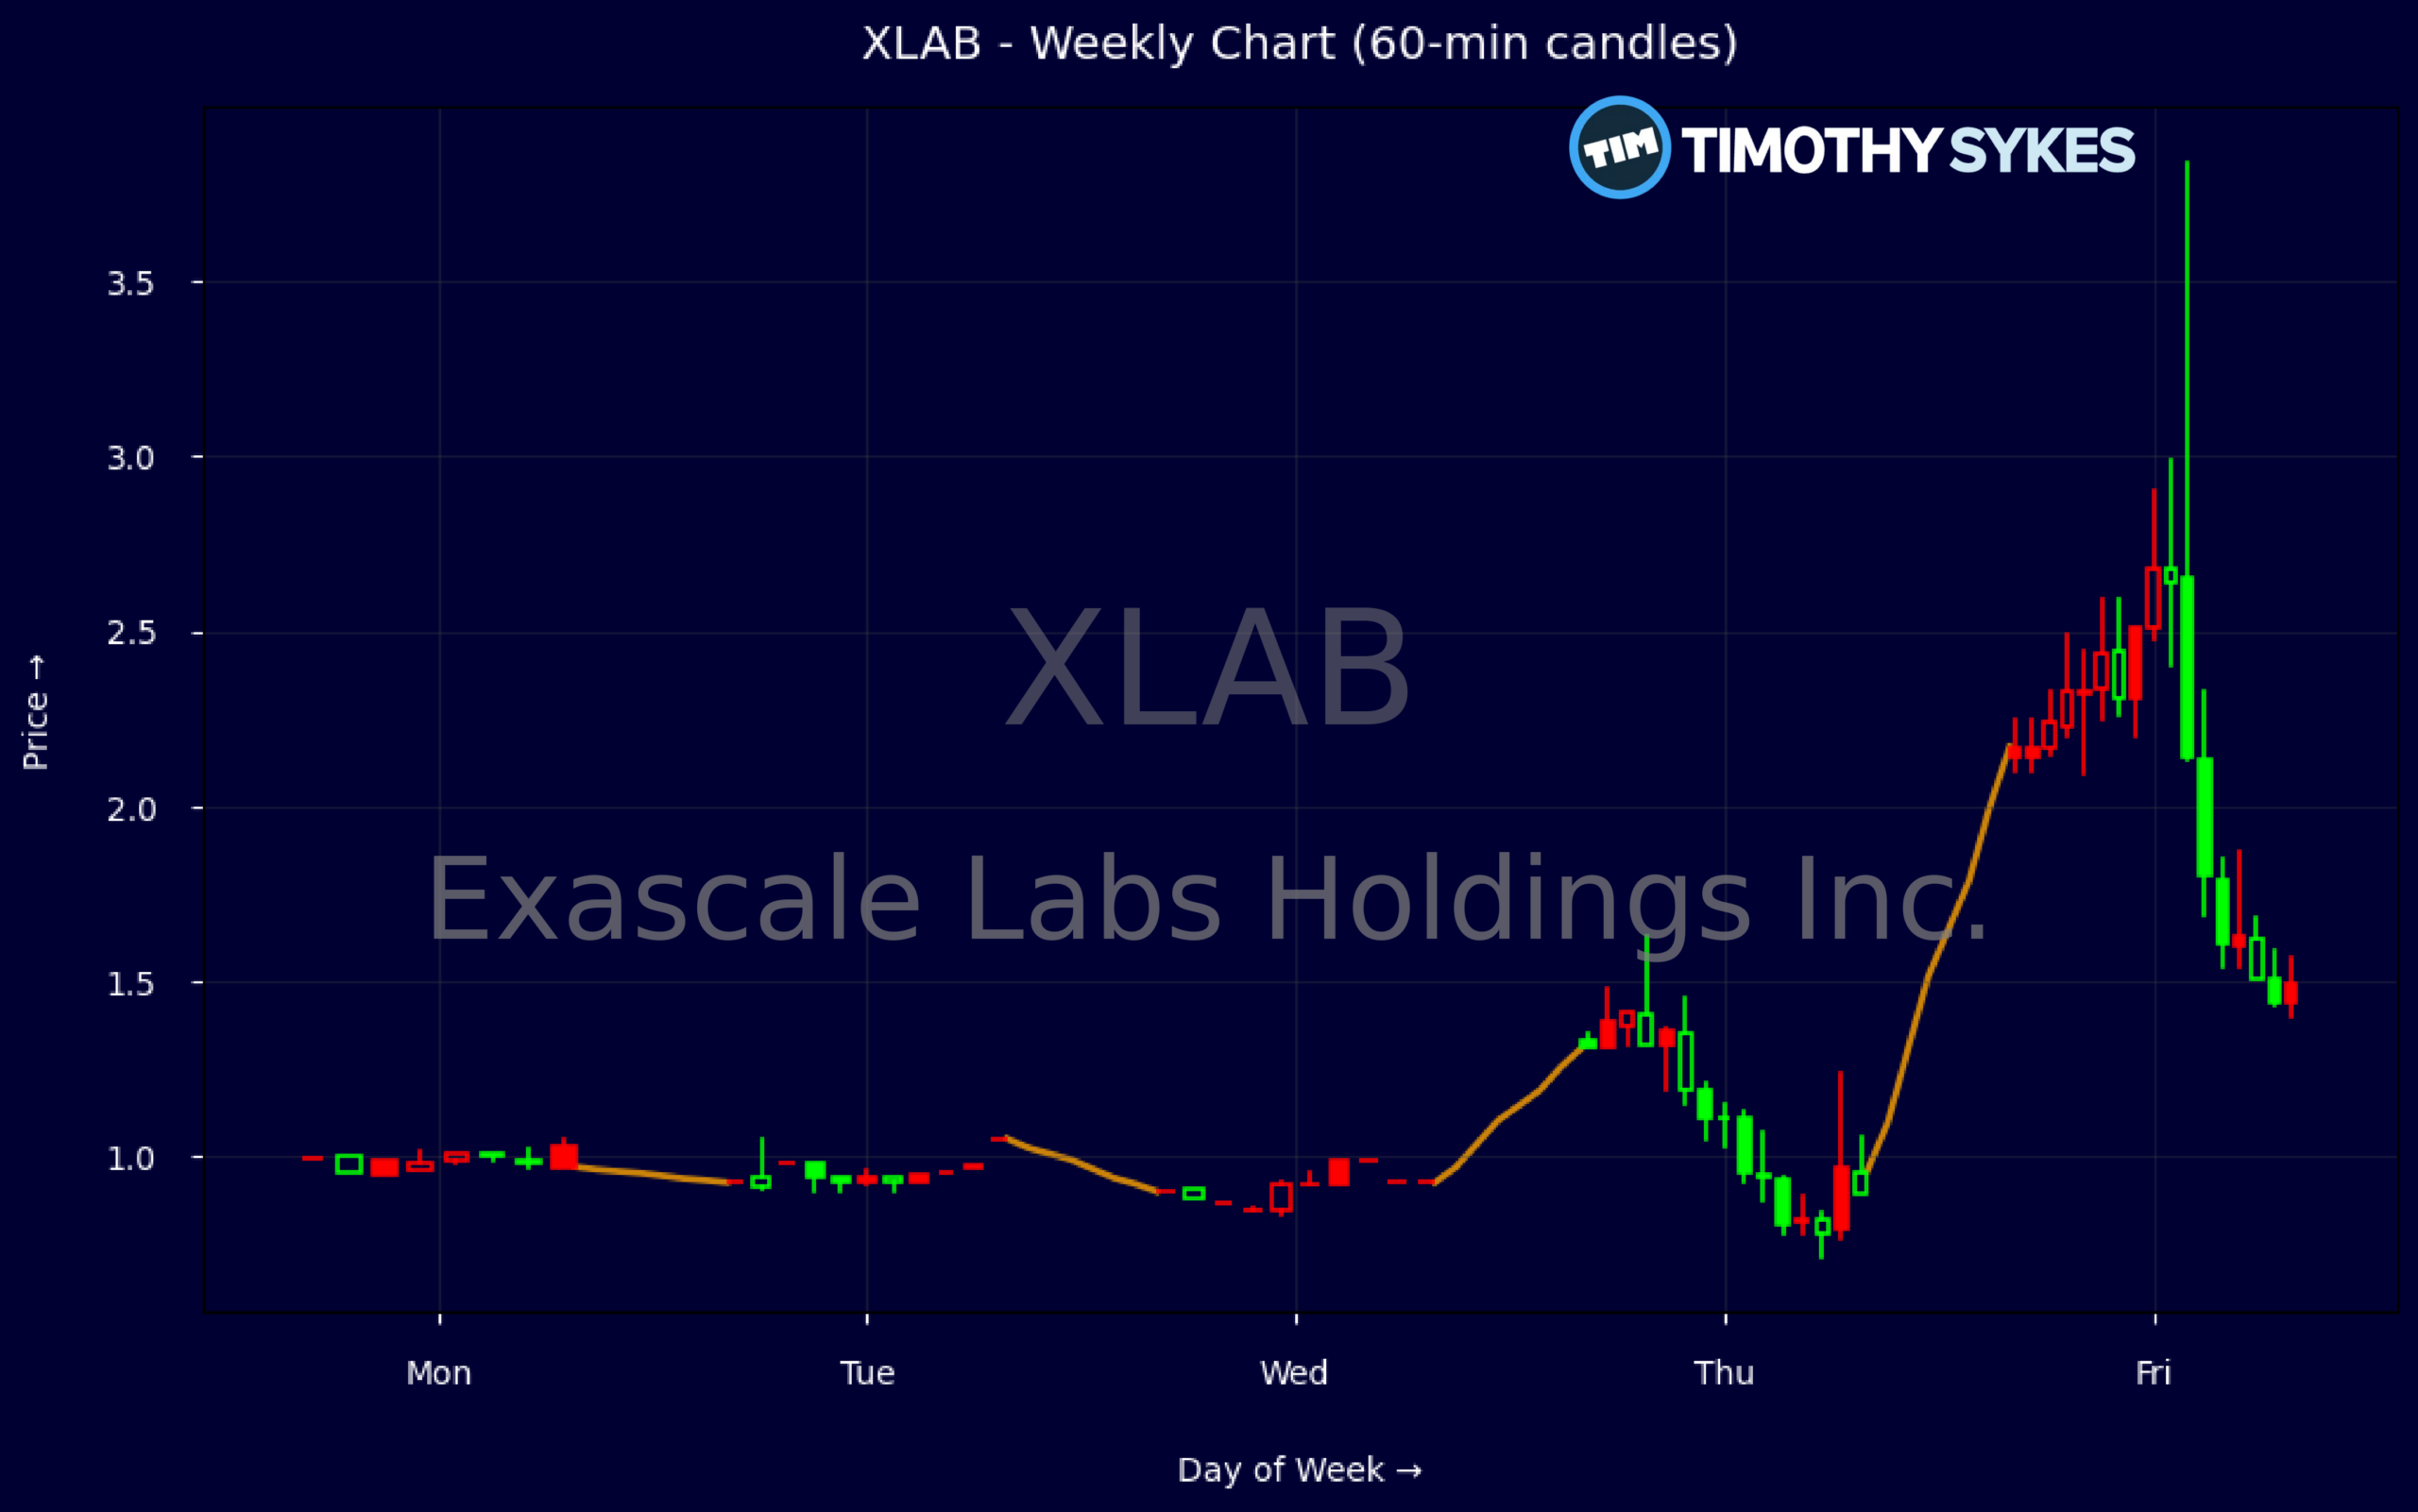
Weekly Update Oct 12 – Oct 16, 2026: On Sunday, October 18, 2026 Exascale Labs Holdings Inc. stock [NASDAQ: XLAB] is trending up by 57.35%! Discover the key drivers behind this movement as well as our expert analysis in the detailed breakdown below.
Technology industry expert:
Analyst sentiment – positive
Exascale Labs (XLAB) is a micro-cap GPU infrastructure and services name with extremely weak fundamentals offset by improving cash dynamics. Revenue of ~$7.0m against an implied pre-tax margin of -70% and ROA of -36% signals a still-immature, loss-making model. Negative book value (BVPS -$0.20, P/B -4.8x) and large accumulated deficit (-$13.2m retained earnings) highlight prior dilution and write-downs. Positively, Q2-26 operating cash flow (~$2.75m) and free cash flow (~$2.75m) are solid relative to scale, supported by $4.3m equity issuance, leaving ~$4.2m cash but heavy current liabilities and negative working capital of ~$13.0m.
Technically, XLAB has shifted from a low-liquidity micro-cap grind to high-volatility momentum. The step function from sub-$1.00 closes (0.99 → 0.93 → 0.90) into a $1.31–1.35 spike, then an explosive move to a $2.49 high and $2.14 close, shows aggressive buying, likely news-driven, with volume concentrated at $1.30–$2.40. The dominant trend is now short-term bullish with elevated risk. A tactical level to watch is $1.30–1.35: above it, momentum long setups are justified; a sustained break below suggests failed breakout and likely fast mean reversion.
The NVIDIA GPU server contract for Sunon (~$8.2m, exceeding trailing revenue) is a material validation catalyst, mechanically improving near-term backlog and revenue visibility. Versus broader Technology and Software & IT Services benchmarks, XLAB trades more like a binary small-cap hardware enabler than a diversified software comp, with higher risk and higher event-dependency. I view risk/reward as speculative but skewed positive while the contract executes. Near-term support sits at $1.30, resistance around $2.50; an aggressive 3–6 month upside target range is $2.75–3.00, assuming clean delivery and no balance-sheet shock.
More Breaking News
Quick Financial Overview
Exascale Labs Holdings Inc. (XLAB) just showed traders what a real catalyst looks like. The stock moved from $1.31–$1.35 into the mid-$2s within days, capped by a 20% jump after the SEC-filed NVIDIA GPU server contract with Sunon worth about $8.2M. Weekly data shows price sliding from $0.99 toward $0.90, then ripping to a $2.49 high and closing $2.14, which is a clean momentum breakout from a low-priced base.
Intraday, the 5-minute candle shows a wide range session, opening near $1.85, spiking as high as $3.84, and closing around $2.35. That kind of range signals aggressive buying mixed with profit taking — classic volatility after surprise news. For short-term traders, these wide bars mean opportunity but also demand tight risk control, as slippage and emotional entries can quickly flip green trades to red.
On the fundamentals, XLAB’s last reported revenue was about $7.02M, and the Sunon contract alone is slightly larger than a full quarter’s sales. Yet key ratios remind us the business is not out of the woods: pretax margin at roughly -70.1% and return on assets at about -35.95% flag ongoing losses, while book value is negative at around -$0.20 per share. The balance sheet shows about $4.23M in cash, total assets of $7.32M, and a deep negative equity position near -$13.0M, driven by liabilities above $20.3M.
Conclusion
This is stock news, not investment advice. Timothy Sykes News delivers real-time stock market news focused on key catalysts driving short-term price movements. Our content is tailored for active traders and investors seeking to capitalize on rapid price fluctuations, particularly in volatile sectors like penny stocks. Readers come to us for detailed coverage on earnings reports, mergers, FDA approvals, new contracts, and unusual trading volumes that can trigger significant short-term price action. Some users utilize our news to explain sudden stock movements, while others rely on it for diligent research into potential investment opportunities.
Dive deeper into the world of trading with Timothy Sykes, renowned for his expertise in penny stocks. Explore his top picks and discover the strategies that have propelled him to success with these articles:
- Penny Stocks Trading Guide
- Best Penny Stocks Under $1 to Buy Today
- Top 8 Penny Stocks to Watch on Robinhood
Once you’ve got some stocks on watch, elevate your trading game with StocksToTrade the ultimate platform for traders. With specialized tools for swing and day trading, StocksToTrade will guide you through the market’s twists and turns.
Dig into StocksToTrade’s watchlists here:





Leave a reply