

INVE Technologies Inc. stocks have been trading up by 22.52 percent after announcing a transformative AI-driven product partnership.
Key Takeaways
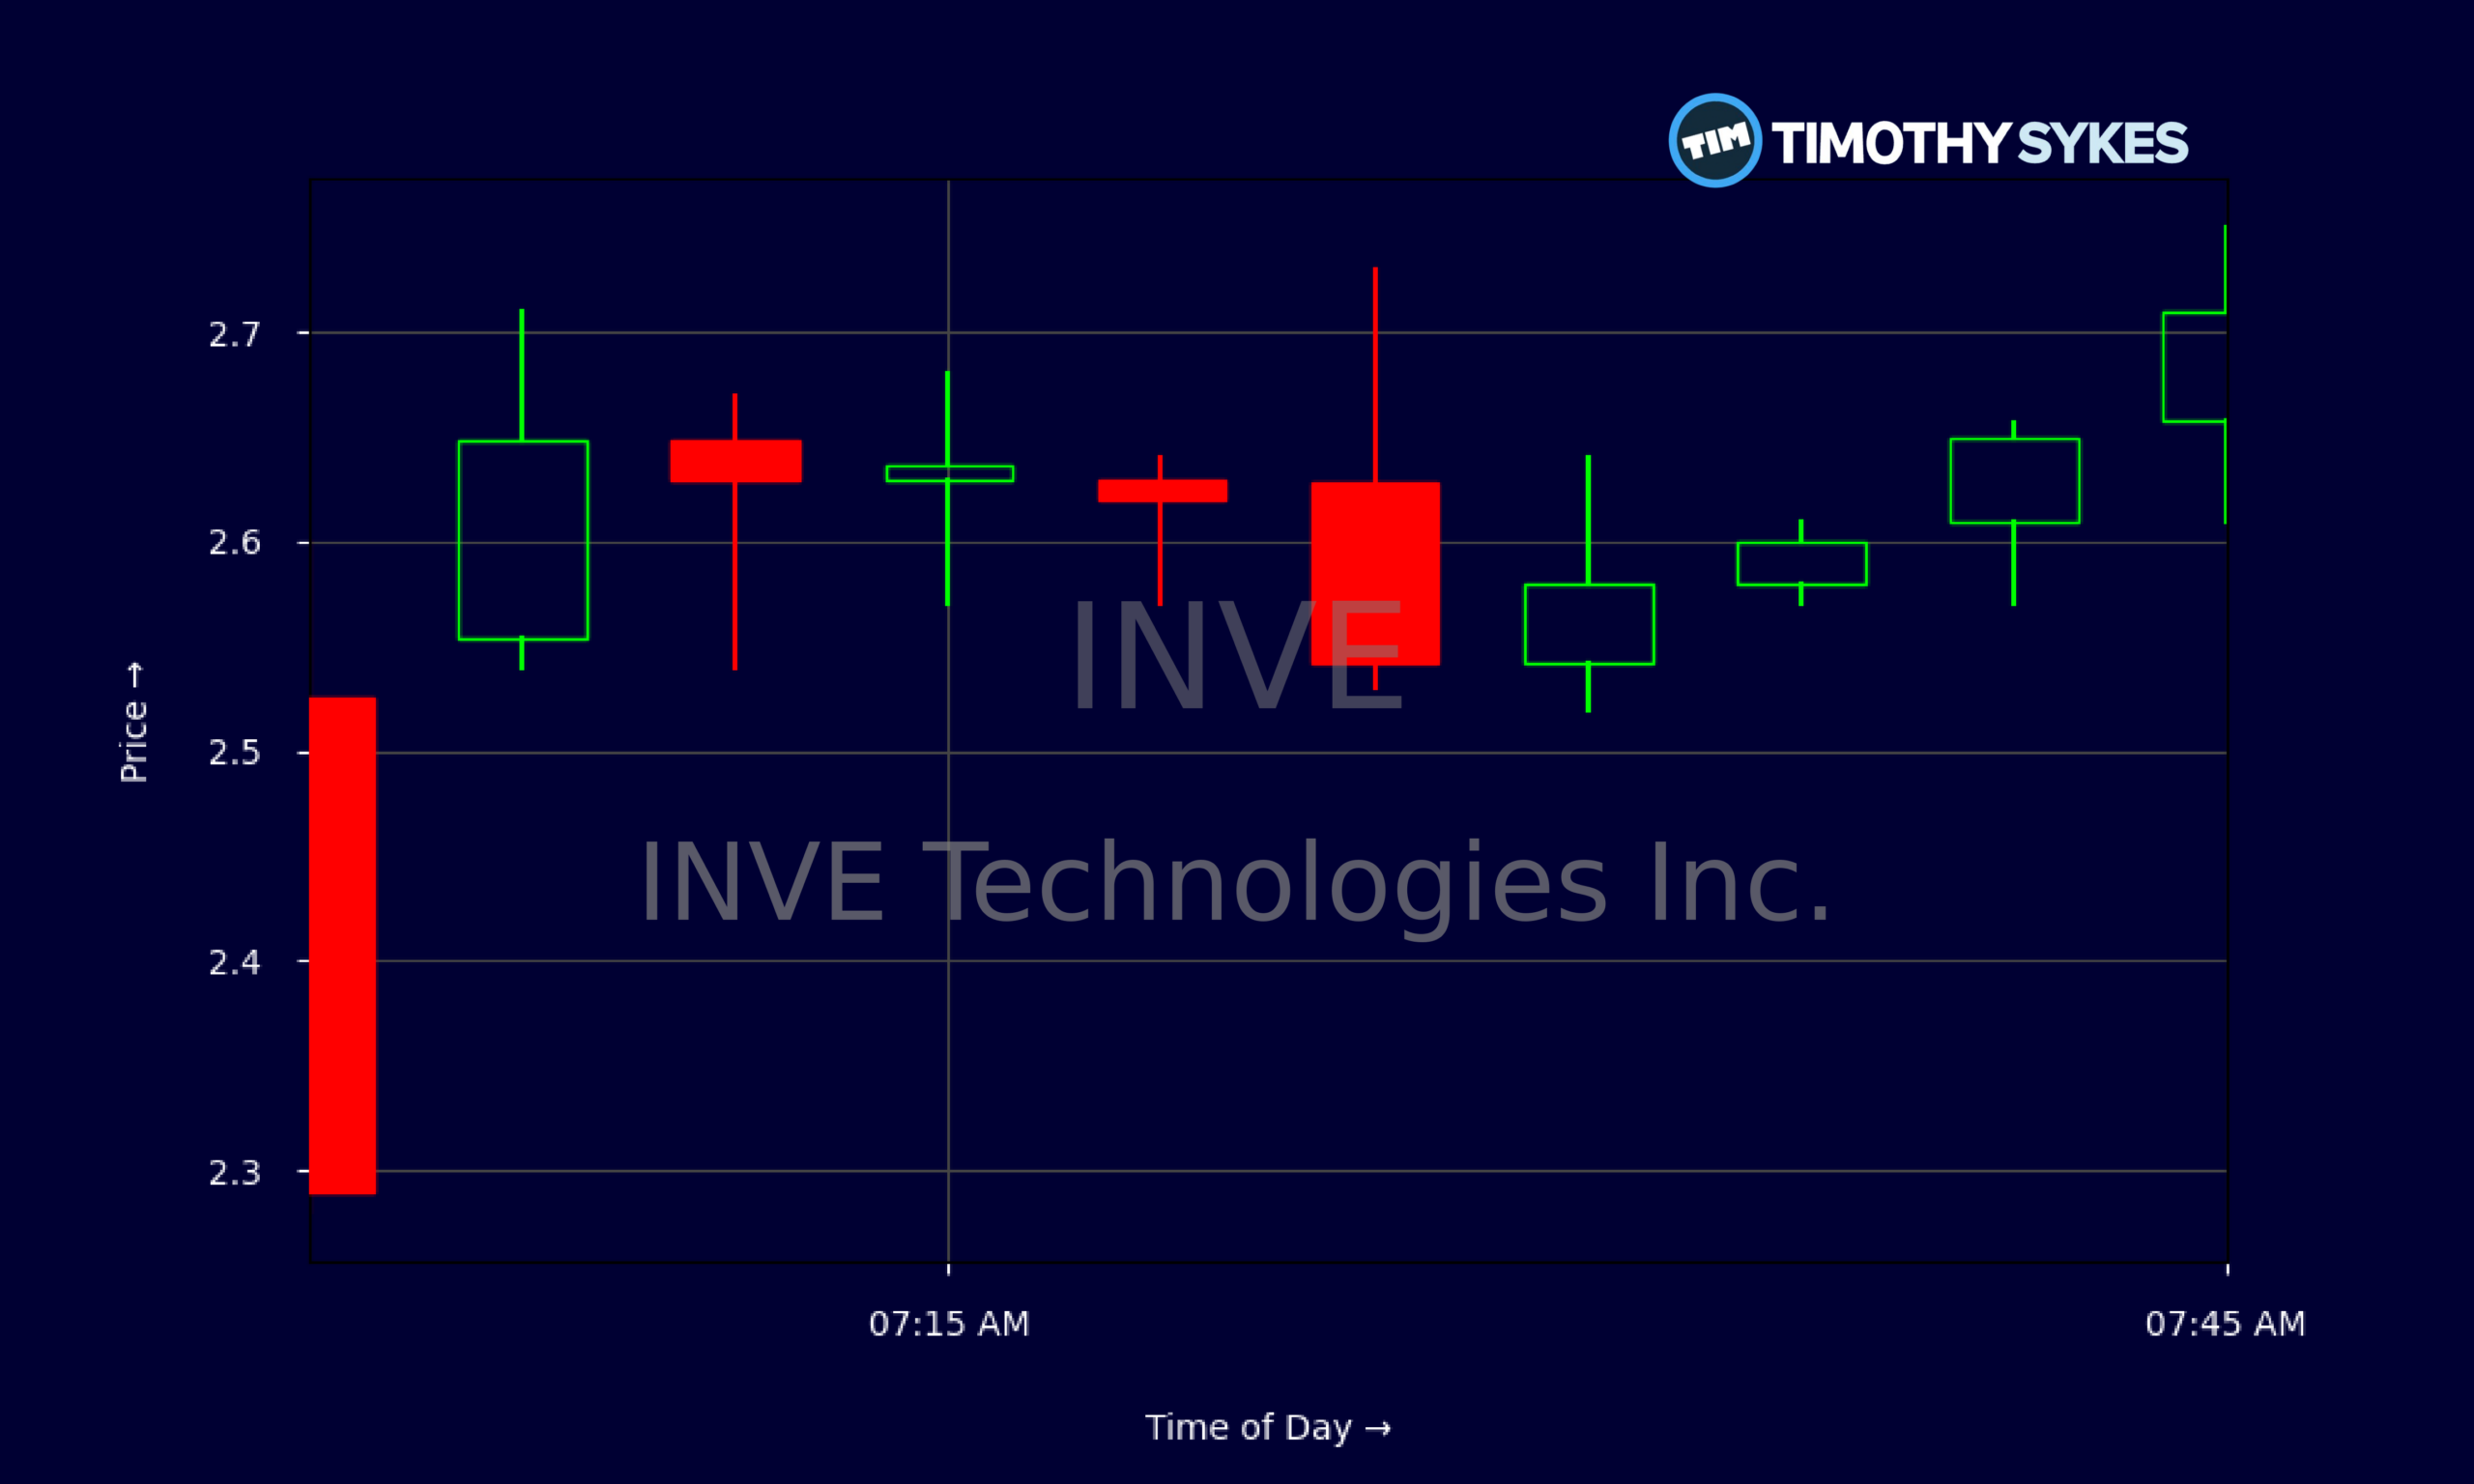
- Price action in INVE shows a slow grind lower on the daily chart while today’s intraday tape flashes a sharp bounce from the low $2s into the mid-$2.60s.
- The latest quarter shows INVE Technologies Inc. sitting on about $119M in cash with minimal debt, giving the company serious runway despite ongoing losses.
- Profitability remains weak at INVE, with negative margins and shrinking revenue, keeping it firmly in turnaround territory rather than steady-growth mode.
- Valuation screens cheap on book value for INVE, but traders still demand proof of execution before assigning a richer multiple.
- Short-term traders are watching whether INVE can build a base above recent lows and turn today’s intraday momentum into a sustained trend.
Live Update At 07:47:51 EDT: On Wednesday, October 21, 2026 INVE Technologies Inc. stock [NASDAQ: INVE] is trending up by 22.52%! Discover the key drivers behind this movement as well as our expert analysis in the detailed breakdown below.
Quick Financial Overview
INVE Technologies Inc. is a classic small-cap puzzle: strong balance sheet, weak earnings. The latest report shows about $21.5M in annualized revenue, yet the company is still losing money, with profit margins deeply negative. INVE posts an EBIT margin near -88% and a total profit margin around -60%, which tells traders the core business is far from breakeven.
At the same time, the balance sheet is surprisingly solid. INVE holds roughly $119M in cash against only about $0.4M in long-term debt. Current and quick ratios north of 18 mean liquidity is not the problem. For traders, that runway matters. It buys INVE time to restructure, refocus, or scale revenue without constant dilution pressure.
More Breaking News
Valuation looks low on paper. INVE trades at roughly 0.44 times book value, and price-to-sales near 2.4. Those numbers suggest the market is skeptical about the business turning that cash pile into real earnings. Until margins improve, most traders will treat INVE as a speculative turnaround, not a stable compounder.
Why Traders Are Watching INVE Price Action
The chart on INVE Technologies Inc. tells a story of quiet pressure and sudden bursts. On the daily chart, INVE has been sliding from the mid-$2.40s toward the low $2.20s over the past several sessions. Closes have drifted from about $2.39–$2.42 down to $2.22, showing sellers slowly taking control. This type of grind lower often wears out weak hands before any real move starts.
Today’s intraday action is more interesting. INVE opened near $2.29 and quickly ripped to around $2.60, then pushed as high as roughly $2.75 on 5‑minute candles before settling in the mid‑$2.60s. That’s a meaningful percentage spike off the open for a low-priced stock. For day traders, this is the kind of volatility that matters more than headlines. It shows there is still a responsive buyer base and potential for squeeze-style moves.
Underneath that tape, the fundamentals of INVE add context. The company’s revenue has shrunk over three and five years, and returns on equity and assets are negative on a trailing basis. Yet INVE still posts positive legacy ROE and ROA metrics, hinting that the business worked better in the past than it does right now. Combine that with the large cash balance and almost no leverage, and INVE starts to look like a restructuring or strategic optionality play.
For pattern-focused traders, this sets up a simple question: does INVE turn today’s spike into a higher-low structure on the daily, or does it fade back toward support near $2.20?
Conclusion
INVE Technologies Inc. sits in a strange but tradable spot. The company’s operations are not healthy yet — revenue is down, margins are deep in the red, and cash flow is negative. But INVE carries an unusually strong balance sheet for a stock near $2, with over $119M in cash and minimal debt. That combination keeps bankruptcy fears low while leaving room for management to chase a turnaround.
From a trading perspective, INVE offers what many small-cap hunters want: volatility layered on top of real numbers. The recent grind down on the daily chart shows supply in the $2.30–$2.40 zone, while today’s intraday spike reveals that buyers are still willing to step in aggressively when INVE gets too cheap. If price holds above the recent $2.20 area and starts carving out higher lows, momentum traders will pay closer attention.
For now, INVE Technologies Inc. remains a watchlist name rather than a conviction trend, driven more by technical setups than by fundamental strength. The key for active traders is to map clear levels, size small, and react to the chart instead of falling in love with the story. As millionaire penny stock trader and teacher Tim Sykes, says, “It’s not about how much money you make; it’s about how much money you keep.”. As Tim Sykes likes to say, “Trade like a sniper, not a machine gun — wait for your best setup, then strike fast and cut losses even faster.” INVE gives traders that kind of battlefield; the discipline is up to them.
This is stock news, not investment advice. Timothy Sykes News delivers real-time stock market news focused on key catalysts driving short-term price movements. Our content is tailored for active traders and investors seeking to capitalize on rapid price fluctuations, particularly in volatile sectors like penny stocks. Readers come to us for detailed coverage on earnings reports, mergers, FDA approvals, new contracts, and unusual trading volumes that can trigger significant short-term price action. Some users utilize our news to explain sudden stock movements, while others rely on it for diligent research into potential investment opportunities.
Dive deeper into the world of trading with Timothy Sykes, renowned for his expertise in penny stocks. Explore his top picks and discover the strategies that have propelled him to success with these articles:
- Penny Stocks Trading Guide
- Best Penny Stocks Under $1 to Buy Today
- Top 8 Penny Stocks to Watch on Robinhood
Once you’ve got some stocks on watch, elevate your trading game with StocksToTrade the ultimate platform for traders. With specialized tools for swing and day trading, StocksToTrade will guide you through the market’s twists and turns.
Dig into StocksToTrade’s watchlists here:





Leave a reply