

Hyperliquid Strategies Inc stocks have been trading up by 13.04 percent amid upbeat sentiment on its latest strategic expansion.
Key Takeaways
- PURR has pulled back from mid-teens highs to under $10, then bounced, creating a tradable range for active momentum trading.
- Hyperliquid Strategies Inc shows unusually strong margins and high returns on equity despite modest reported revenue.
- The balance sheet for PURR carries zero debt, heavy equity, and a huge liquidity cushion relative to current liabilities.
- Intraday PURR action shows sharp spikes and quick fades, favoring disciplined traders who cut losses fast.
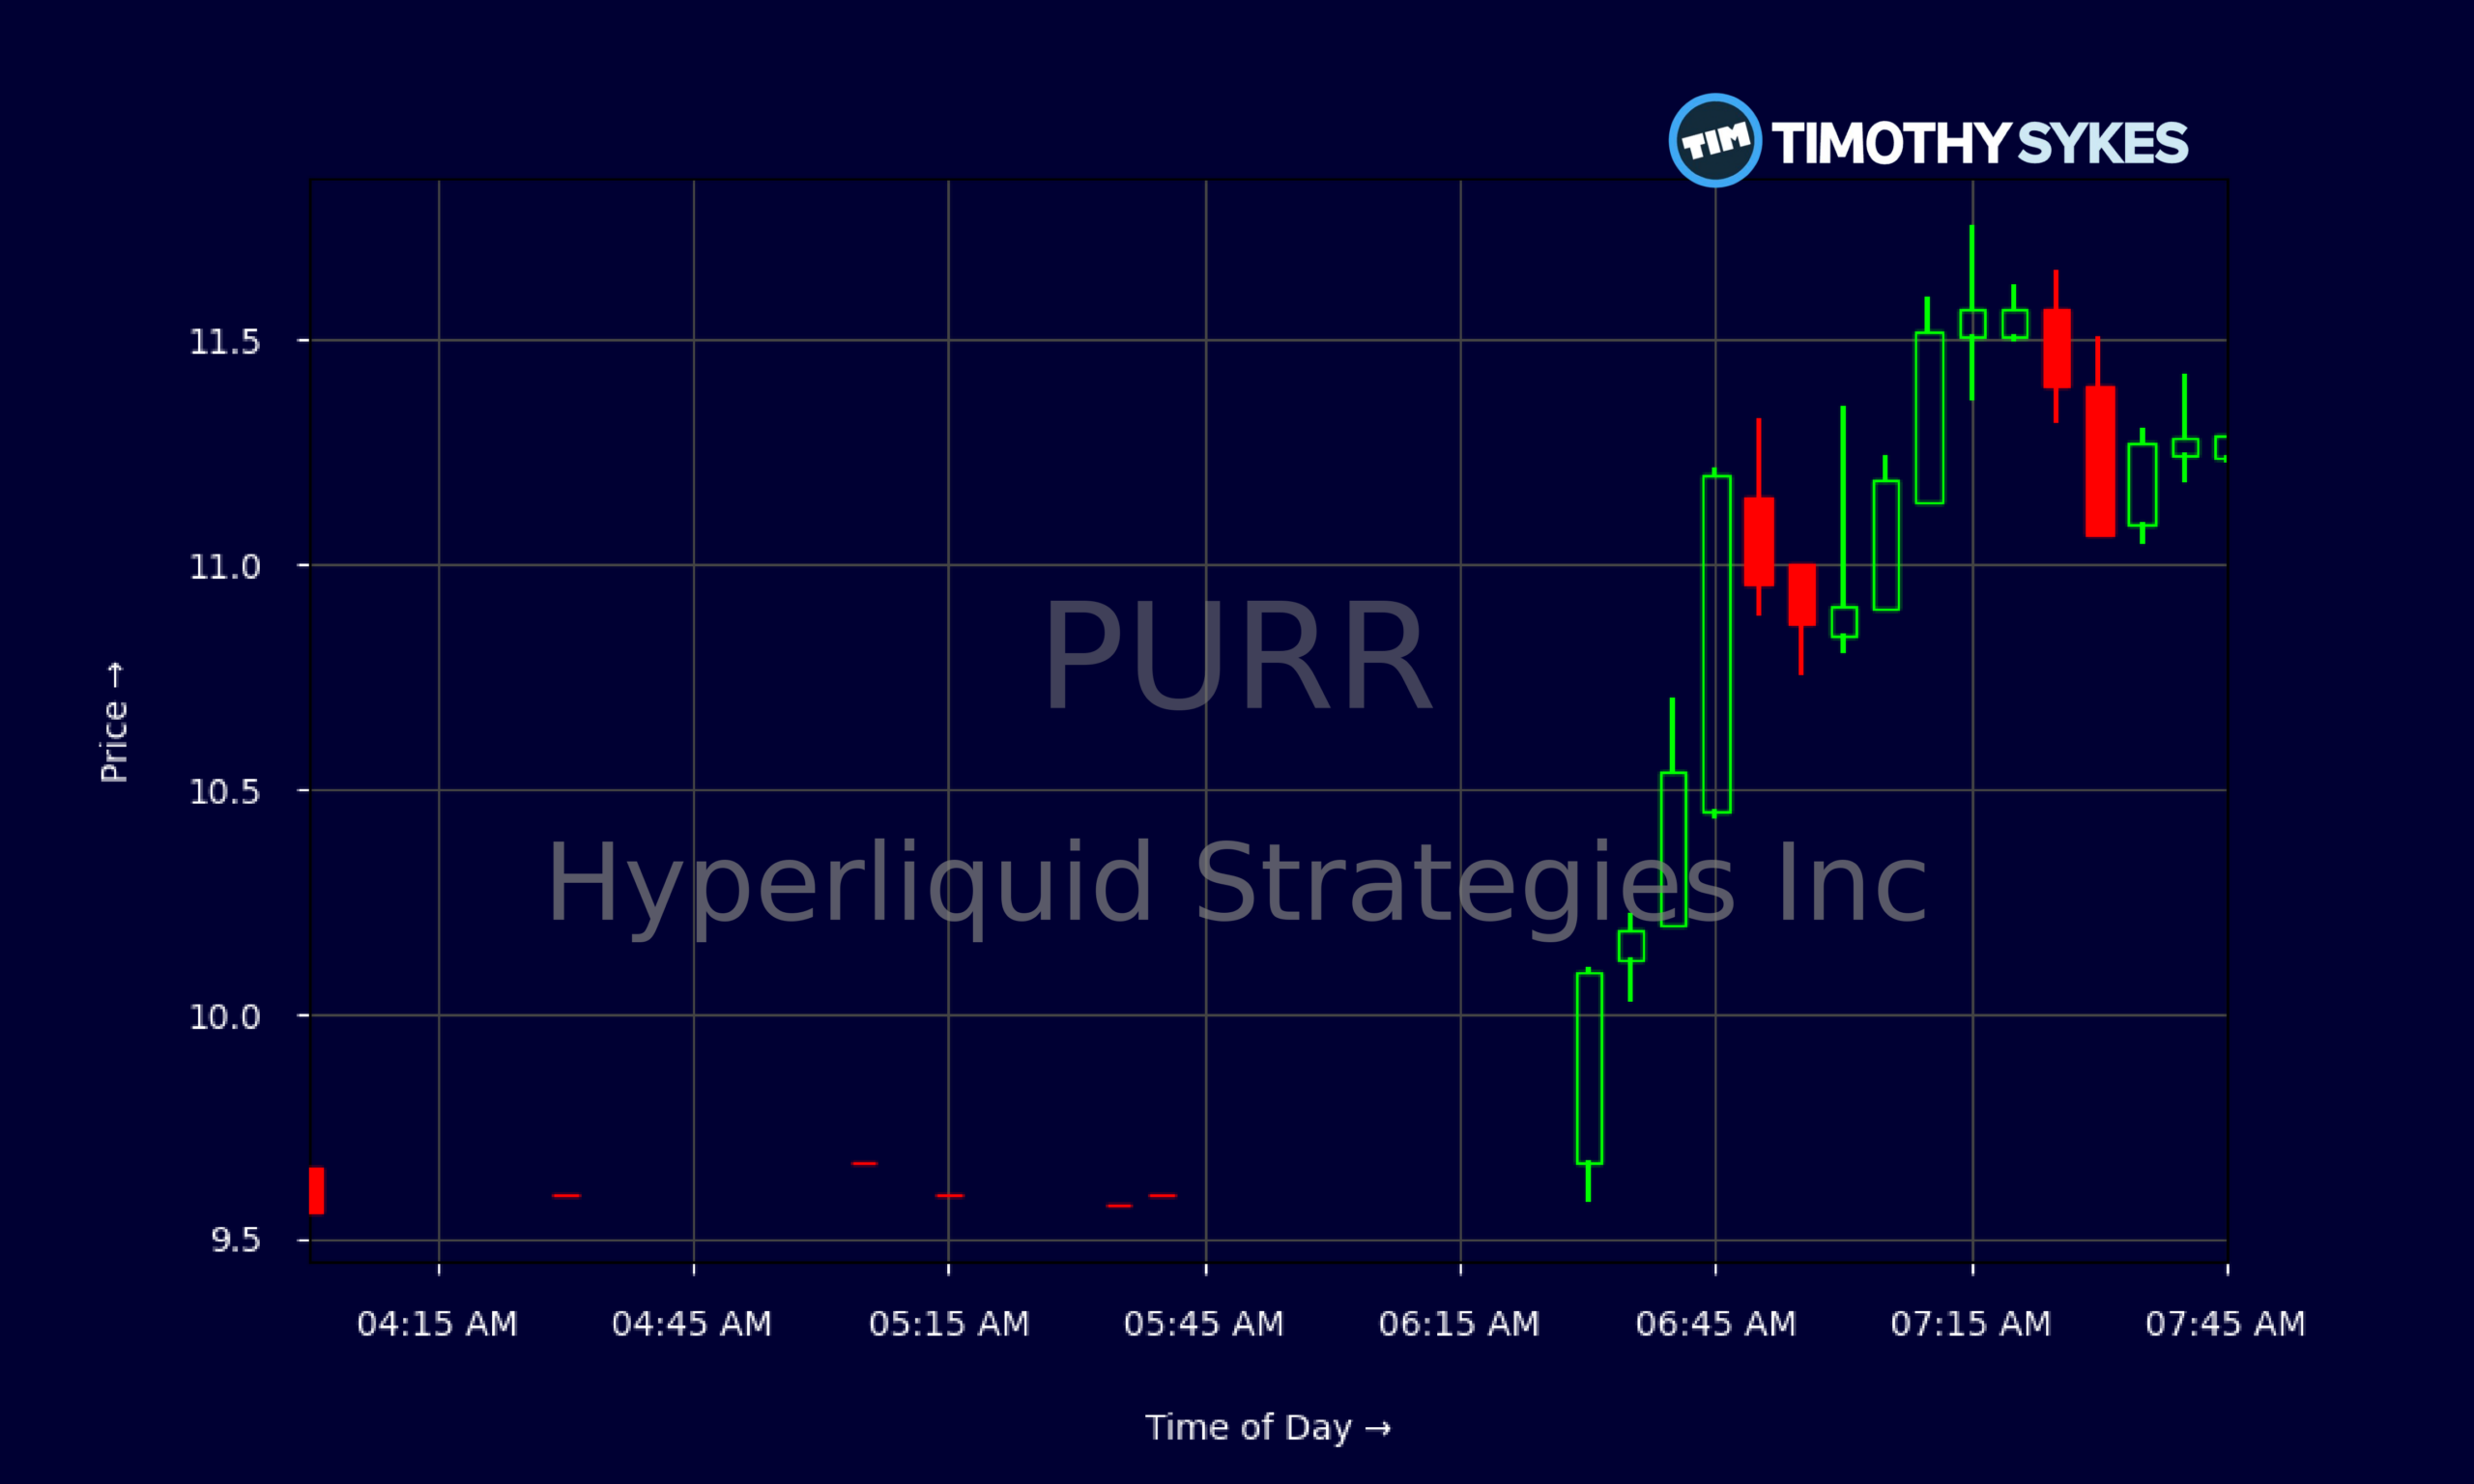
Live Update At 07:47:27 EDT: On Thursday, October 29, 2026 Hyperliquid Strategies Inc stock [NASDAQ: PURR] is trending up by 13.04%! Discover the key drivers behind this movement as well as our expert analysis in the detailed breakdown below.
Quick Financial Overview
PURR has the kind of numbers that make traders stop and stare. Hyperliquid Strategies Inc is posting eye‑popping profitability metrics: gross margin at 100%, EBIT margin above 100%, and profit margins that look more like a software giant than a small-cap name. On paper, PURR is turning relatively small revenue — about $9.46M — into serious earnings power, with return on equity near 60% and return on assets above 50%.
At the same time, the balance sheet is built like a tank. PURR shows roughly $2.06B in total assets, about $1.87B in equity, and only around $187M in liabilities. Hyperliquid Strategies Inc reports a current ratio over 40 and a quick ratio near 38, meaning cash and liquid assets massively cover short-term obligations.
More Breaking News
For traders, that means PURR is not a balance-sheet gamble; the real game is price and valuation. With a price-to-sales ratio around 989 and price-to-book north of 4, PURR trades more like a high-growth story than a sleepy value play. When expectations are this rich, any shift in sentiment can trigger fast, violent moves on the chart — exactly what short-term traders look for.
Why Traders Are Watching PURR Price Action
The recent PURR chart is a case study in volatility compressing, then trying to break again. Hyperliquid Strategies Inc traded as high as the low‑$13s in mid‑month, then slid into the high‑$8s and low‑$9s. That’s a big percentage reset, and it matters. When a name like PURR falls from $13 to under $9, trapped longs and hungry shorts battle for control, while nimble day traders look for clean intraday levels.
Over the latest sessions, PURR has stabilized in the upper‑$8 to high‑$9 band, with closes around $9.85–$9.97. Each day, Hyperliquid Strategies Inc has thrown off decent ranges — often 5–7% from low to high. That kind of movement is tradable if you respect your risk. PURR isn’t drifting; it’s actively probing support and resistance.
Zoom into the intraday tape and you see the character of PURR more clearly. Hyperliquid Strategies Inc pushed from the high‑$9s into the low‑$11s in early trading, with multiple five‑minute candles showing strong pushes followed by quick pullbacks. That’s classic breakout‑and‑stuff action. PURR rewards traders who buy strength near key levels and bail fast when it fails, not those who average down and “hope.”
What keeps PURR on watch lists is the combination of wild valuation, strong reported profitability, and clean liquidity. Hyperliquid Strategies Inc gives traders confidence it’s not a balance-sheet blow‑up, so more focus lands on momentum, crowd psychology, and short‑term pattern recognition. When PURR starts to trend, it can become a powerful vehicle for both long and short setups.
Conclusion
For active traders, PURR is less about story and more about structure. Hyperliquid Strategies Inc is flashing premium‑style margins, huge returns on capital, and a fortress‑like balance sheet. Yet PURR trades with the personality of a hot momentum name that has already run hard and then cooled off into a tight range. That tension — between strong fundamentals and stretched valuation — is exactly where sharp trading edges often live.
The current zone around the high‑$9s is key. If PURR can hold recent lows near the mid‑$8s and build higher lows, traders will eye a potential push back toward double digits and maybe a retest of the $11–$12 region. If Hyperliquid Strategies Inc loses those supports on volume, the downside air pocket can be just as fast. Either way, PURR is a chart you trade with a plan, not a wish.
As Tim Sykes likes to tell his students, “Always think risk first, reward second — surviving long enough to catch the best setups is the real edge.” As millionaire penny stock trader and teacher Tim Sykes, says, “Embrace the journey, the ups and downs; each mistake is a lesson to improve your strategy.”. Applied to PURR, that means defining tight risk levels, respecting intraday volatility, and never marrying Hyperliquid Strategies Inc as a long‑term hold just because the numbers look strong. Use PURR for what it currently offers — volatility, liquidity, and clear technical levels — and remember this is strictly for educational and research purposes, not advice to buy or sell.
This is stock news, not investment advice. Timothy Sykes News delivers real-time stock market news focused on key catalysts driving short-term price movements. Our content is tailored for active traders and investors seeking to capitalize on rapid price fluctuations, particularly in volatile sectors like penny stocks. Readers come to us for detailed coverage on earnings reports, mergers, FDA approvals, new contracts, and unusual trading volumes that can trigger significant short-term price action. Some users utilize our news to explain sudden stock movements, while others rely on it for diligent research into potential investment opportunities.
Dive deeper into the world of trading with Timothy Sykes, renowned for his expertise in penny stocks. Explore his top picks and discover the strategies that have propelled him to success with these articles:
- Penny Stocks Trading Guide
- Best Penny Stocks Under $1 to Buy Today
- Top 8 Penny Stocks to Watch on Robinhood
Once you’ve got some stocks on watch, elevate your trading game with StocksToTrade the ultimate platform for traders. With specialized tools for swing and day trading, StocksToTrade will guide you through the market’s twists and turns.
Dig into StocksToTrade’s watchlists here:





Leave a reply