

FTC Solar Inc. stocks have been trading up by 8.62 percent, surging on strong demand outlook and contract-win optimism.
Key Takeaways
- The New York Times reports that U.S. solar manufacturers are nearing commercialization of tandem panels with about 25% higher energy output, naming FTC Solar among companies positioned to benefit.
- FTC Solar amended its credit agreement, pushing a $5M principal payment to 2027 and suspending key covenants through 2026, boosting near‑term liquidity but highlighting balance sheet strain.
- The company scheduled its Q3 2026 earnings release and call, putting a hard date on the next fundamental catalyst for FTCI traders.
- Multiple Form 4s flagged insider or major‑holder changes in FTC Solar ownership, but with no detail on size, direction, or pricing, limiting trading insight.
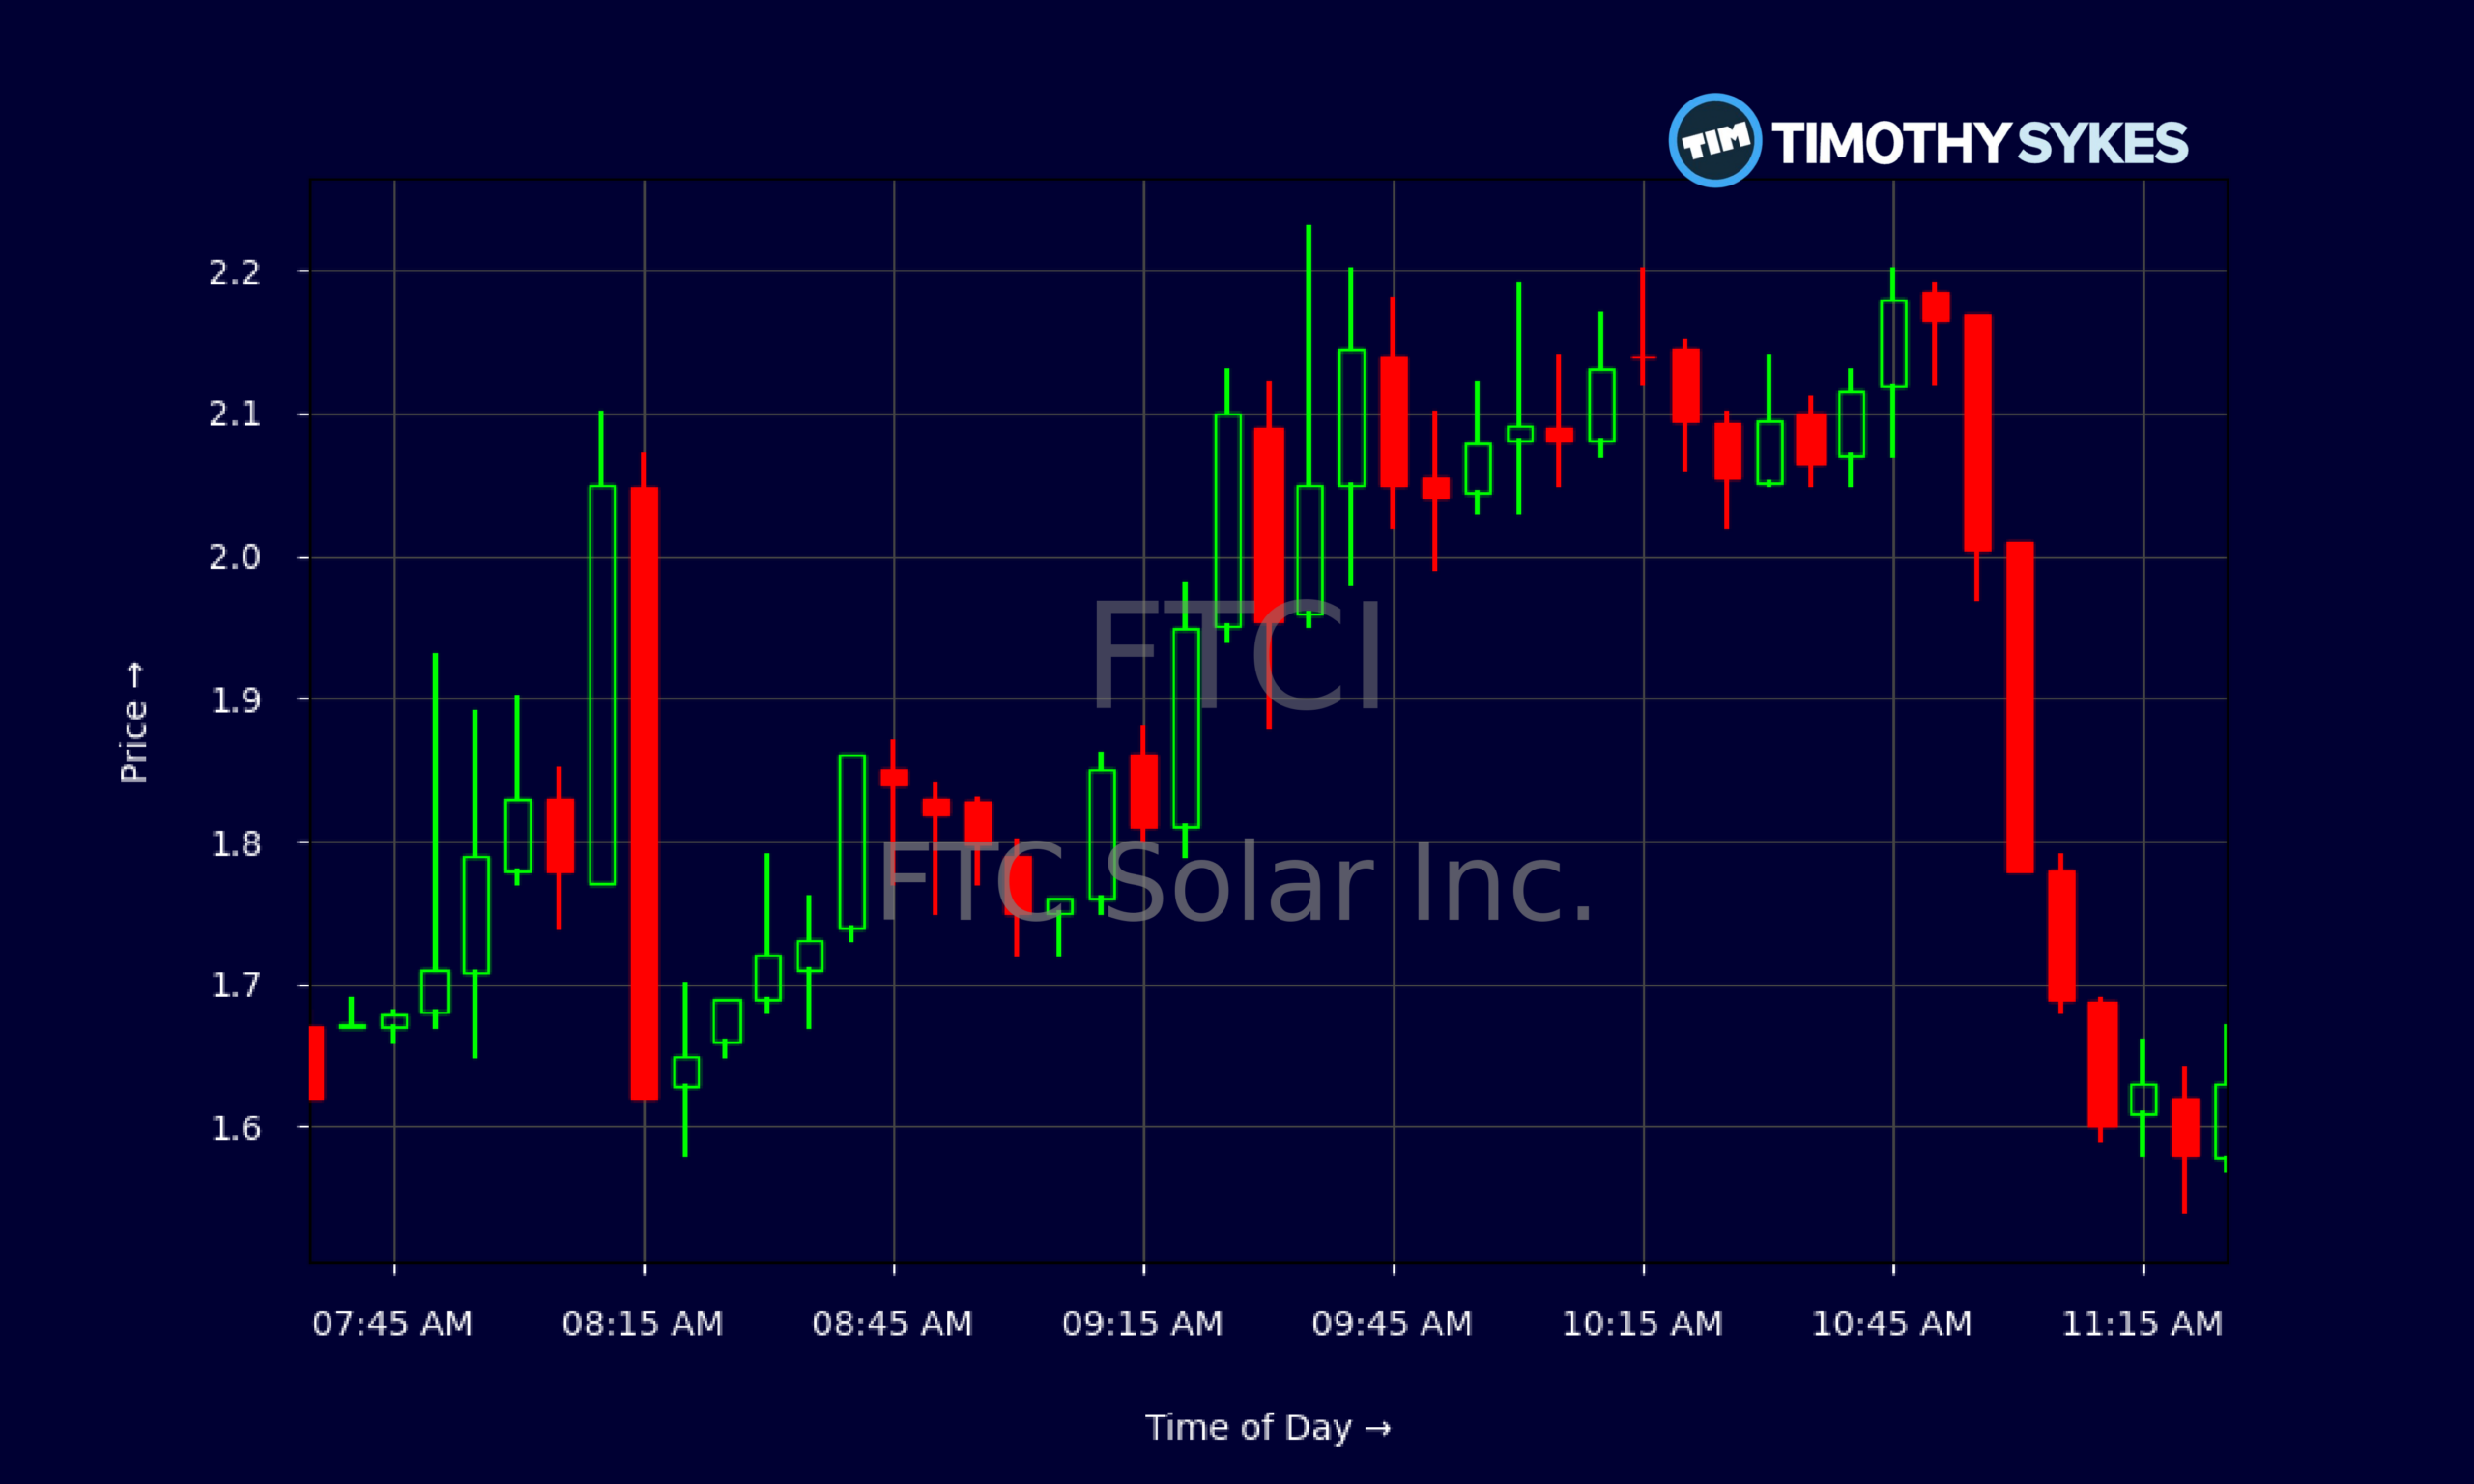
Live Update At 11:32:07 EST: On Wednesday, November 04, 2026 FTC Solar Inc. stock [NASDAQ: FTCI] is trending up by 8.62%! Discover the key drivers behind this movement as well as our expert analysis in the detailed breakdown below.
Quick Financial Overview
FTCI has been trading like a classic battleground small cap. On the daily chart, FTC Solar slid from $1.94 on 2026/10/12 to a recent close near $1.60 on 2026/11/04. That’s a meaningful drawdown in just a few weeks. The stock tried to spike over $2.20 intraday, then failed hard, leaving a long upper wick that shows aggressive selling pressure into strength.
Short‑term, FTCI is stuck in a tight range between roughly $1.30 and $1.70, with repeated fades on pushes above $1.60. For momentum traders, that says one thing: respect overhead supply. Intraday, the 5‑minute tape tells the same story. Pre‑market pops toward $2.10–$2.20 got slammed back under $1.70, then bled to around $1.60 by late morning. That’s weak follow‑through.
More Breaking News
Fundamentals back up the caution. FTC Solar posted about $26.2M in quarterly revenue but ran a gross loss, with gross margin around 3% and an operating loss of roughly $13.7M. Net loss was about $27.1M, and return on assets is a deeply negative -52% to -56% range. Liquidity is tight: current ratio 0.9, quick ratio 0.6, and working capital is negative. Traders watching FTCI need to treat this as a speculative, news‑driven chart, not a steady compounder.
Why Traders Are Watching FTCI Right Now
Despite the red ink, FTCI stays on a lot of watchlists because the macro story around solar is heating up again. The New York Times highlighted U.S. manufacturers moving toward tandem solar panels, which can deliver about 25% more energy than traditional designs. That kind of efficiency jump doesn’t just help panel makers. It can reshape entire project economics.
FTC Solar sits in the balance‑of‑system space with trackers, software, and engineering. If tandem tech goes mainstream, every marginal watt matters more, and so does precision tracking. The article explicitly listed FTC Solar among the names positioned to benefit from demand tied to more advanced module technology. For FTCI, that’s a structural tailwind narrative traders can latch onto on any strong green day.
At the same time, the credit amendment shows the other side of the trade. FTC Solar pushed a $5M principal repayment out to 2027 and got its financial covenants suspended for the rest of 2026. Cash and EBITDA tests only kick in down the road. That buys time and flexibility, which the market often rewards in the short term. But it also underlines that lenders were watching those covenants closely in the first place.
The upcoming Q3 2026 earnings date becomes critical in this context. Traders in FTCI will be looking for any signs that revenue is stabilizing, gross margins are improving from the current loss‑making levels, and backlog or order commentary supports the tandem‑panel tailwind story. Add in multiple Form 4 filings around insider or major‑holder ownership changes — with no clarity on whether they were buys or sells — and you get noise, not a clear signal. The real tell will be how price reacts into and out of that earnings call.
Conclusion
FTCI is a classic “story vs. balance sheet” setup. On one side, FTC Solar has clear exposure to long‑term themes like tandem solar panels, U.S. manufacturing, and higher‑efficiency utility‑scale projects. Being named in a major outlet alongside bigger solar players reinforces that FTC Solar is in the conversation when traders scan for sector sympathy plays and potential multi‑day runners.
On the other side, the numbers are tough. FTCI is losing money at the net and operating lines, carrying negative equity, and running with a sub‑1.0 current ratio. The amended credit deal — deferring that $5M payment and relaxing covenants through 2026 — gives FTC Solar breathing room, but it also reminds traders that the clock is ticking. At some point, margins and cash flow must improve enough to satisfy those looser 2027 tests.
For active traders, the playbook is straightforward: treat FTCI as a high‑volatility, catalyst‑driven name where risk control matters more than the story. That means respecting the idea that, as millionaire penny stock trader and teacher Tim Sykes, says, “Small gains add up over time; focus on building wealth gradually, not chasing jackpots.”. Watch the Q3 2026 earnings call, tape action around any tandem‑tech headlines, and how the stock behaves near key levels like $1.30 support and the low‑$2 area resistance. As Tim Sykes likes to say, “the pattern is your edge — the story is just the excuse for the move.” FTC Solar’s story is real, but the chart still has to confirm it.
This is stock news, not investment advice. Timothy Sykes News delivers real-time stock market news focused on key catalysts driving short-term price movements. Our content is tailored for active traders and investors seeking to capitalize on rapid price fluctuations, particularly in volatile sectors like penny stocks. Readers come to us for detailed coverage on earnings reports, mergers, FDA approvals, new contracts, and unusual trading volumes that can trigger significant short-term price action. Some users utilize our news to explain sudden stock movements, while others rely on it for diligent research into potential investment opportunities.
Dive deeper into the world of trading with Timothy Sykes, renowned for his expertise in penny stocks. Explore his top picks and discover the strategies that have propelled him to success with these articles:
- Penny Stocks Trading Guide
- Best Penny Stocks Under $1 to Buy Today
- Top 8 Penny Stocks to Watch on Robinhood
Once you’ve got some stocks on watch, elevate your trading game with StocksToTrade the ultimate platform for traders. With specialized tools for swing and day trading, StocksToTrade will guide you through the market’s twists and turns.
Dig into StocksToTrade’s watchlists here:





Leave a reply