

Ford Motor Company stocks have been trading down by -3.1 percent following weak EV demand and costly labor disruptions.
Key Takeaways
- Shares of Ford Motor Company dropped about 2% to $11.66 after Q3 earnings and guidance, showing traders were disappointed with the outlook.
- Major banks including Morgan Stanley, Deutsche Bank, Goldman Sachs, and BofA all cut price targets on F in October while keeping cautious, non‑bullish ratings.
- Goldman Sachs flagged weak Chinese demand, tougher Chinese competition, and higher input costs as margin risks for F and trimmed 2026 EBIT and EPS estimates.
- BofA lowered 2027 earnings forecasts and Q3 EBIT estimates for Ford after supplier problems disrupted high‑margin F‑Series truck production.
- European registrations for F tumbled 16.6% year over year in September, badly trailing a 9.3% rise in the broader EU market that is tilting toward battery‑electric vehicles.
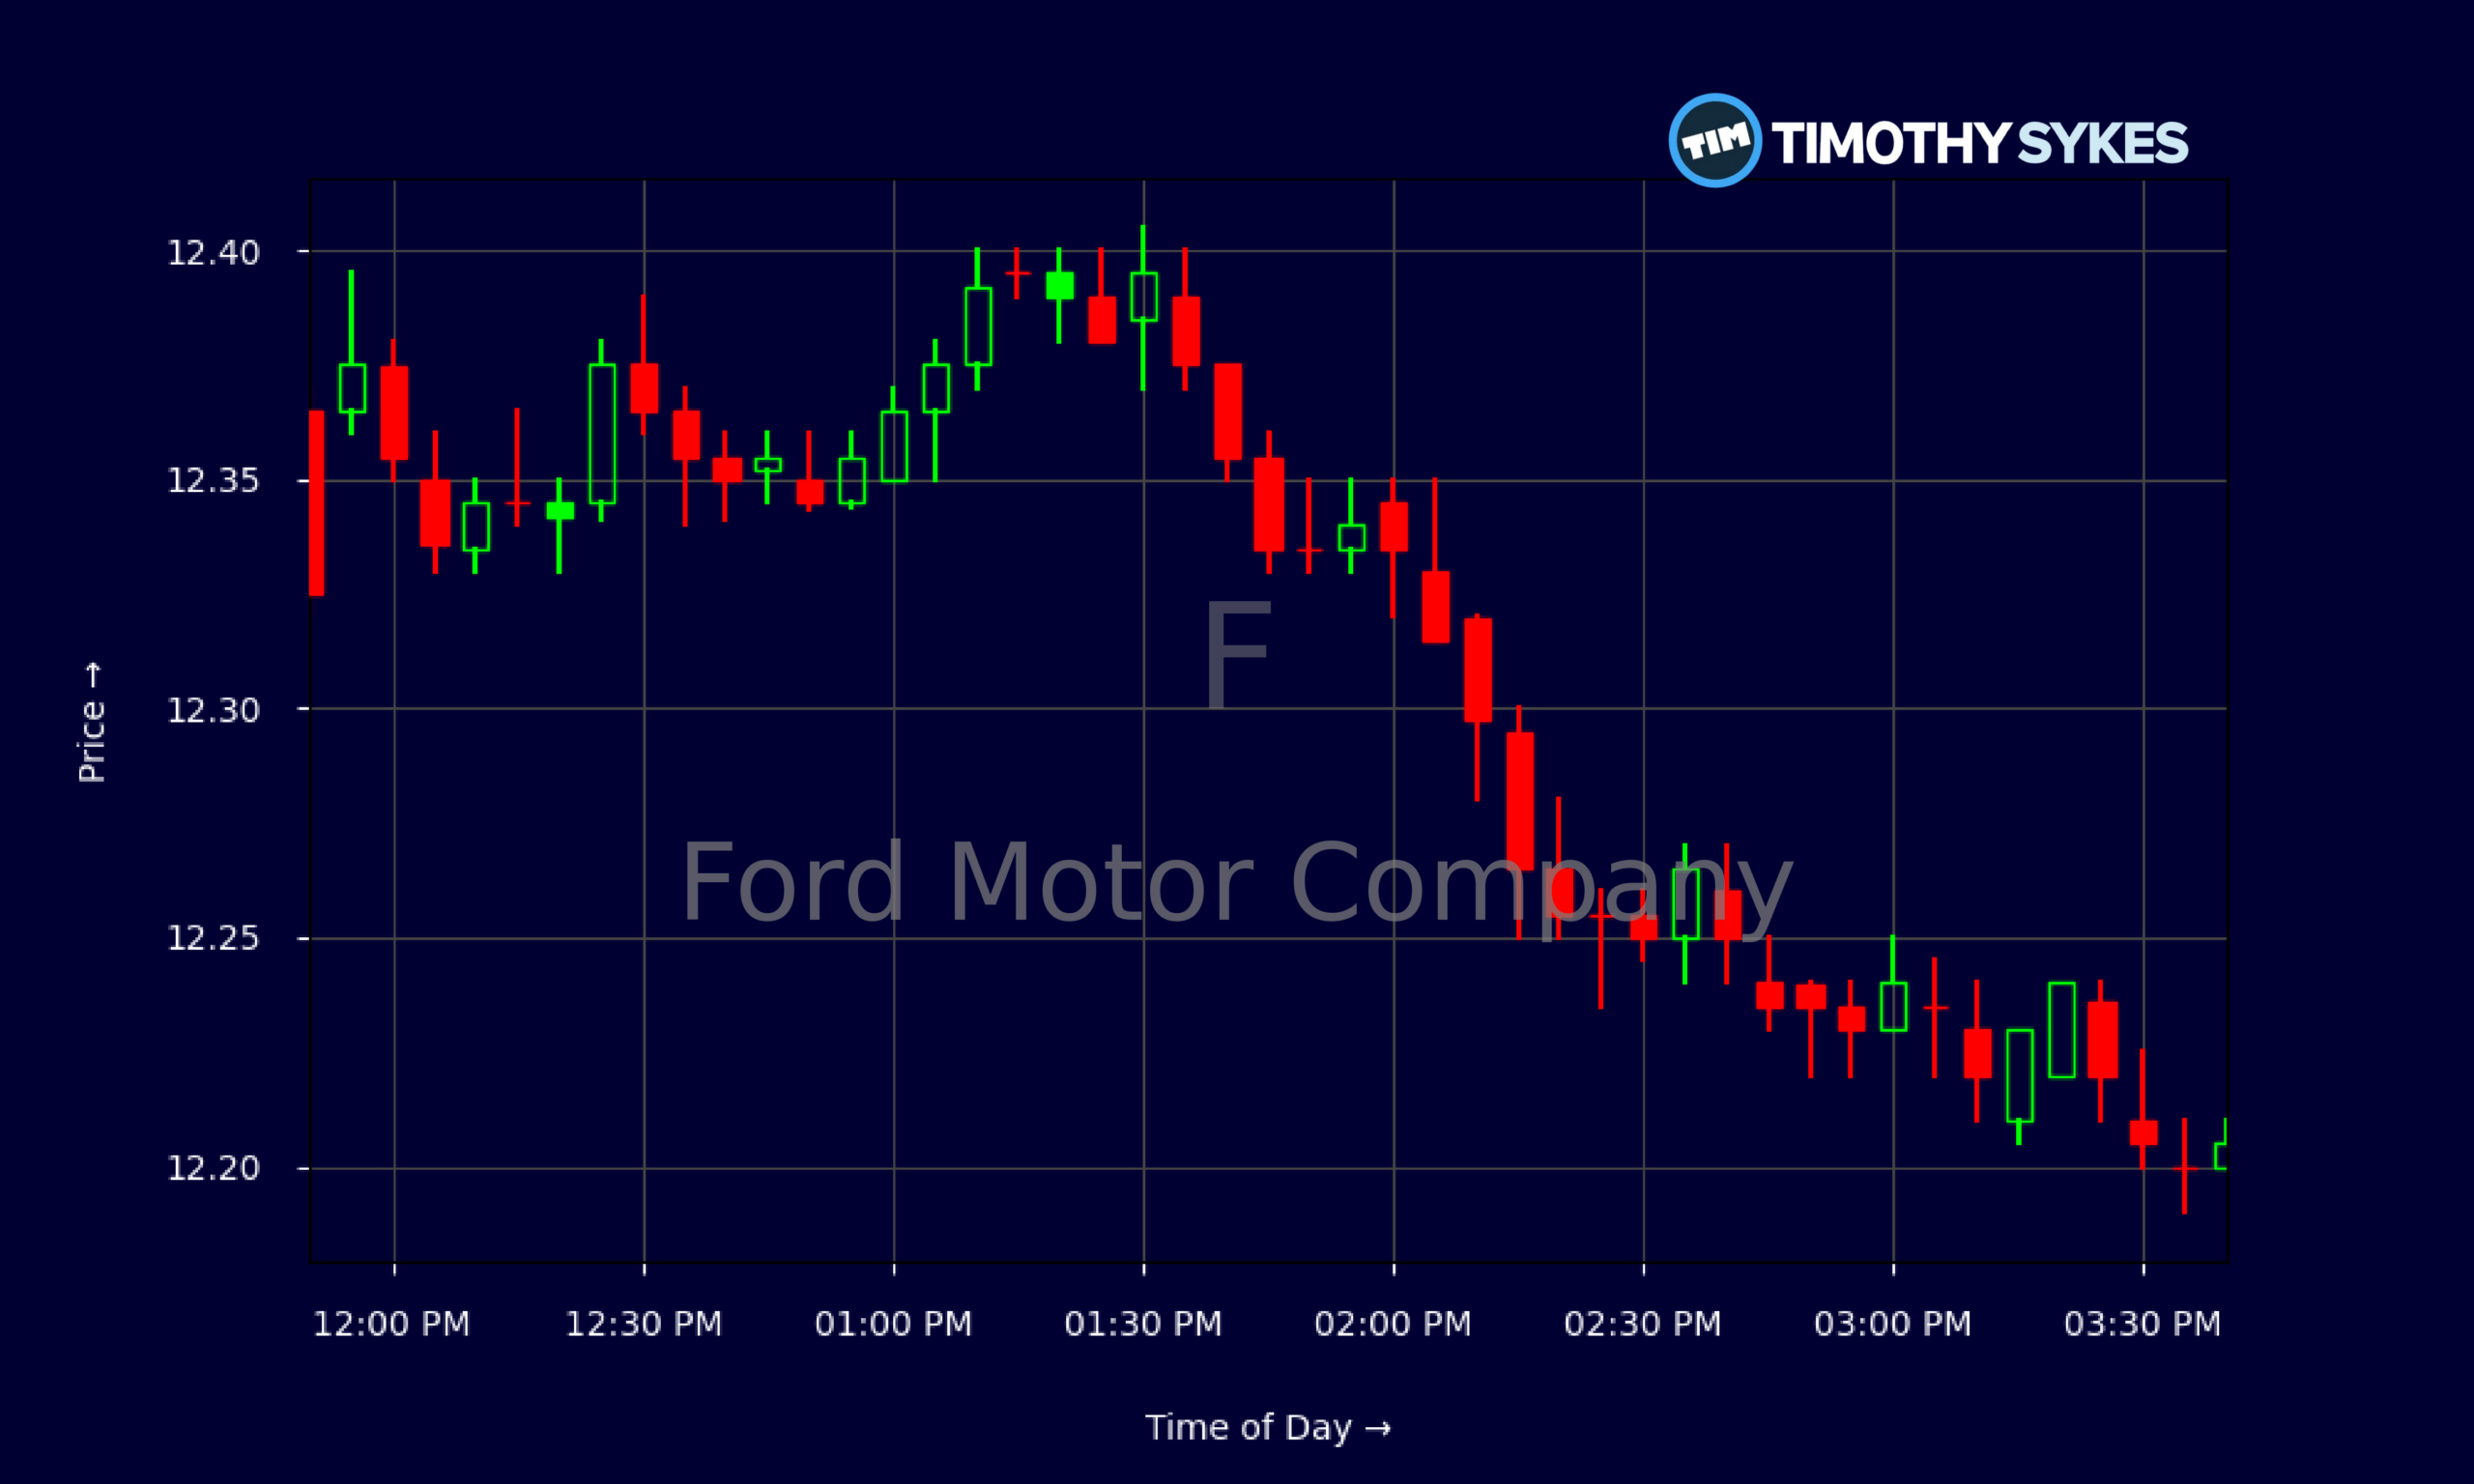
Live Update At 15:46:39 EST: On Tuesday, November 03, 2026 Ford Motor Company stock [NYSE: F] is trending down by -3.1%! Discover the key drivers behind this movement as well as our expert analysis in the detailed breakdown below.
Quick Financial Overview
Ford Motor Company is trading like a tired large‑cap. The recent close around $12.215 puts F only modestly above the post‑earnings level of $11.66, even after several sessions of choppy trading. Over the past few weeks, daily candles show F largely pinned between $11.60 and $12.60, telling traders this is a range‑bound name, not a momentum rocket.
Intraday, the 5‑minute chart on F shows a slow bleed from the $12.60 open into the low $12.20s, with very tight price action. That kind of grind lower usually signals supply overwhelming demand, but without panic. Day traders in F are dealing with pennies, not explosive moves.
More Breaking News
Under the hood, Ford just printed about $49.5B in quarterly revenue and $2.049B in net income, with diluted EPS around $0.50. Gross margin near 9% on that quarter (about $4.53B gross profit) is thin compared to tech, but typical for autos. The company throws off solid cash — roughly $5.4B in operating cash flow and $3.1B in free cash flow — yet key return metrics like recent ROE are negative, reflecting restructuring and pressure on profitability. For traders, F screens as a cash‑generating, heavily leveraged cyclical name stuck in a sideways tape while the Street reassesses its long‑term earnings power.
Why Traders Are Watching Ford Now
The catalyst for the latest leg lower in F was Q3 earnings and guidance. After the report, Ford Motor Company shares slid about 2% to $11.66 as traders reacted to the updated outlook. The message from the tape was clear: the market is not buying Ford’s near‑term story at face value.
At the same time, the Street has turned more cautious. Morgan Stanley cut its F price target from $14 to $13, keeping an Equal Weight rating. That’s trader code for “we don’t see big upside from here.” Deutsche Bank trimmed its target from $16 to $15 ahead of Q3 while maintaining a Hold, another sign that big money desks want to wait rather than chase.
Goldman Sachs went further, taking its Ford Motor Company target down from $16 to $14 and cutting 2026 EBIT and EPS estimates. The firm pointed directly at weak Chinese demand, rising Chinese automaker competition, and higher input costs. That combination is dangerous for a legacy player like F because it squeezes margins just as the company spends heavily on electrification and software.
BofA Securities echoed the concern, nudging its target on F down to $19 from $20 and lowering 2027 earnings estimates. The big worry there: supplier issues hitting F‑Series production, one of Ford’s profit centers. When your high‑margin trucks stumble, the model breaks fast.
Macro and regional trends are piling on. F is seeing Q3 U.S. sales softness in an environment of cost inflation and flat production expectations into 2027. In Europe, Ford Motor Company looks even weaker, with registrations down 16.6% year over year in September while the EU market rose 9.3% and leaned harder into EVs. That underperformance tells traders that F is losing share right where the industry is pivoting.
Layer on the CEO’s long‑term plan to boost sales roughly 20% by 2032 to about 5 million vehicles annually. Ambitious, but the stock still fell 1.3% on that day. The market is hearing the promise but pricing in execution risk.
Conclusion
For active traders, Ford Motor Company is a classic battleground name. F has real revenue scale, strong free‑cash generation this quarter, and a long history of surviving ugly cycles. Yet the stock’s slide after Q3, the cluster of price‑target cuts, and weak registration data show that the market sees more headwinds than tailwinds right now.
Analysts from Morgan Stanley, Deutsche Bank, Goldman Sachs, and BofA are not screaming “disaster” on F, but they are quietly walking down expectations. Targets in the $13–$19 range bracket the current price and imply limited upside unless Ford Motor Company proves it can protect margins, fix F‑Series production snags, and regain momentum in China and Europe. Until that happens, rallies in F are likely to meet selling from traders who were waiting to exit on strength.
The chart backs that view. F is stuck in a tight band around $12, with intraday action favoring controlled fades rather than breakouts. Range traders may lean on those levels, while breakout traders will likely stay patient and wait for a clean catalyst.
As Tim Sykes likes to say, “The market doesn’t care about your hopes, only your plan.” As millionaire penny stock trader and teacher Tim Sykes, says, “It’s not about how much money you make; it’s about how much money you keep.”. With Ford Motor Company, that means respecting the current downbeat sentiment, tracking every earnings revision, and being ready to cut losses fast if the story keeps slipping. This coverage is for educational and research purposes only and is not investment advice.
This is stock news, not investment advice. Timothy Sykes News delivers real-time stock market news focused on key catalysts driving short-term price movements. Our content is tailored for active traders and investors seeking to capitalize on rapid price fluctuations, particularly in volatile sectors like penny stocks. Readers come to us for detailed coverage on earnings reports, mergers, FDA approvals, new contracts, and unusual trading volumes that can trigger significant short-term price action. Some users utilize our news to explain sudden stock movements, while others rely on it for diligent research into potential investment opportunities.
Dive deeper into the world of trading with Timothy Sykes, renowned for his expertise in penny stocks. Explore his top picks and discover the strategies that have propelled him to success with these articles:
- Penny Stocks Trading Guide
- Best Penny Stocks Under $1 to Buy Today
- Top 8 Penny Stocks to Watch on Robinhood
Once you’ve got some stocks on watch, elevate your trading game with StocksToTrade the ultimate platform for traders. With specialized tools for swing and day trading, StocksToTrade will guide you through the market’s twists and turns.
Dig into StocksToTrade’s watchlists here:





Leave a reply