
ClearOne Inc. stocks have been trading up by 52.6 percent amid heightened investor optimism from the most impactful recent news.
Market Insights For Active CLRO Traders
- Strong intraday surge lifted CLRO from under $2 to above $4 before closing near $3, showing aggressive short-term buying interest.
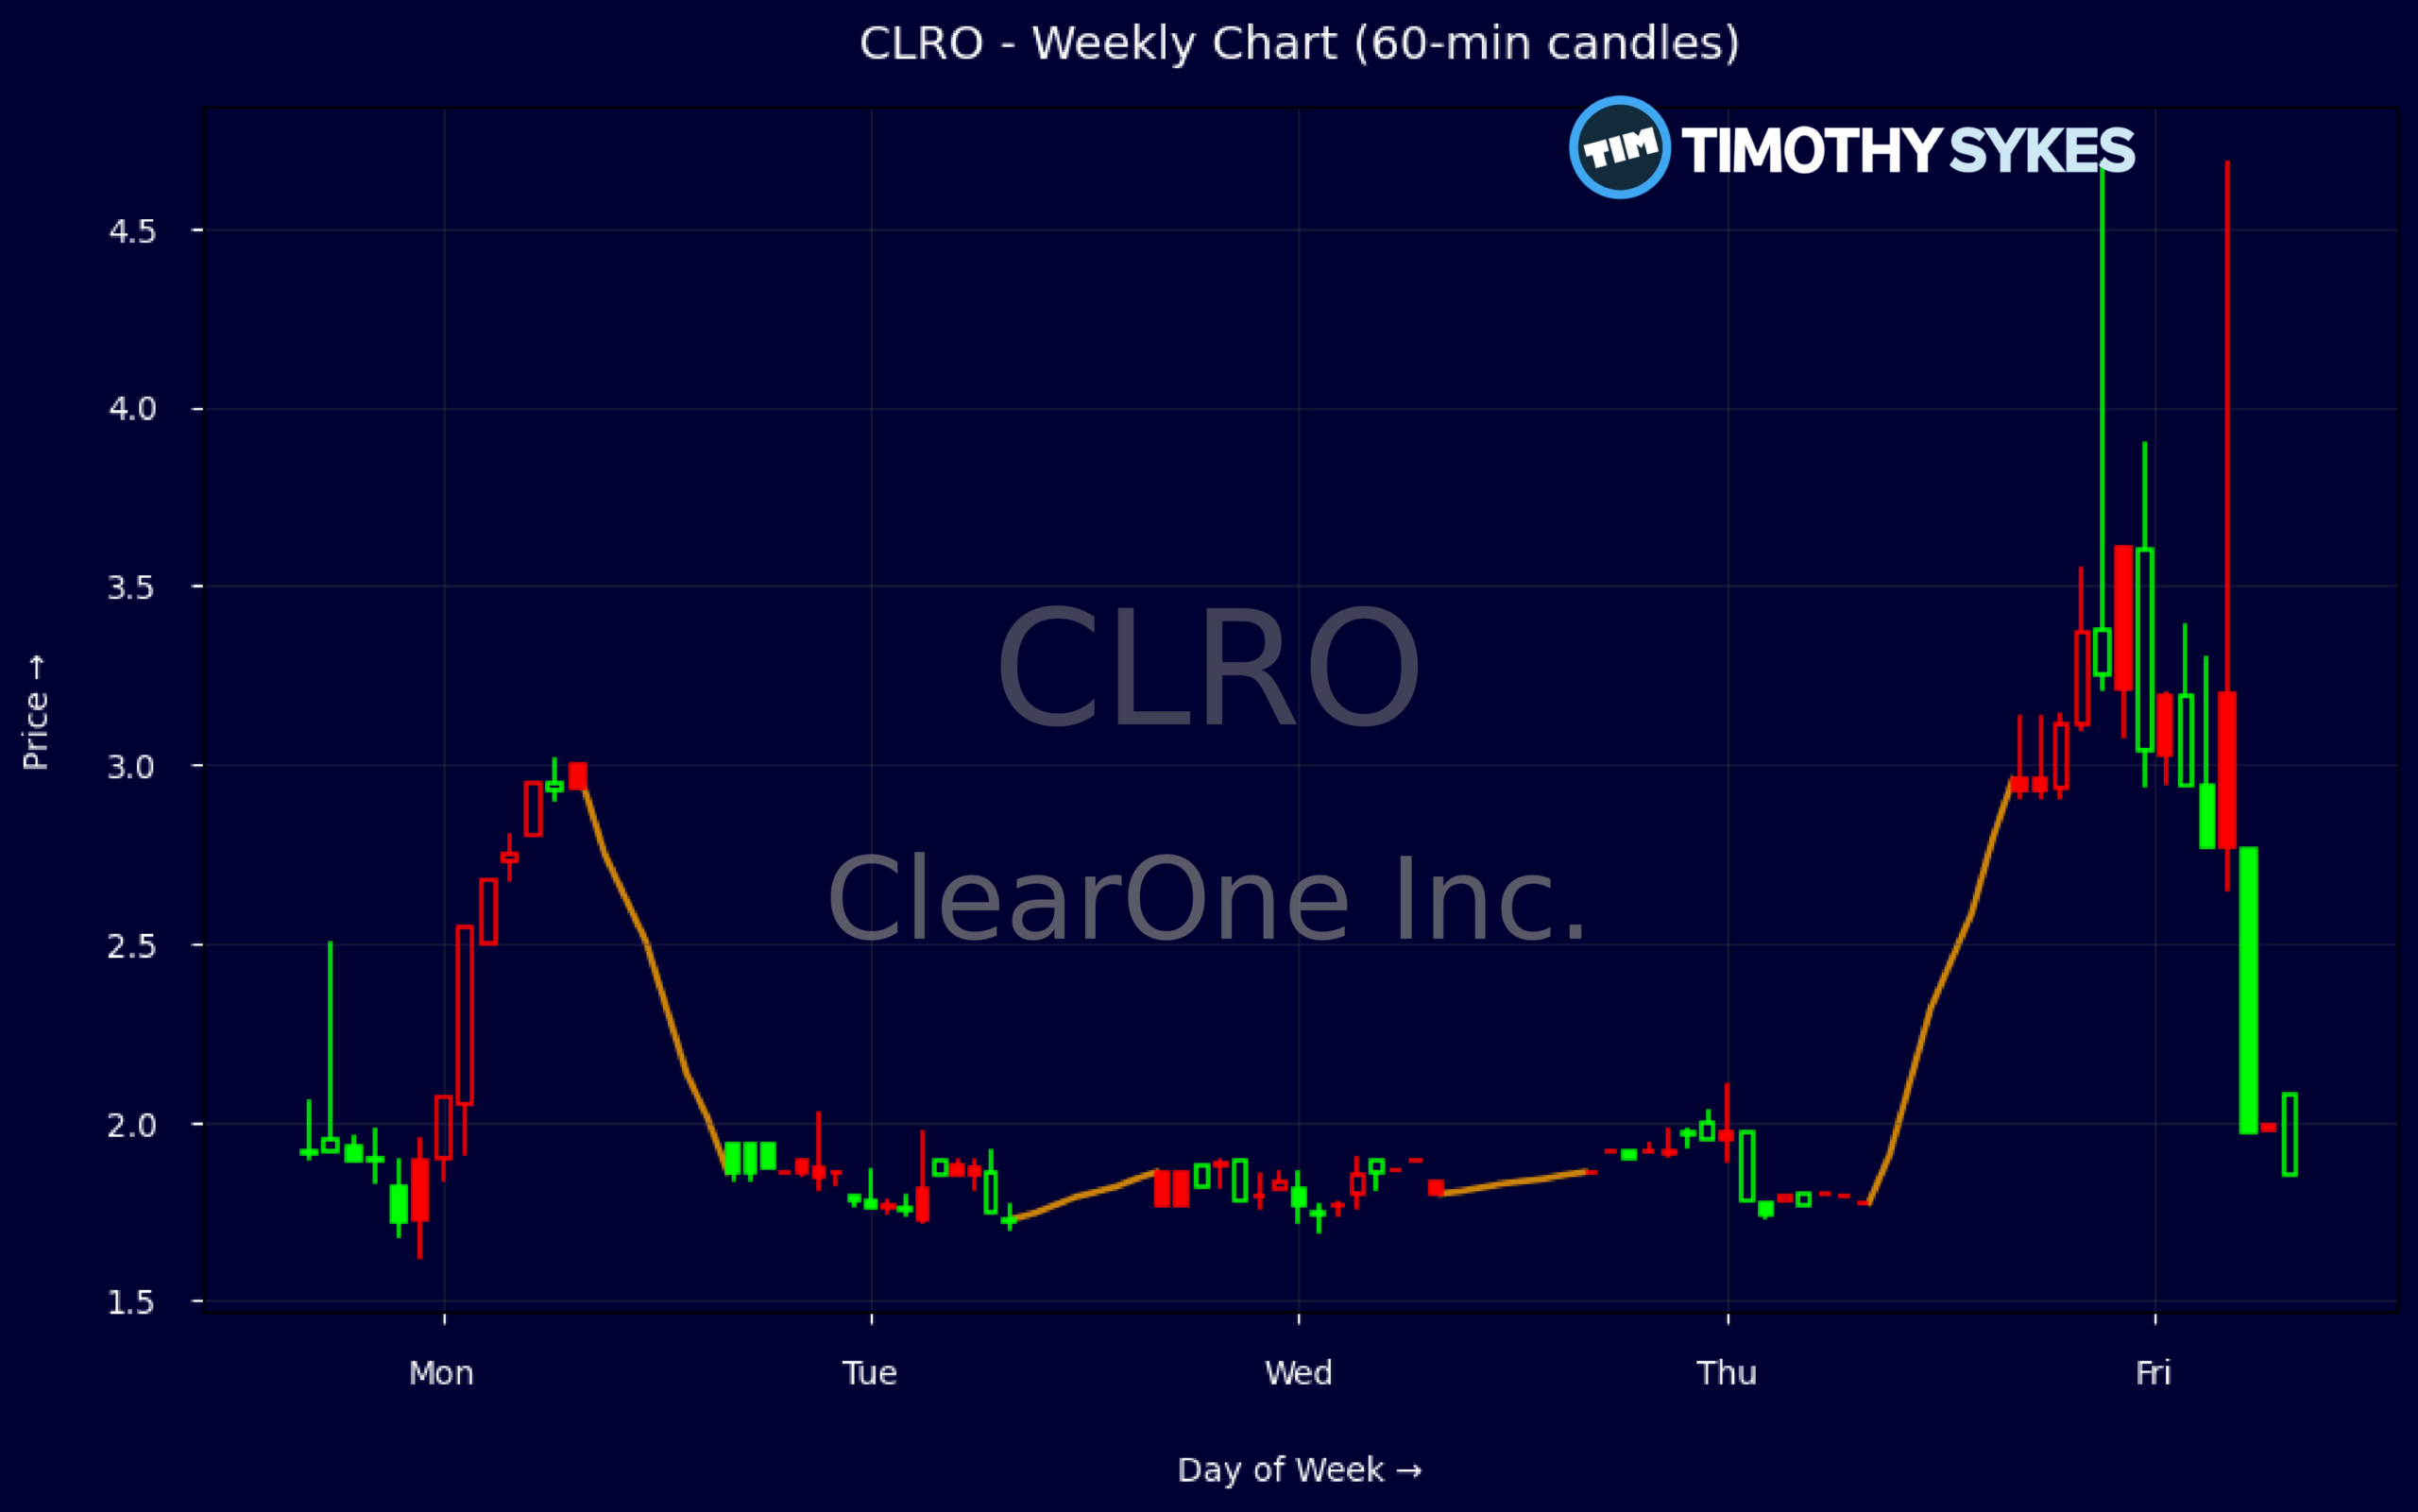
- Weekly chart shows a sharp breakout from a slow, tight range, turning a quiet stock into a momentum candidate.
- Financials reveal ongoing losses and negative equity, signaling a high-risk balance sheet backdrop for any trade.
- Cash burn and reliance on short-term debt mean ClearOne Inc. remains fundamentally fragile despite recent price strength.
Weekly Update Oct 19 – Oct 23, 2026: On Saturday, October 24, 2026 ClearOne Inc. stock [NASDAQ: CLRO] is trending up by 52.6%! Discover the key drivers behind this movement as well as our expert analysis in the detailed breakdown below.
Technology industry expert:
Analyst sentiment – negative
ClearOne (CLRO) is a micro‑cap audio/video communications vendor with distressed fundamentals and no durable competitive moat. Negative equity (book value per share −$0.14, price‑to‑tangible book −27x) and deeply negative ROE (about −276%) signal severe value destruction. Q2 FY26 results show gross profit slightly negative, operating loss of roughly $0.9M, and free cash flow at −$0.17M despite a $0.5M debt raise. Liquidity is thin (current ratio 1.1, quick ratio 0.1) with only $75K cash against $500K current debt, leaving balance‑sheet risk elevated and optionality limited.
Technically, CLRO was range‑bound near $1.80–1.95 before an extreme volatility spike on 10/23, with a high at $4.68 and close at $2.93 on heavy volume and intraday 5‑minute candles showing aggressive wick rejections above $3.25. The dominant trend remains structurally bearish, punctuated by low‑float squeeze dynamics rather than sustainable accumulation. For trading, $3.00 is a critical pivot: it is the near‑term resistance and a clear level to fade strength with tight risk controls unless volume expands and price accepts above it.
With no material news flow and continuing operational deterioration, CLRO significantly underperforms Technology and Hardware & Equipment benchmarks on growth, profitability, and balance‑sheet quality. The name effectively trades as a speculative restructuring or take‑private option, not a fundamentals‑driven compounder. Base case is continued range trade beneath $3.00, with support near $1.70–1.80 and resistance $3.00–3.25. My 6–12 month bias is downside‑skewed, with a trading‑oriented fair value band of $1.25–1.75 assuming no transformative event.
More Breaking News
Quick Financial Overview
ClearOne Inc. (CLRO) just shifted from a sleepy chart to a momentum-style move. Weekly data show the stock trading around $1.90–$1.95 for several weeks, then exploding to a $4.68 high before closing the week near $2.93. That kind of range expansion, especially from a low-priced name, typically signals shorts scrambling, day traders piling in, and liquidity finally showing up where it was thin.
The intraday 5‑minute snapshot backs that up. Price ripped from about $1.97 to an intraday high near $4.69 and then faded, closing around $3.25. For short-term traders, that intraday reversal after a huge spike is a classic sign of profit-taking and late buyers getting trapped at the highs. From here, the key question is whether CLRO can build a base above former resistance near $2 or slides back toward the prior range.
Under the hood, ClearOne Inc. is not a picture of strength. The latest quarterly report shows about $0.91M in net loss, negative gross profit, and roughly 2.68M shares outstanding, which translates into a basic EPS of -$0.34. The balance sheet shows only $75,000 in cash with $500,000 in current debt and total liabilities of about $1.37M, leaving stockholders’ equity at roughly -$0.38M. Ratios reinforce the stress: a current ratio around 1.1 suggests only a thin liquidity cushion, while returns on equity and assets are deeply negative.
Conclusion
This is stock news, not investment advice. Timothy Sykes News delivers real-time stock market news focused on key catalysts driving short-term price movements. Our content is tailored for active traders and investors seeking to capitalize on rapid price fluctuations, particularly in volatile sectors like penny stocks. Readers come to us for detailed coverage on earnings reports, mergers, FDA approvals, new contracts, and unusual trading volumes that can trigger significant short-term price action. Some users utilize our news to explain sudden stock movements, while others rely on it for diligent research into potential investment opportunities.
Dive deeper into the world of trading with Timothy Sykes, renowned for his expertise in penny stocks. Explore his top picks and discover the strategies that have propelled him to success with these articles:
- Penny Stocks Trading Guide
- Best Penny Stocks Under $1 to Buy Today
- Top 8 Penny Stocks to Watch on Robinhood
Once you’ve got some stocks on watch, elevate your trading game with StocksToTrade the ultimate platform for traders. With specialized tools for swing and day trading, StocksToTrade will guide you through the market’s twists and turns.
Dig into StocksToTrade’s watchlists here:




Leave a reply