
Flagstar Bank N.A. stocks have been trading down by -9.08 percent amid heightened concerns over its regional banking exposure.
What Traders Need To Know
- Shares slid more than 9% after Q3 results came in below analyst expectations, signaling a sharp negative reaction.
- The stock also dropped about 8% on adjusted earnings and revenue misses, pointing to pressure on both margins and growth.
- A leading role in downward Q3 EPS estimate cuts from BofA shows Flagstar Bank N.A. faces stronger macro headwinds than many peers.
- BofA expects US regional banks overall to keep “languishing” under macro pressures, adding sector-level drag to FLG.
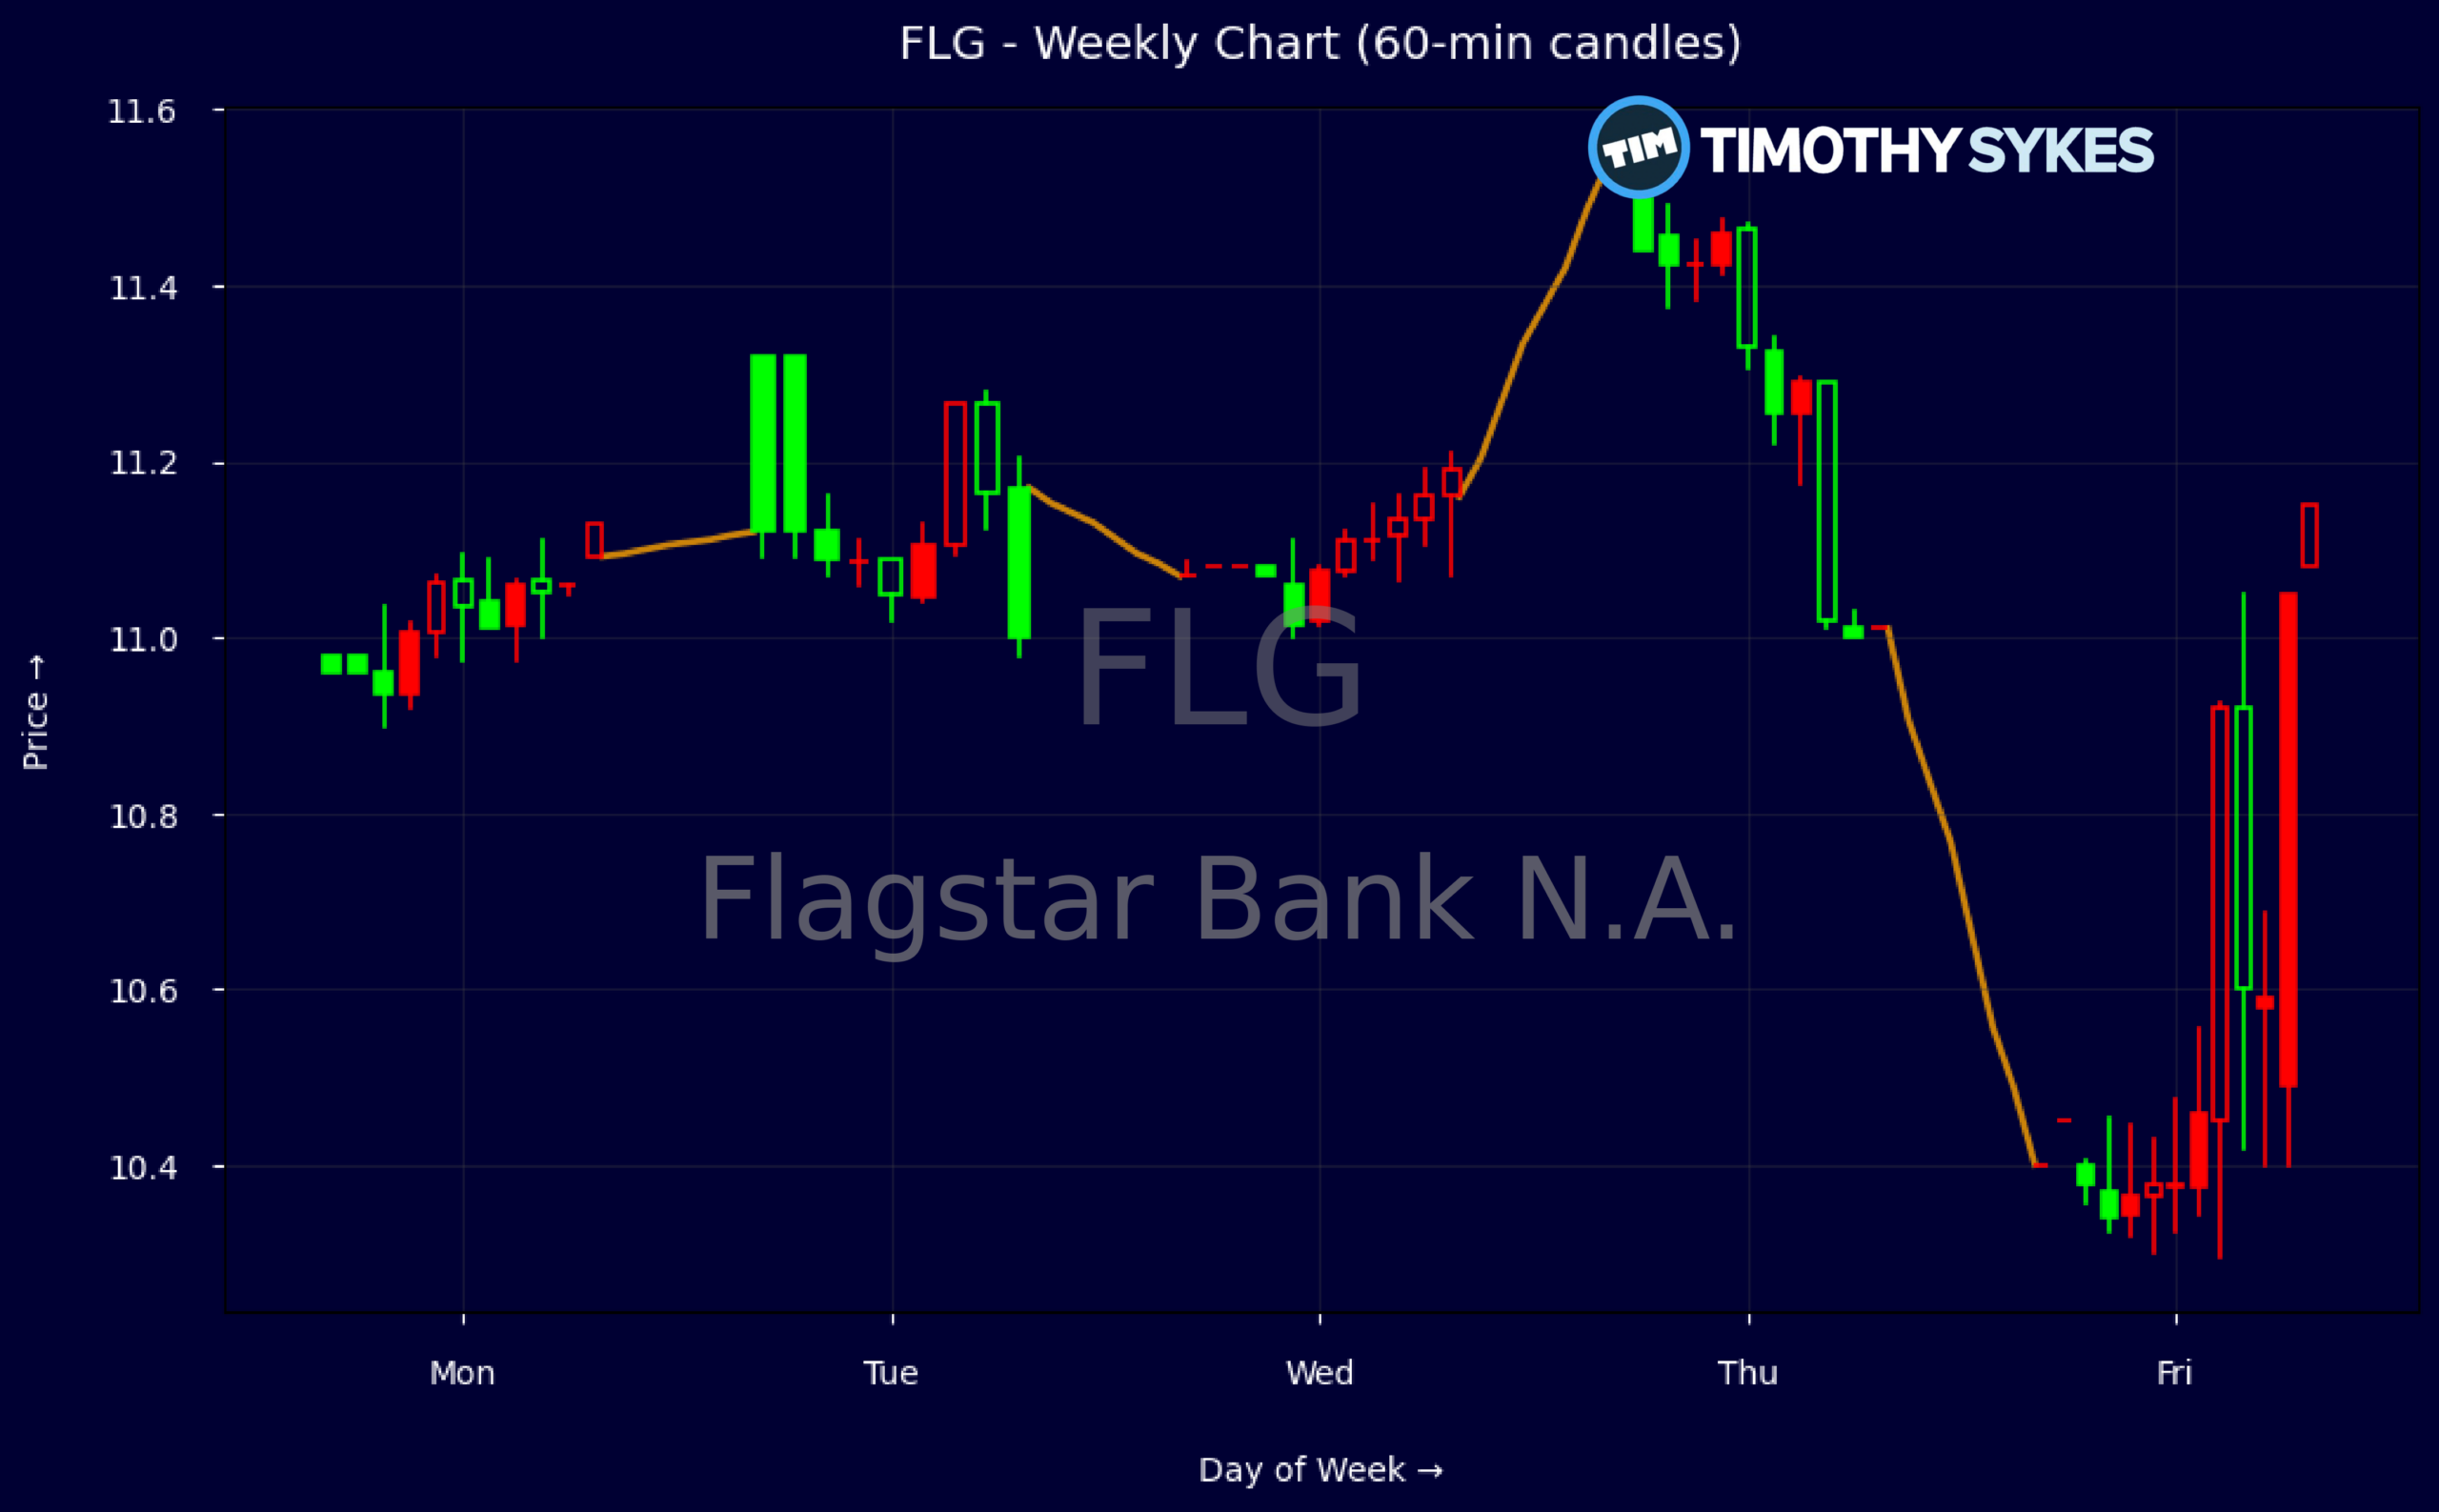
Weekly Update Oct 19 – Oct 23, 2026: On Saturday, October 24, 2026 Flagstar Bank N.A. stock [NYSE: FLG] is trending down by -9.08%! Discover the key drivers behind this movement as well as our expert analysis in the detailed breakdown below.
Finance industry expert:
Analyst sentiment – negative
Flagstar (FLG) sits in a challenged but not distressed position within US regional banks. Revenue has contracted 22% over three years, margins are thin (EBIT margin -0.5%, pretax margin -2.8%), and net income is modest versus a $2.06bn revenue base. Yet equity is solid at $8.1bn with price‑to‑book at 0.62x, implying deep discount to intrinsic value. Leverage (D/E 1.43, leverage ratio 11.5) is high but typical for banks, and operating cash flow of $226m with $200m free cash flow confirms core franchise cash generativity.
Technically, FLG shows near‑term weakness after an earnings‑driven gap down from the mid‑$11s to near $10.40, breaking recent support and signaling a short‑term downtrend within a broader sideways range. The weekly sequence (11.54 → 10.40 close) confirms supply dominance after a failed breakout above $11.50. Intraday 5‑minute candles (with elevated post‑earnings volume) show persistent selling into bounces. For tactical traders, $11.00–11.20 is a clean upside re‑entry/short level, with initial support at $10.20.
News flow is clearly negative: Q3 misses, double‑digit percentage share price drops, and BofA highlighting FLG as one of the more vulnerable mid‑cap lenders. Versus regional bank benchmarks (KRE, BKX), FLG trades at a steeper price‑to‑book discount but with weaker earnings visibility, justifying some of the derating. Core deposits and capital remain adequate, so this is not a solvency story but an earnings/macro one. My 6‑12 month base‑case is range‑bound $9.50–12.00, with tactical resistance at $11.50 and support at $9.75.
More Breaking News
Quick Financial Overview
Flagstar Bank N.A., trading as FLG, just absorbed a hard post-earnings hit, with the stock dropping from the low $11 area into the low $10s on the weekly chart. Price pushed up to around $11.54 earlier in the week but reversed sharply to close near $10.40, confirming a failed breakout and a strong supply zone above $11.50. The intraday 5-minute data shows a wide range session, with price swinging between roughly $11.05 and $10.30 and closing near the lows, a classic sign of heavy distribution after bad news.
On the fundamentals, FLG is a mid-cap regional bank with about $87.7B in assets and $67.5B in deposits, giving it meaningful scale but also high balance-sheet sensitivity to macro shifts. Quarterly revenue of about $516M and net income of $34M translate into thin profitability, with pretax margin under 3% and a tiny profit margin overall. Management is still generating positive operating cash flow of roughly $226M and free cash flow of about $200M, but it comes alongside sizable investing outflows tied to securities and loans.
Valuation is tricky here. A headline P/E around 283 looks stretched, but that mostly reflects depressed earnings, not a high-growth story. Price-to-book near 0.62 and price-to-tangible-book around 0.64 tell a different story, suggesting the market is heavily discounting the balance sheet and future earnings power. Return metrics are mixed, with return on equity swinging from negative historically to slightly positive on a last-twelve-month basis, while leverage is high with total debt-to-equity about 1.43 and a leverageratio of 11.5. For traders, the combination of low price-to-book and weak momentum signals a value-trap risk until earnings stabilize.
Conclusion
Flagstar Bank Q3 Miss Puts Traders On Defense
The post-earnings slide in FLG, with shares dropping more than 9% after missing analyst expectations on Q3 results, tells you where sentiment sits right now: firmly bearish. The weekly rejection near $11.50 and close near $10.40 mark a clear resistance band overhead and confirm that sellers are in control in the short term. With intraday trade showing a wide range and closing near the session low, short-term traders should assume bounces into prior support zones are likely to be sold until the tape proves otherwise.
Fundamentally, Flagstar Bank N.A. is operating with thin margins, high leverage, and a sector backdrop that BofA expects to “languish” under macro headwinds. The bank’s lead in downward EPS revisions and the Q3 miss together frame FLG as one of the more exposed regional names, not a safe-haven play. At the same time, a price-to-book below 0.7 means aggressive traders will be watching for oversold, short-covering rallies once the selling pressure exhausts.
For research-focused traders, the key now is to respect the downside momentum while mapping reaction levels around $10 and the $11–$11.50 zone. As millionaire penny stock trader and teacher Tim Sykes, says, “Small gains add up over time; focus on building wealth gradually, not chasing jackpots.”. That mindset fits this tape: in a name with this kind of volatility and sector overhang, disciplined, small, high-probability trades matter far more than swinging for home runs against the trend. As I tell my students, “Cheap gets cheaper in this market until price, volume, and earnings all line up—your edge comes from waiting for that alignment, not guessing the bottom.”
This is stock news, not investment advice. Timothy Sykes News delivers real-time stock market news focused on key catalysts driving short-term price movements. Our content is tailored for active traders and investors seeking to capitalize on rapid price fluctuations, particularly in volatile sectors like penny stocks. Readers come to us for detailed coverage on earnings reports, mergers, FDA approvals, new contracts, and unusual trading volumes that can trigger significant short-term price action. Some users utilize our news to explain sudden stock movements, while others rely on it for diligent research into potential investment opportunities.
Dive deeper into the world of trading with Timothy Sykes, renowned for his expertise in penny stocks. Explore his top picks and discover the strategies that have propelled him to success with these articles:
- Penny Stocks Trading Guide
- Best Penny Stocks Under $1 to Buy Today
- Top 8 Penny Stocks to Watch on Robinhood
Once you’ve got some stocks on watch, elevate your trading game with StocksToTrade the ultimate platform for traders. With specialized tools for swing and day trading, StocksToTrade will guide you through the market’s twists and turns.
Dig into StocksToTrade’s watchlists here:





Leave a reply