

Leverage Shares 2X Long SNDK Daily ETF jumped as stocks have been trading up by 11.34 percent amid bullish sentiment.
Key Takeaways
- Leverage Shares 2X Long SNDK Daily ETF has dropped sharply from early-month highs near $10, tightening into the mid-$6 range.
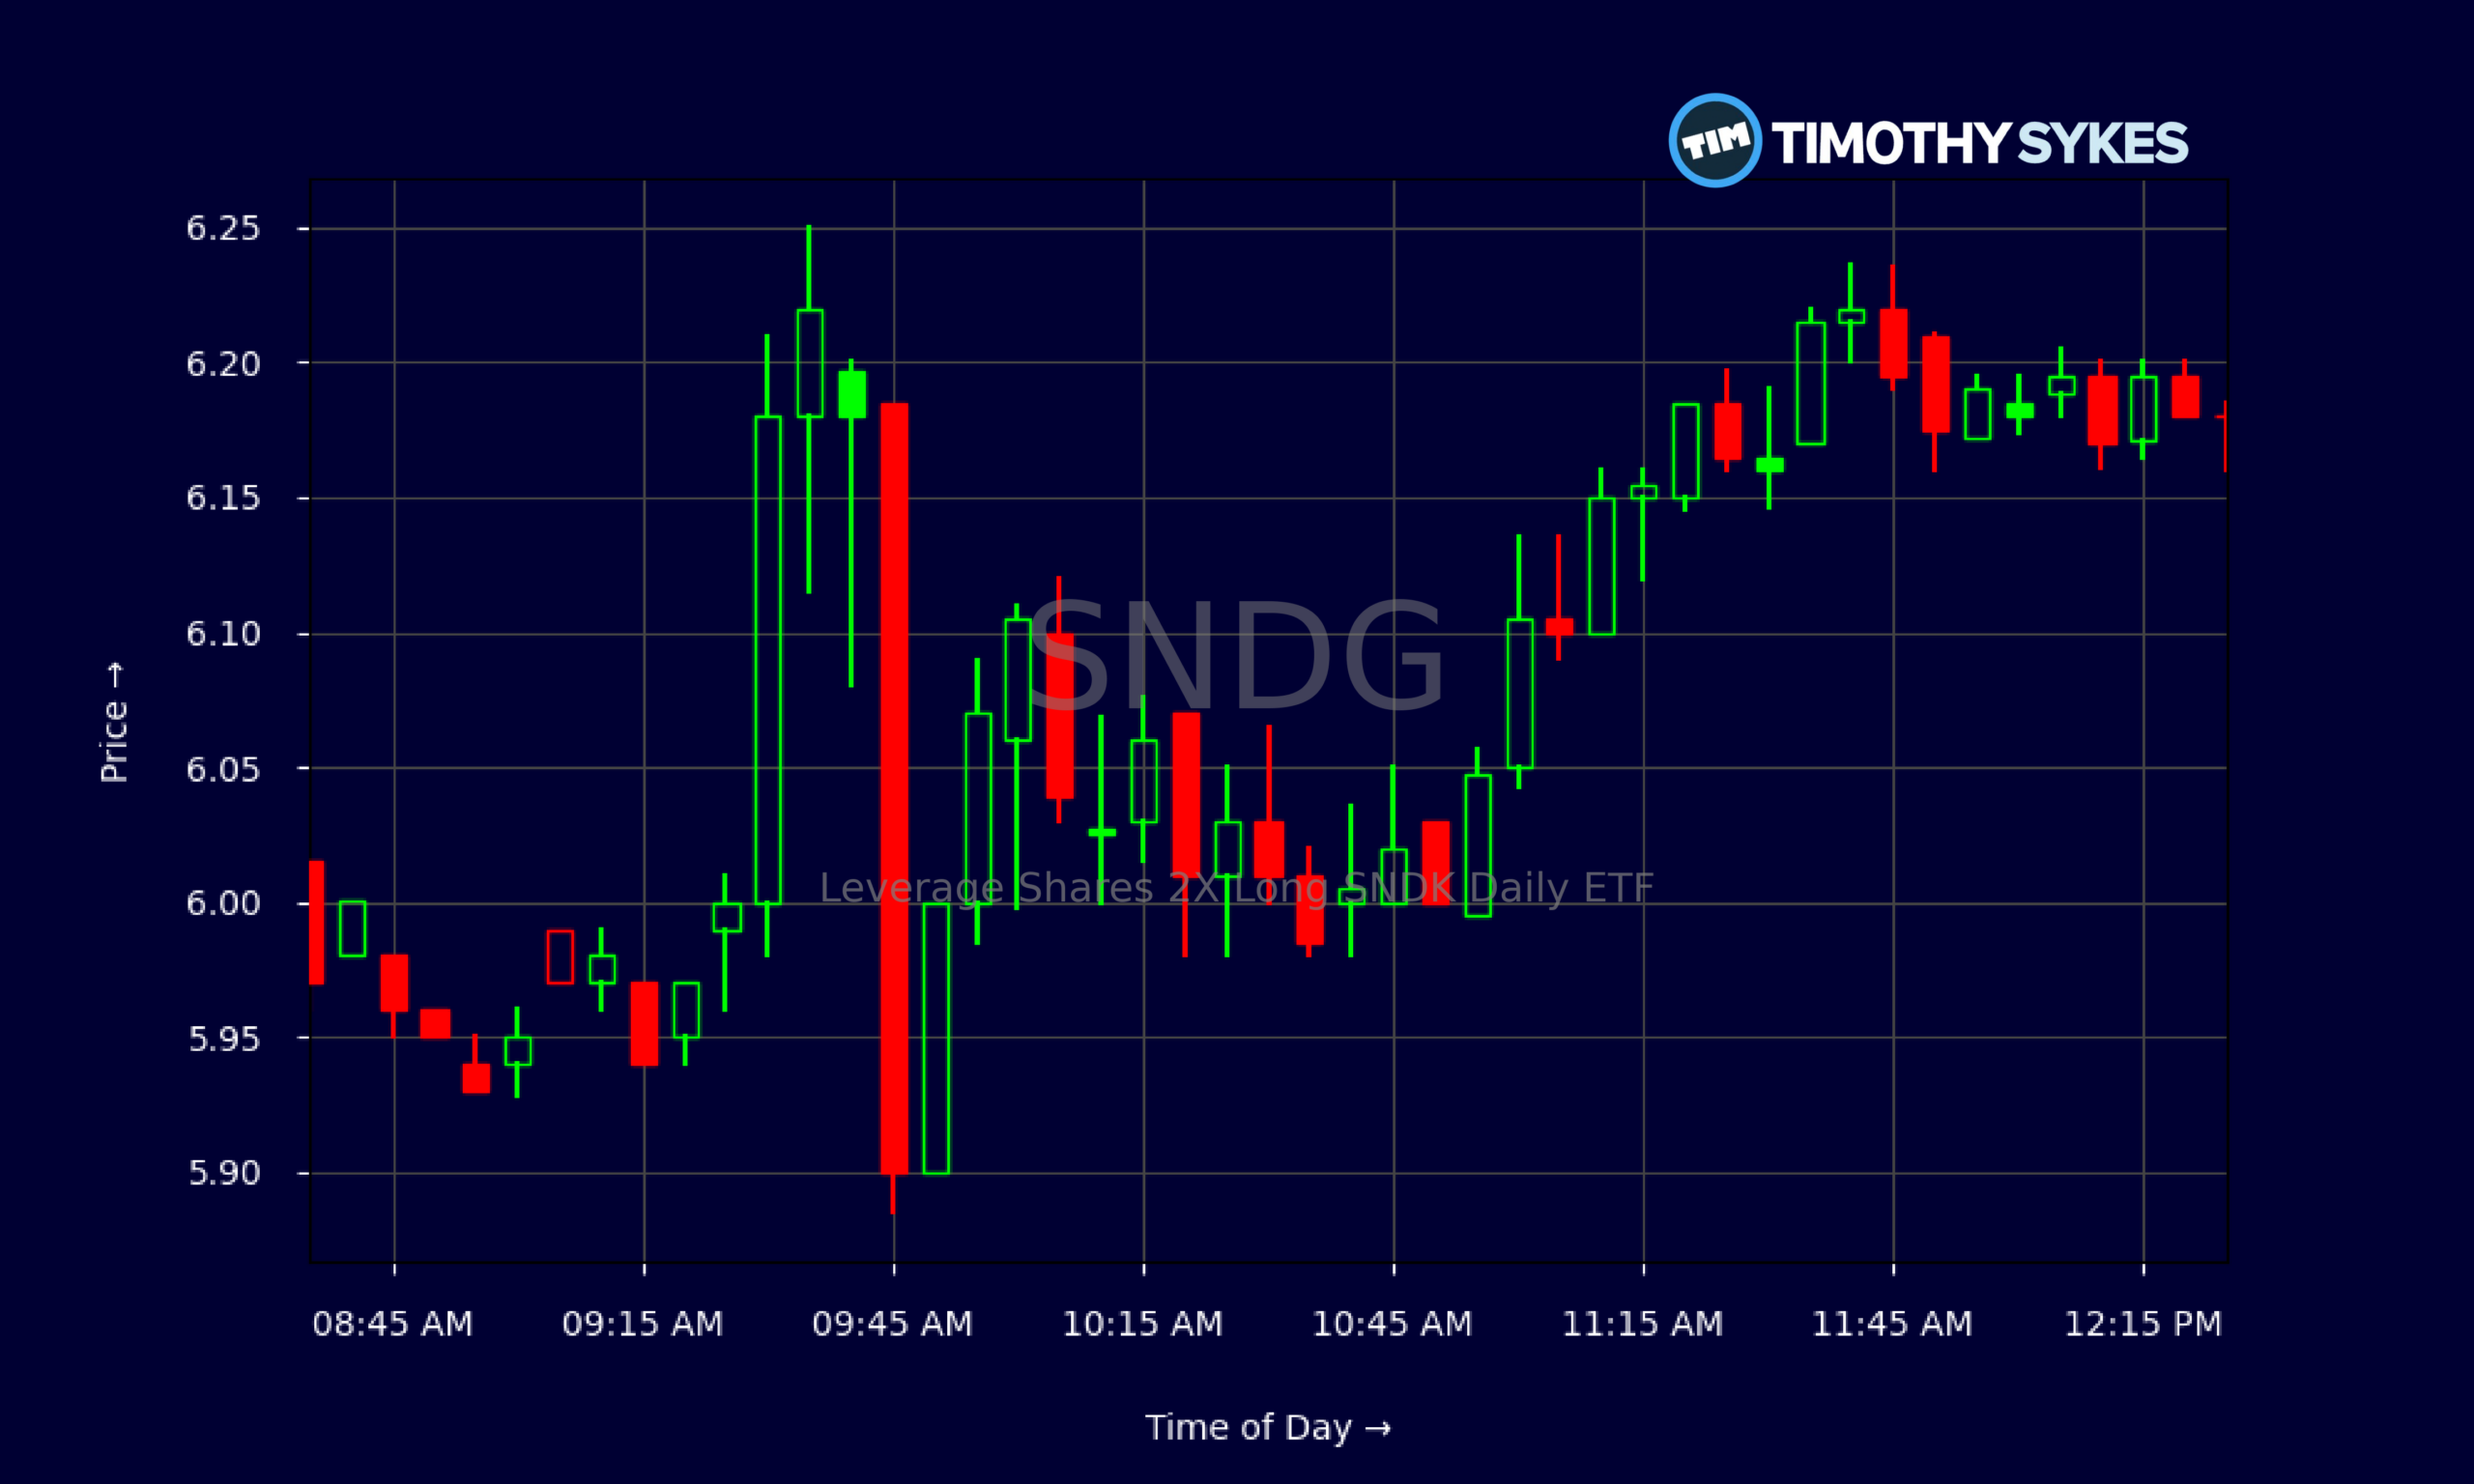
- Recent SNDG daily candles show heavy selling followed by a slower, choppy bounce, signaling a fragile trend.
- Intraday SNDG action is now grinding sideways around $6, showing short-term balance between buyers and sellers.
- Thin fundamental data keeps the focus on pure technical trading for SNDG in the near term.
Live Update At 12:33:13 EDT: On Wednesday, October 28, 2026 Leverage Shares 2X Long SNDK Daily ETF stock [BATS Global Markets: SNDG] is trending up by 11.34%! Discover the key drivers behind this movement as well as our expert analysis in the detailed breakdown below.
Quick Financial Overview
Leverage Shares 2X Long SNDK Daily ETF, trading under ticker SNDG, is a leveraged product built for short-term trading, not long-term holding. The key thing to understand with SNDG is that its value tracks daily moves with 2x exposure, so sharp swings are baked into the design. Traditional metrics like earnings, profit margins, or cash flows are not driving the price here. The key ratios are mostly blank, which tells traders the story is almost all about price action and volatility.
More Breaking News
Over recent sessions, SNDG has broken down from a strong early-month push near $10 and now trades around the low-to-mid $6s. That pullback is steep in percentage terms, and for a 2x product it signals an aggressive move in the underlying target. For active traders, SNDG’s structure means compounding and decay are always in play, especially when the underlying chops sideways. That makes tight risk control essential. In simple terms, SNDG is a high-speed vehicle with no fundamental seatbelt; the chart is the main guide.
Why Traders Are Watching SNDG’s Volatile Price Action
The daily chart on SNDG tells a clear story. Around the start of the displayed period, SNDG was trading above $10, with a close at $9.90 and intraday spikes over $10. From there, the ETF rolled over, stepping down day after day. By the time it hit the recent low near $5.19, SNDG had lost roughly half its value from the highs. That kind of slide gets the attention of momentum traders who hunt for oversold bounces and sharp snap-backs.
Look at the last few days of SNDG action. After printing lows just under $5.20, the ETF started to grind back up, closing at $5.55, then $6.18. That’s a solid short-term bounce, but not a full trend reversal yet. The candles show lower highs overall and heavy selling earlier in the month, which means any bullish push still has to fight overhead resistance from trapped longs.
Zooming in on the intraday 5-minute chart, SNDG is now hovering around $6 with relatively tight ranges. Early in the day, moves between $5.90 and $6.20 show active but controlled trading, rather than panic. Midday, SNDG sits around $6.18 with repeated taps of similar levels, classic consolidation after a move up.
For traders who follow Tim Sykes–style momentum setups, SNDG is in that in-between zone. The massive fade from $10 shows how fast gains can unwind in a leveraged ETF. The recent bounce and intraday base show where dip buyers are testing the waters. The next big opportunity comes if SNDG either breaks convincingly over recent highs near $6.70–$7, or cracks back under the $5.80–$6 support area. Until then, it’s a range-trading and scalp environment where discipline matters more than prediction.
Conclusion
SNDG is a pure price-action vehicle right now. With almost no traditional financial data to lean on, traders are forced to read the tape, study the chart, and respect the leverage. The slide from near $10 to the low $5s proves how punishing it can be when the trend turns against you in a 2x ETF. The current bounce toward $6+ shows the flip side: when momentum returns, SNDG can move quickly in traders’ favor.
For short-term players, SNDG’s recent tight intraday action around $6 signals a decision point. A break above recent local highs may invite momentum traders looking for a push back toward the $7s. A failure that takes SNDG under intraday support levels would confirm that the bounce was just a dead-cat move in a larger downtrend. Either way, risk per trade has to be nailed down before entering.
This is exactly the type of setup Tim Sykes talks about when he says, “The market rewards prepared traders who respect risk and cut losses quickly; everyone else eventually donates.” As millionaire penny stock trader and teacher Tim Sykes, says, “Preparation plus patience leads to big profits.”. SNDG demands that mindset. Traders who treat Leverage Shares 2X Long SNDK Daily ETF as a short-term, chart-driven product and manage their downside tightly will be better positioned than those who simply hope the leverage works in their favor.
This is stock news, not investment advice. Timothy Sykes News delivers real-time stock market news focused on key catalysts driving short-term price movements. Our content is tailored for active traders and investors seeking to capitalize on rapid price fluctuations, particularly in volatile sectors like penny stocks. Readers come to us for detailed coverage on earnings reports, mergers, FDA approvals, new contracts, and unusual trading volumes that can trigger significant short-term price action. Some users utilize our news to explain sudden stock movements, while others rely on it for diligent research into potential investment opportunities.
Dive deeper into the world of trading with Timothy Sykes, renowned for his expertise in penny stocks. Explore his top picks and discover the strategies that have propelled him to success with these articles:
- Penny Stocks Trading Guide
- Best Penny Stocks Under $1 to Buy Today
- Top 8 Penny Stocks to Watch on Robinhood
Once you’ve got some stocks on watch, elevate your trading game with StocksToTrade the ultimate platform for traders. With specialized tools for swing and day trading, StocksToTrade will guide you through the market’s twists and turns.
Dig into StocksToTrade’s watchlists here:





Leave a reply