

American Airlines Group Inc. stocks have been trading down by -3.01 percent amid heightened concerns over rising fuel and labor costs.
Key Takeaways
- American Airlines has warned that persistently high fuel prices may force further Q4 capacity cuts, with management estimating about $1 billion in extra fuel costs and promising more guidance at earnings.
- Major U.S. airlines including American are trimming planned capacity as sharply higher fuel costs threaten profits, even while travel demand remains strong.
- Goldman Sachs cut its price target on American Airlines from $13 to $11 and reiterated a Sell rating, signaling continued negative expectations for AAL’s performance.
- BMO Capital cut its price target on American Airlines from $19 to $15.50, citing jet fuel costs tied to Middle East conflict, partly offset by solid demand and some pricing power.
- Morgan Stanley now forecasts deeper losses for American Airlines as jet fuel prices have roughly doubled from expected levels, warning that prolonged energy inflation threatens 2027 capacity and cost targets.
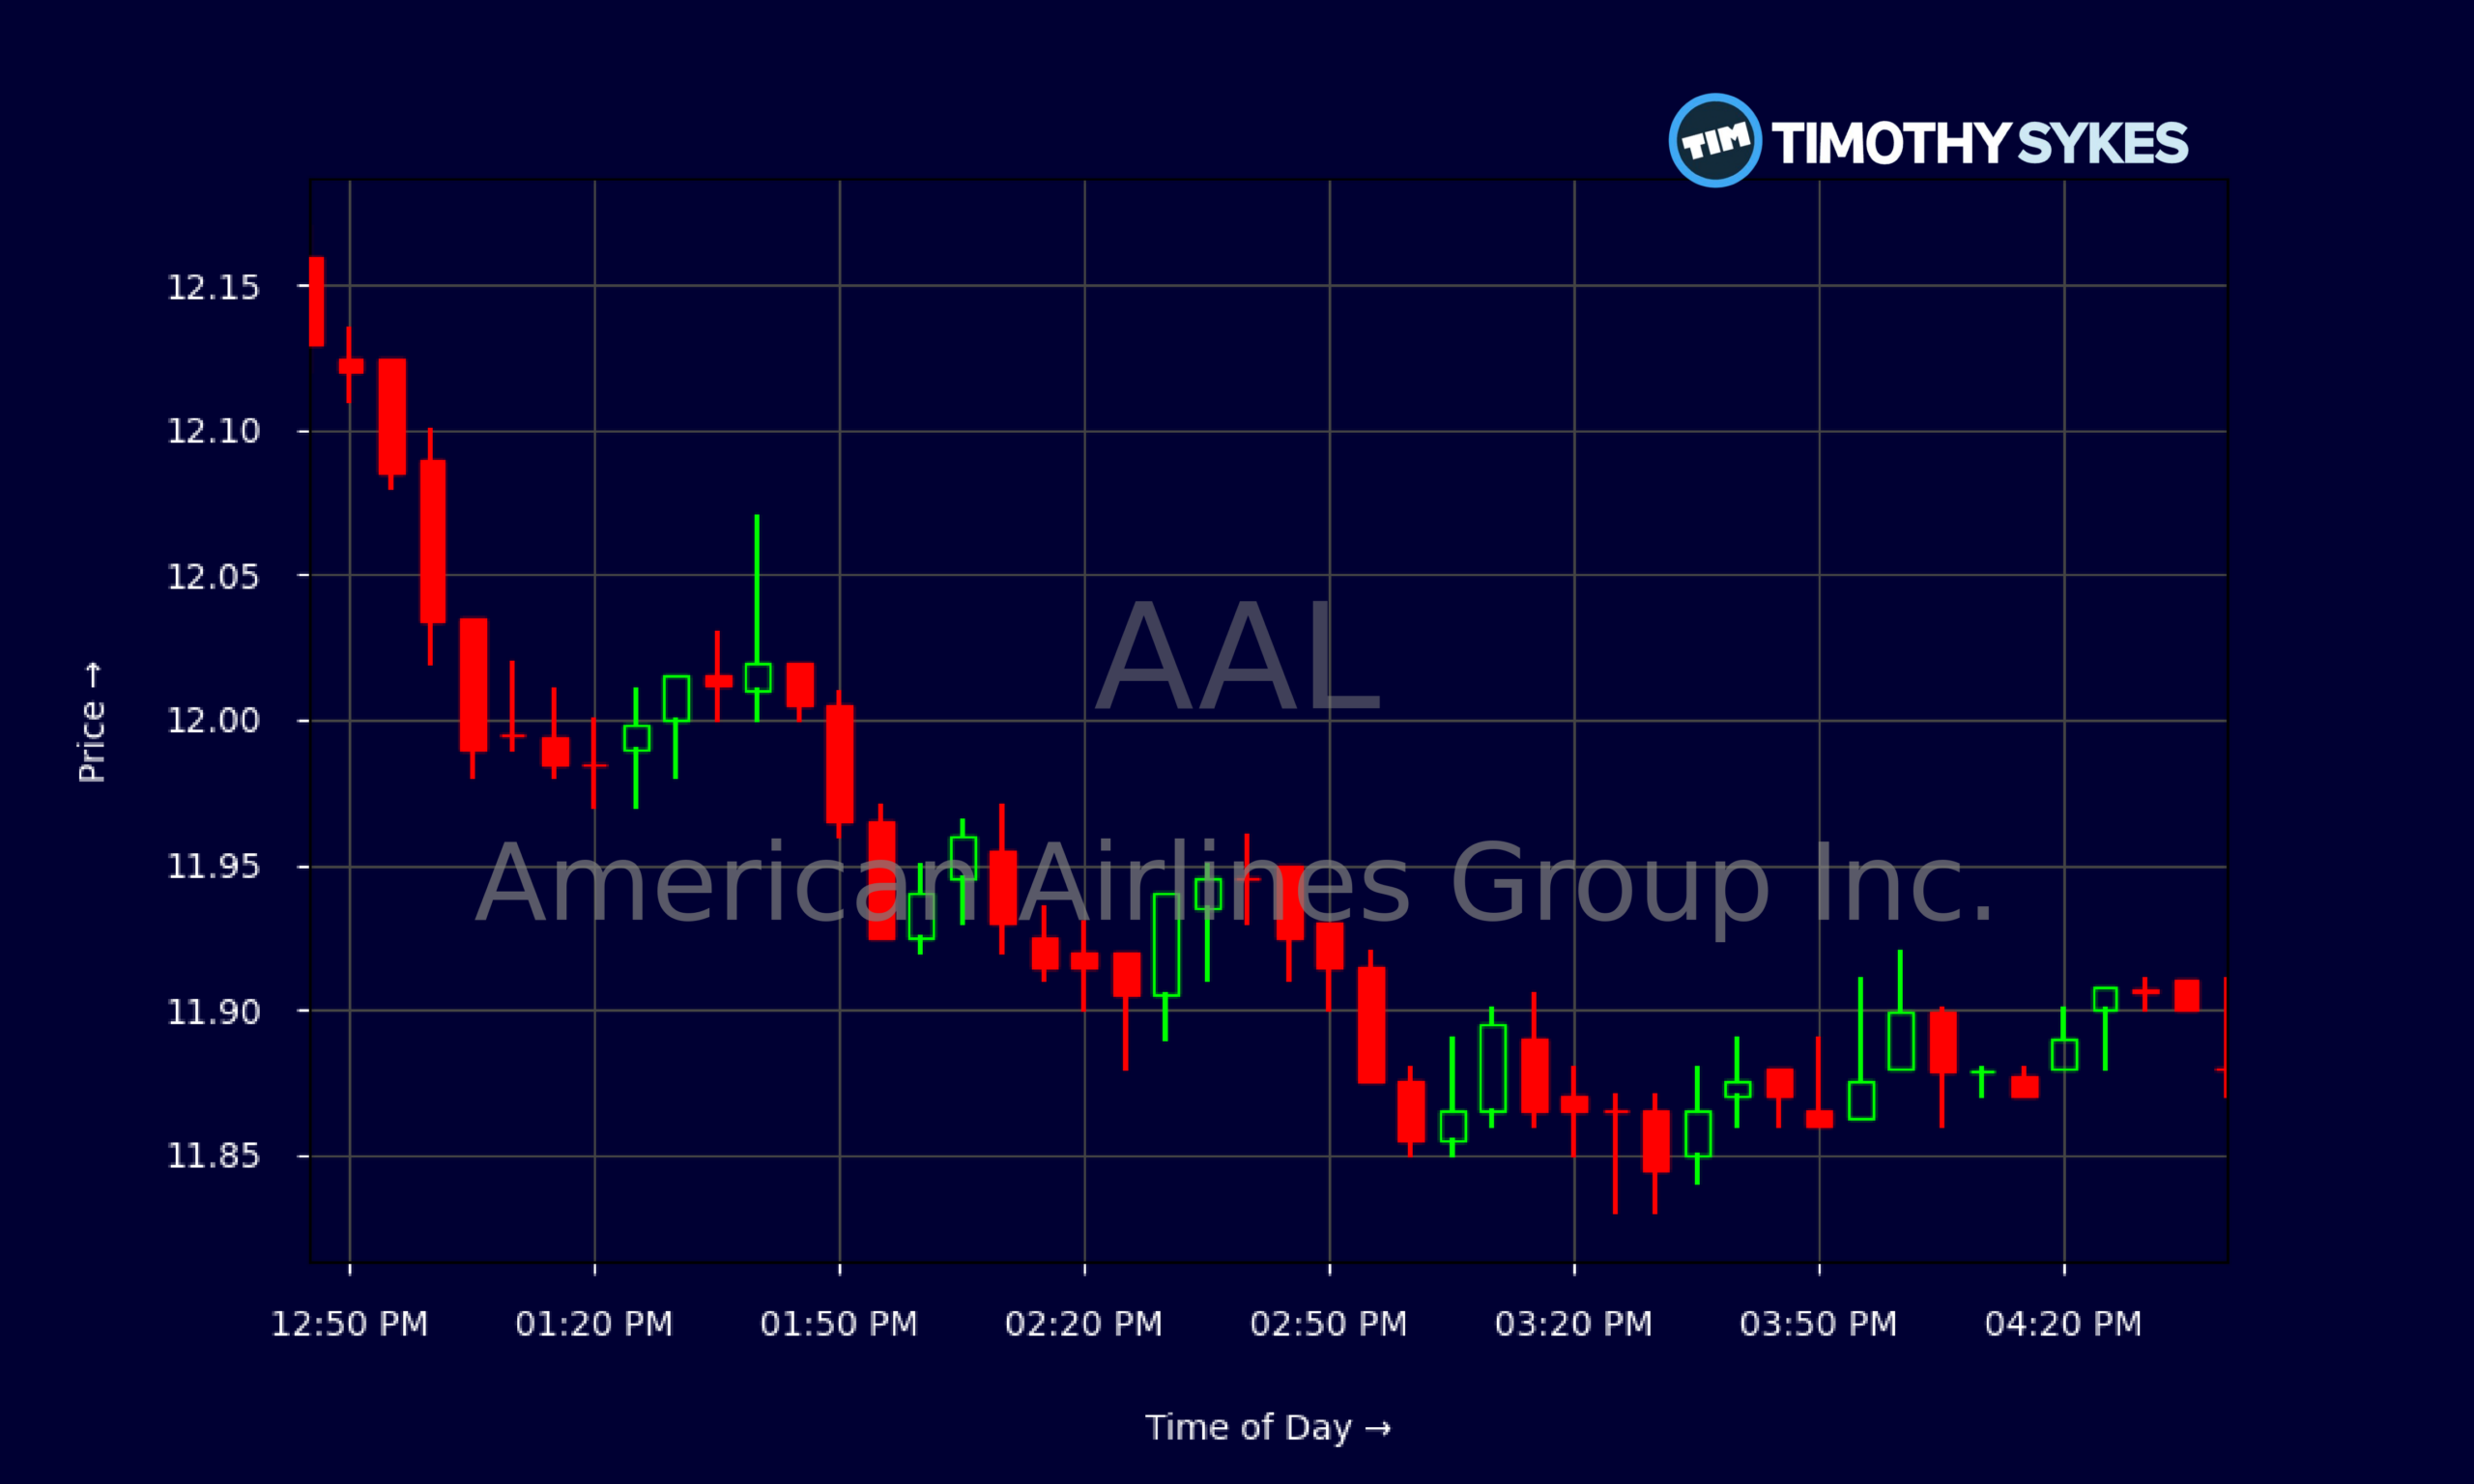
Live Update At 16:46:48 EDT: On Friday, October 16, 2026 American Airlines Group Inc. stock [NASDAQ: AAL] is trending down by -3.01%! Discover the key drivers behind this movement as well as our expert analysis in the detailed breakdown below.
Quick Financial Overview
AAL is trading like a stock under pressure. Over the past few weeks, American Airlines Group Inc. has faded from the mid‑$13s to around $11.88, with a steady grind lower rather than a single crash. The daily chart shows failed bounces near $13 and $13.50 followed by lower highs, a classic downtrend that short‑term traders watch closely.
Intraday, AAL’s 5‑minute chart tells the same story. The stock opened near $12.25, pushed briefly above $12.40, then leaked lower most of the day and closed under $11.90. That intraday rollover shows supply above $12 and weak dip‑buying interest.
Fundamentally, American Airlines is pushing huge revenue — about $54.6B over the last year — but doing it on razor‑thin profit. Last quarter, AAL generated $16.7B in revenue and only $71M in net income. That’s less than $0.01 of profit for every dollar of sales, a tiny margin.
More Breaking News
The balance sheet is heavy. Long‑term debt sits around $25.8B, total liabilities exceed total assets, and book value per share is negative. AAL’s current ratio near 0.5 means short‑term obligations outweigh near‑term assets, so liquidity is tight. For active trading, this mix — thin margins, high leverage, and a falling chart — often equals heightened volatility around news and earnings.
Why Traders Are Watching AAL So Closely
Right now, AAL is a pure fuel and capacity story. American Airlines Group Inc. has told the market straight up that persistently high jet fuel prices may force further Q4 capacity cuts, and management pegs the extra Q4 fuel bill at roughly $1B. That is not a rounding error. For a company already running on thin margins, a billion‑dollar cost shock is a direct hit to earnings.
This is not happening in a vacuum. Major U.S. airlines like American, United, and Southwest are already cutting planned capacity and schedules. The message: demand is there, but fuel is dictating the game plan. American Airlines is leaning toward margin defense over aggressive growth, slowing capacity to manage costs. That can help pricing on each seat, but it caps volume‑driven upside for AAL.
Wall Street is reacting fast. BMO Capital dropped its AAL price target from $19 to $15.50 while keeping a Market Perform rating, explicitly pointing to rising jet fuel costs tied to Middle East tensions. Bank of America cut its target from $17 to $15 and kept AAL at Neutral. Those are caution lights — not full‑blown alarms, but clear signs that upside assumptions are shrinking.
Goldman Sachs went further. Its analysts slashed the AAL target from $13 to $11 and reiterated a Sell rating, flagging more downside risk. Morgan Stanley piled on by forecasting deeper losses for American Airlines as fuel prices have nearly doubled from what carriers had baked into their plans, warning that 2027 capacity and ex‑fuel unit cost goals are now at risk. Add Delta’s recent earnings miss and guidance cut on fuel pressure, which dragged AAL about 1% lower in sympathy, and you have a sector where every earnings report is a potential shock event.
For traders, this all means AAL is trading more on macro energy moves and analyst revisions than on small day‑to‑day operational news. Even a temporary hit like the Verizon fiber cut that disrupted East Coast flights is background noise compared with the fuel‑driven reset happening in American Airlines’ earnings outlook.
Conclusion
For active traders, AAL sits at the intersection of technical weakness and fundamental stress. American Airlines Group Inc. is generating massive revenue, but heavy debt, negative equity, and a $1B quarterly fuel surprise leave very little room for error. As AAL cuts or slows capacity to manage fuel costs, the stock story shifts from growth to survival and discipline.
Wall Street’s tone backs that up. AAL now carries a spread of cautious to bearish views: BMO and Bank of America trimming targets while staying Neutral, Goldman openly on Sell, and Morgan Stanley warning about deeper losses and threatened long‑term targets. Each new fuel headline or airline earnings print is a catalyst for the whole group, and AAL is moving in lockstep.
That sets the stage for elevated trading opportunity — but also real risk. Upcoming earnings and updated guidance on Q4 capacity and 2027 goals will be key events for AAL. Until then, the chart tells you where sentiment is: lower highs, weak bounces, and quick sympathy moves when peers stumble.
This is where disciplined trading matters. As Tim Sykes likes to say, “The market doesn’t care about your opinion, only your preparation.” As millionaire penny stock trader and teacher Tim Sykes, says, “There is always another play around the corner; don’t chase just because you feel FOMO.”. For anyone trading American Airlines Group Inc., that means knowing the fuel story, respecting the downtrend, and always having a clear plan to cut losses fast. This analysis is for educational and research purposes only and is not investment advice.
This is stock news, not investment advice. Timothy Sykes News delivers real-time stock market news focused on key catalysts driving short-term price movements. Our content is tailored for active traders and investors seeking to capitalize on rapid price fluctuations, particularly in volatile sectors like penny stocks. Readers come to us for detailed coverage on earnings reports, mergers, FDA approvals, new contracts, and unusual trading volumes that can trigger significant short-term price action. Some users utilize our news to explain sudden stock movements, while others rely on it for diligent research into potential investment opportunities.
Dive deeper into the world of trading with Timothy Sykes, renowned for his expertise in penny stocks. Explore his top picks and discover the strategies that have propelled him to success with these articles:
- Penny Stocks Trading Guide
- Best Penny Stocks Under $1 to Buy Today
- Top 8 Penny Stocks to Watch on Robinhood
Once you’ve got some stocks on watch, elevate your trading game with StocksToTrade the ultimate platform for traders. With specialized tools for swing and day trading, StocksToTrade will guide you through the market’s twists and turns.
Dig into StocksToTrade’s watchlists here:





Leave a reply