

XIAO-I Corporation stocks have been trading up by 32.25 percent amid heightened optimism over its latest AI platform advancements.
Key Takeaways
- Shares have run from roughly $1.20 to above $3.80 this month, making AIXI a high-volatility AI trading vehicle.
- Recent daily candles show wide ranges and sharp reversals, signaling aggressive short-term trading in XIAO-I Corporation.
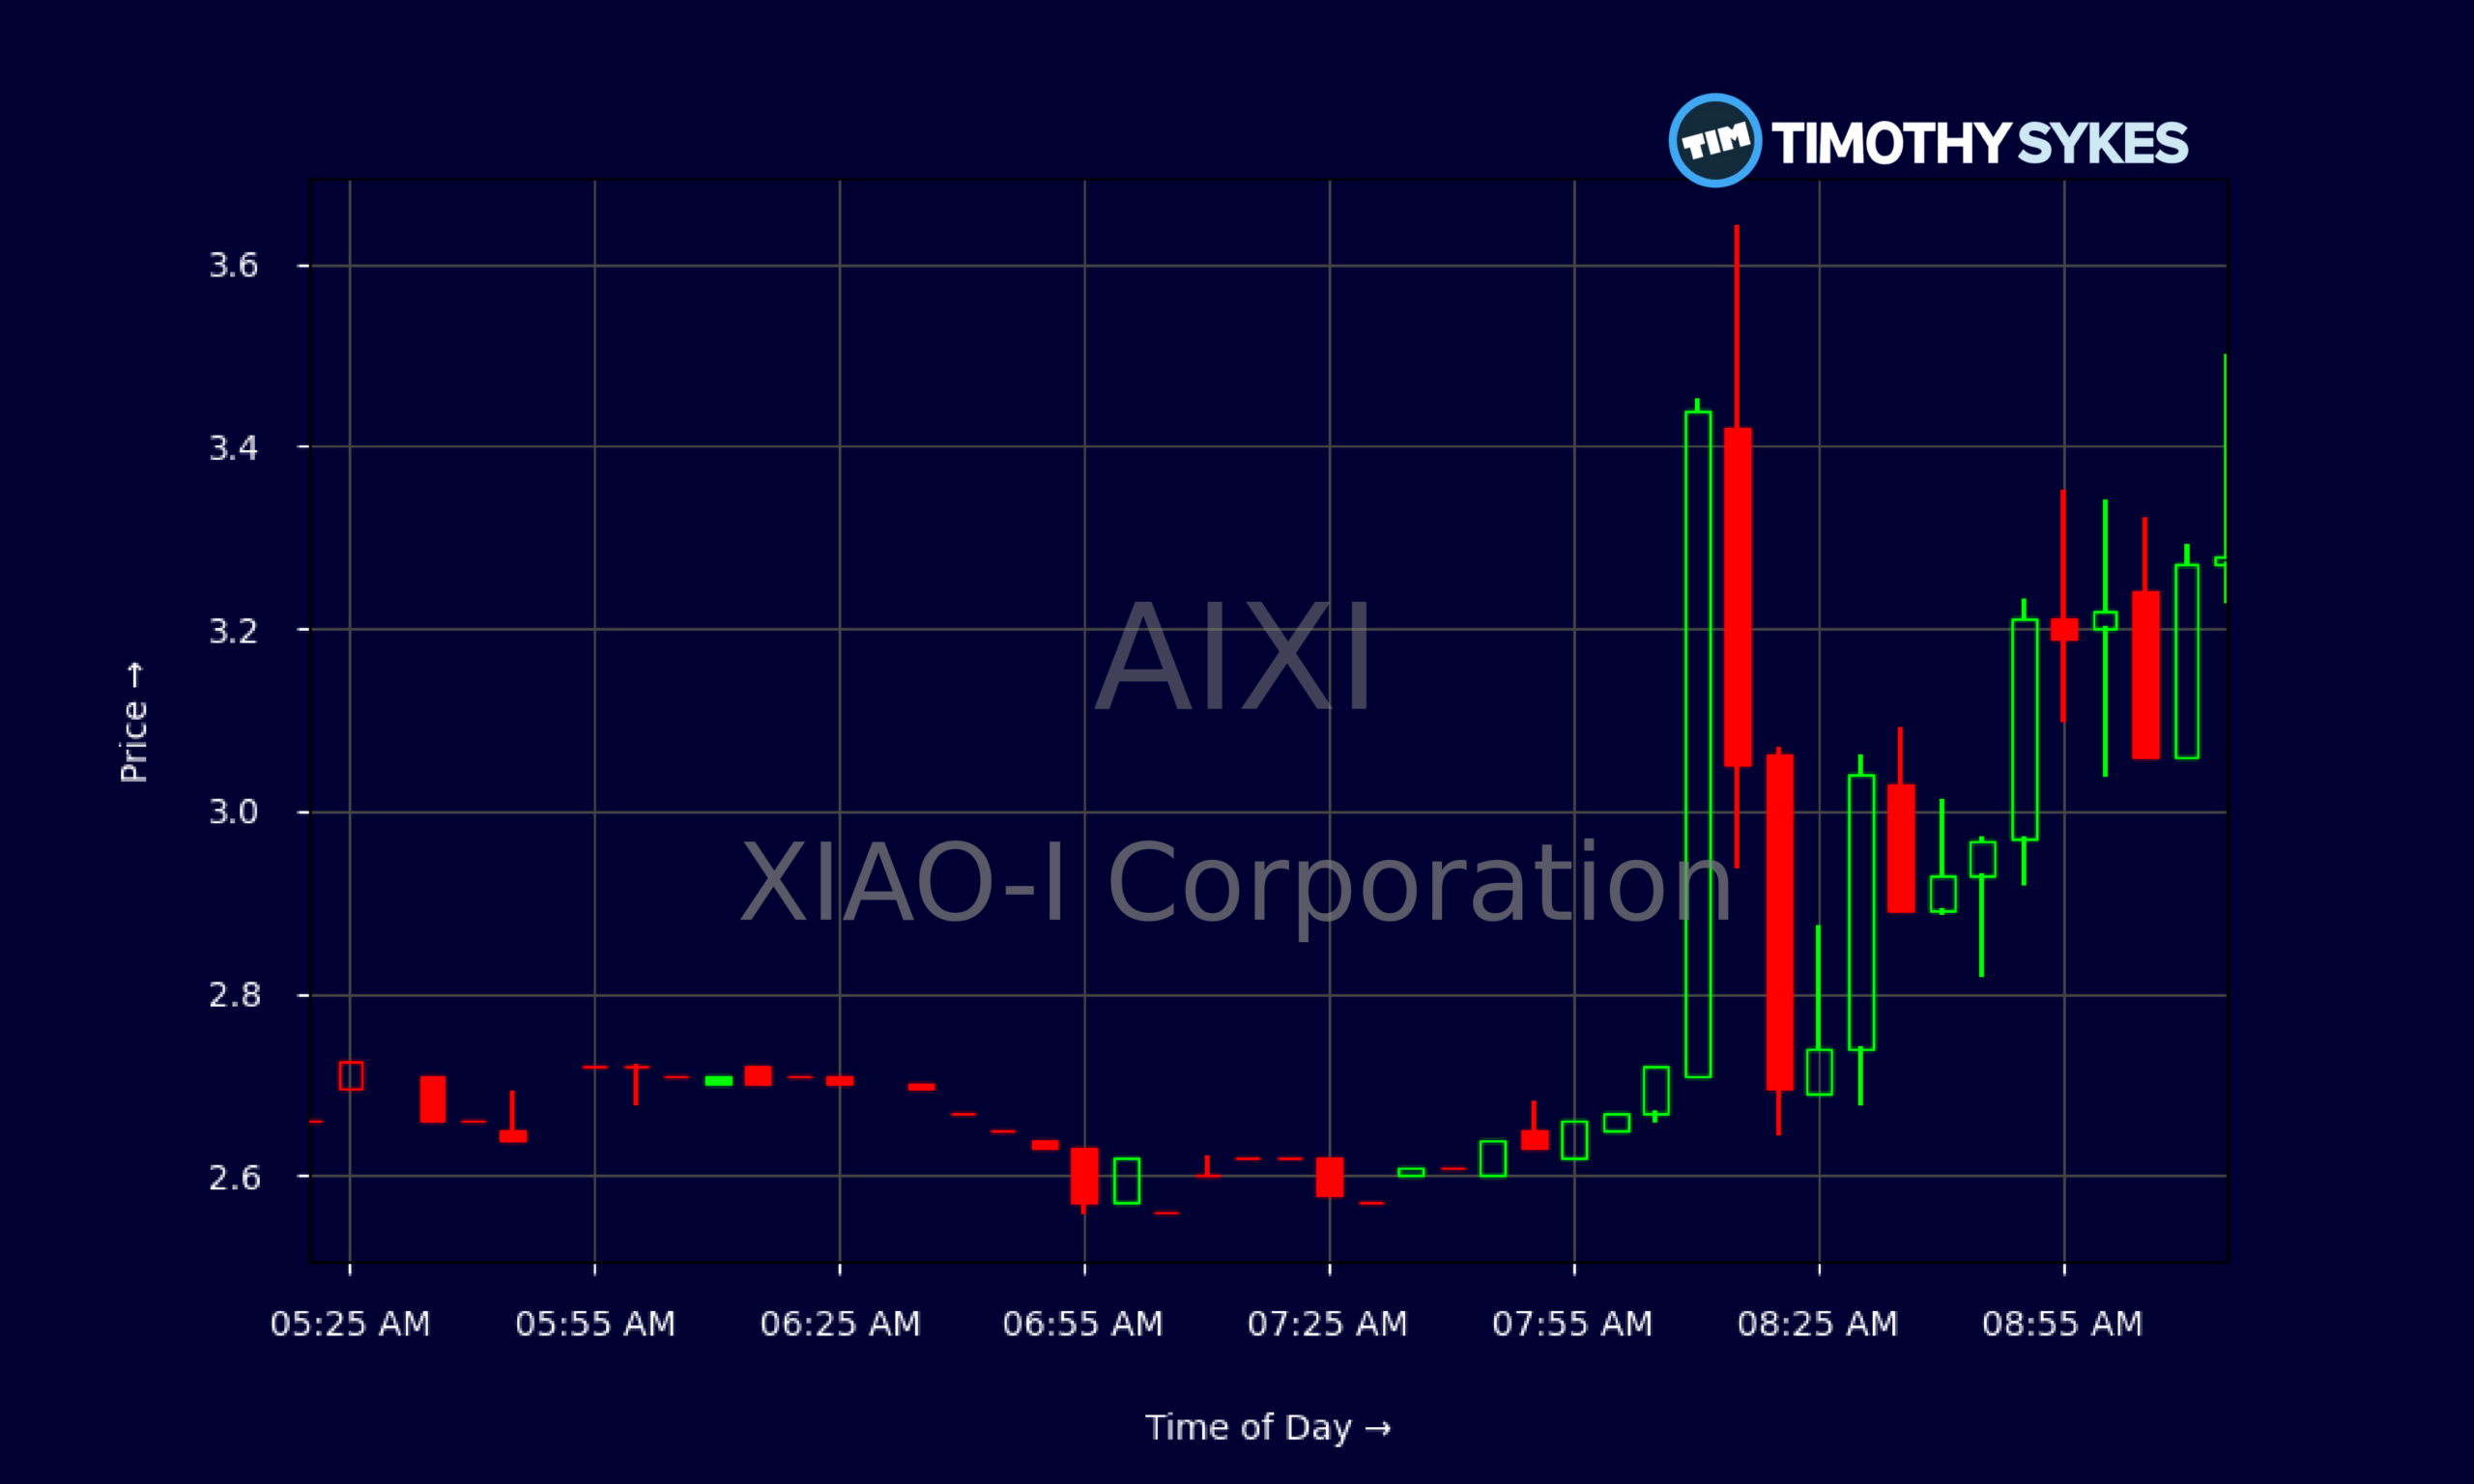
- Intraday 5‑minute data highlights heavy premarket action, with AIXI spiking over $3.60 before fading.
- Financials show low price-to-sales but deeply negative equity, a classic high-risk small-cap profile.
- Traders are tracking key support around the $2.00–$2.50 area as momentum cools off.
Live Update At 09:19:07 EDT: On Friday, October 23, 2026 XIAO-I Corporation stock [NASDAQ: AIXI] is trending up by 32.25%! Discover the key drivers behind this movement as well as our expert analysis in the detailed breakdown below.
Quick Financial Overview
AIXI, the U.S.-listed shares of XIAO-I Corporation, trades like a classic speculative AI small cap. On the fundamentals, the picture is mixed at best. The company reported about $12.33M in revenue, yet its balance sheet tells a much tougher story. Common stock equity is roughly -$100.55M, and retained earnings sit near -$226.56M. That means AIXI is carrying heavy accumulated losses.
Despite this, the market is valuing AIXI at an enterprise value around $44.79M. With a price-to-sales ratio near 0.02, the stock looks cheap on sales alone, but traders know that is only one piece of the puzzle. Book value per share is deeply negative at about -$764.60, highlighting how liabilities tower over equity.
More Breaking News
AIXI’s total liabilities of about $120.77M versus total assets of $15.90M create significant balance-sheet pressure. For short-term traders, this kind of setup often becomes a pure price-action and liquidity game. AIXI is less about long-term fundamentals right now and more about how traders handle the wild intraday swings built on this fragile financial base.
Why Traders Are Watching AIXI’s Volatility Spike
AIXI has become a textbook momentum chart. In late September, XIAO-I Corporation was grinding around $1.45–$1.60. Then the real move began. The stock dipped to about $1.21 on 2026/10/01 and quickly reclaimed the $1.80 area by 2026/10/02. From there, AIXI stair-stepped higher, with a brief shakeout on 2026/10/06 when it opened near $2.91 and crashed to a $1.63 low before closing at $1.85. That kind of intraday collapse followed by recovery is what attracts day traders.
The real fireworks showed up from 2026/10/07 onward. AIXI ripped from the low $1s to intraday highs above $3.80 on 2026/10/20, before pulling back to close at $3.10. Over the past several sessions, daily ranges above $1 have been common, with AIXI swinging between $2.03 and $3.84 in a matter of days. The most recent close near $2.48 shows the stock backing off its highs but still holding well above where this run started.
Intraday 5‑minute data reinforces the message. Premarket trading saw AIXI spike from around $2.70 to over $3.60 before volume faded and price drifted back under $3.30. For active traders, that is prime territory: clear liquidity pockets, emotional breakouts, and fast reversals.
AIXI’s fundamentals are messy, but that often fuels the trade rather than kills it. XIAO-I Corporation has low price-to-sales, negative equity, and sizable liabilities, all of which keep short sellers engaged. Long-side momentum traders, meanwhile, chase every breakout on the chart. That push-pull between longs and shorts is what keeps AIXI in play on many day trading screens.
Conclusion
AIXI is not a “set it and forget it” stock. XIAO-I Corporation is a fragile AI name with negative equity, heavy liabilities, and a price that has more than doubled from early October lows before snapping back. That combination creates opportunity for skilled traders, but it also rewards discipline over hope.
For now, the key zones are clear. On the downside, the $2.00–$2.20 band lines up with prior support from earlier in the run. If AIXI cracks and holds below that area, many momentum traders will treat it as a broken chart. On the upside, recent highs in the $3.50–$3.80 range are where late chasers got trapped; any push back into that zone will attract both breakout traders and short sellers looking for another fade.
This is where the Sykes-style mindset matters. As Tim Sykes often says, “Patterns repeat, but your discipline decides whether you capitalize or you get crushed.” As millionaire penny stock trader and teacher Tim Sykes, says, “The goal is not to win every trade but to protect your capital and keep moving forward.”. AIXI is the type of stock he and his community study relentlessly — volatile, crowded, and driven by psychology as much as numbers. Traders who treat XIAO-I Corporation as a fast-moving trading vehicle, not a long-term story, and who cut losses quickly, stand the best chance of surviving the next swing in AIXI’s wild chart. This analysis is for educational and research purposes only and is not investment advice.
This is stock news, not investment advice. Timothy Sykes News delivers real-time stock market news focused on key catalysts driving short-term price movements. Our content is tailored for active traders and investors seeking to capitalize on rapid price fluctuations, particularly in volatile sectors like penny stocks. Readers come to us for detailed coverage on earnings reports, mergers, FDA approvals, new contracts, and unusual trading volumes that can trigger significant short-term price action. Some users utilize our news to explain sudden stock movements, while others rely on it for diligent research into potential investment opportunities.
Dive deeper into the world of trading with Timothy Sykes, renowned for his expertise in penny stocks. Explore his top picks and discover the strategies that have propelled him to success with these articles:
- Penny Stocks Trading Guide
- Best Penny Stocks Under $1 to Buy Today
- Top 8 Penny Stocks to Watch on Robinhood
Once you’ve got some stocks on watch, elevate your trading game with StocksToTrade the ultimate platform for traders. With specialized tools for swing and day trading, StocksToTrade will guide you through the market’s twists and turns.
Dig into StocksToTrade’s watchlists here:





Leave a reply