

SoFi Technologies Inc. stocks have been trading down by -3.45 percent following heightened regulatory scrutiny of its lending practices.
Key Takeaways
- Keefe Bruyette Woods cut its SoFi Technologies price target to $15 from $16 and kept an Underperform rating in place.
- The firm sees fair value accounting, higher rates, and rapid balance sheet growth creating a Q3 headwind of more than $1B for SOFI.
- Analysts expect strong loan growth at SoFi Technologies but warn that capital levels may get squeezed in the process.
- A Form 144 filing shows an insider or large holder plans to sell restricted SOFI shares under SEC Rule 144, adding another sentiment overhang.
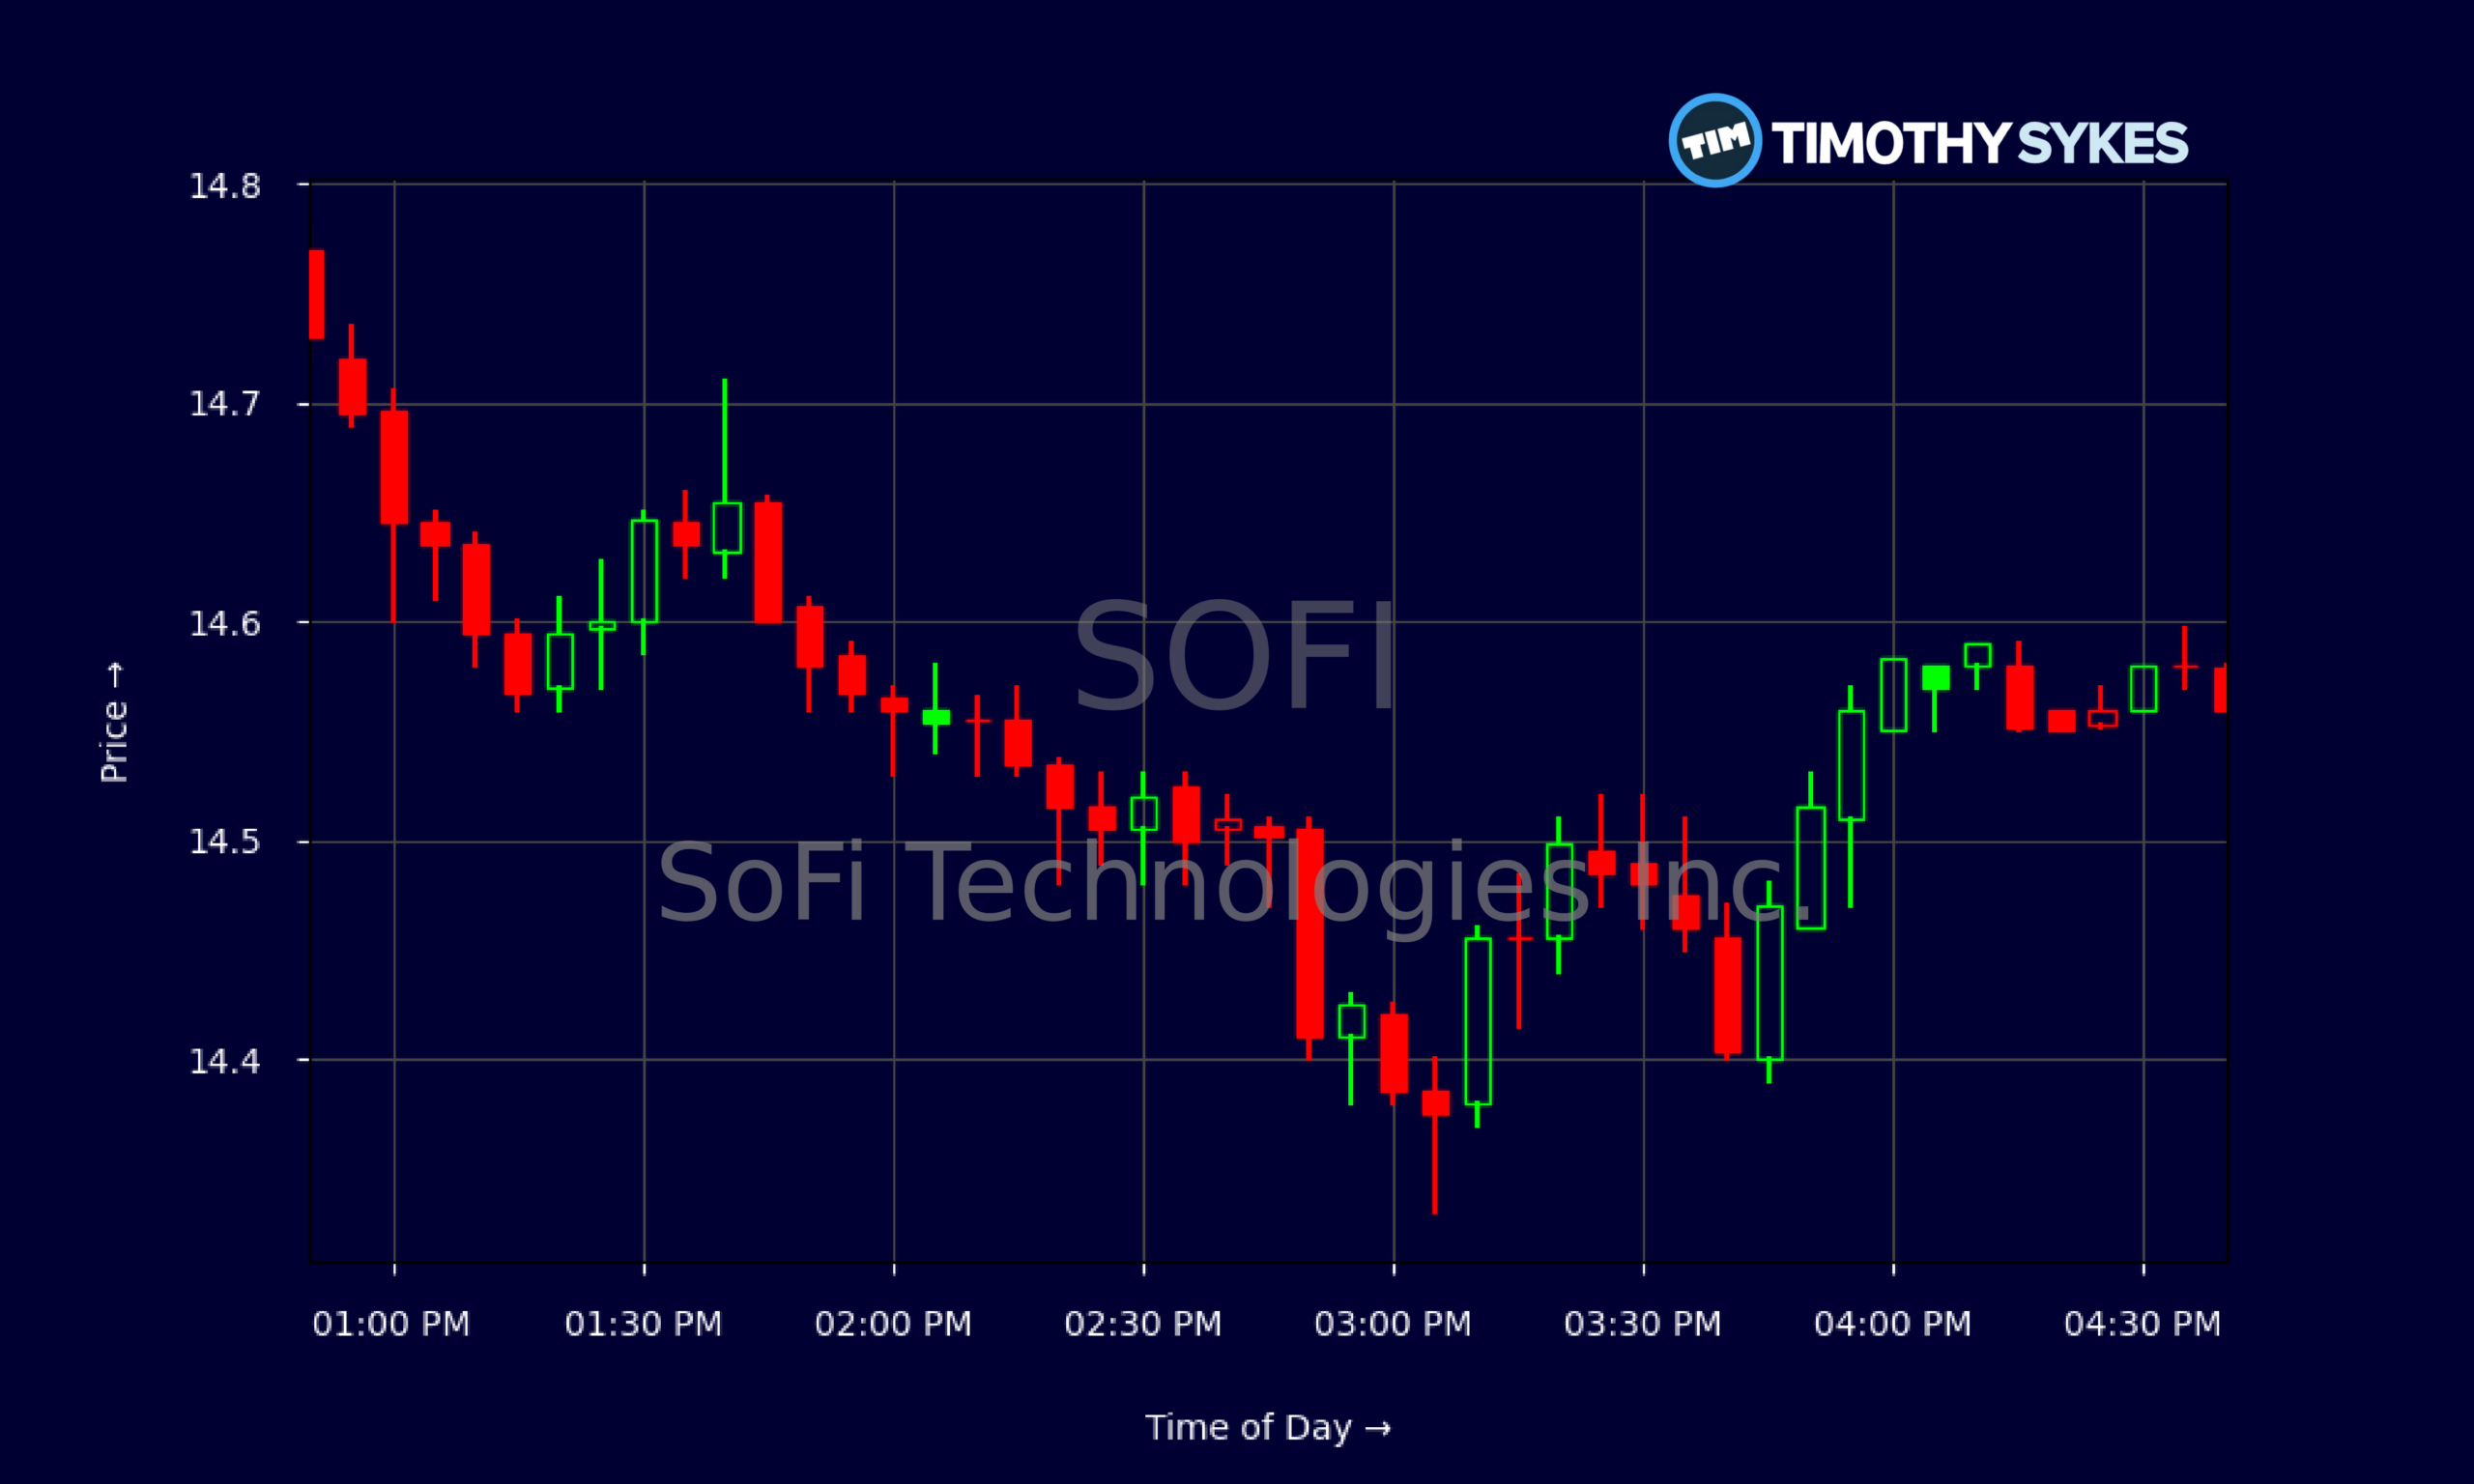
Live Update At 16:47:15 EDT: On Friday, October 16, 2026 SoFi Technologies Inc. stock [NASDAQ: SOFI] is trending down by -3.45%! Discover the key drivers behind this movement as well as our expert analysis in the detailed breakdown below.
Quick Financial Overview
SOFI has been grinding lower from the $17 area in late September to the mid‑$14s now, and the chart tells that story clearly. Over the past few weeks, SoFi Technologies has slipped from a close near $17.16 on 2026/09/22 down to about $14.55 on 2026/10/16. That is a meaningful pullback, and traders need to respect it.
Intraday on the latest session, SOFI opened around $15.06, pushed briefly above $15.50, then faded hard into the close near $14.55. That intraday reversal shows sellers in control and dip buyers getting trapped. Active traders in SOFI should read that as a warning that momentum is shifting.
More Breaking News
Fundamentally, SoFi Technologies is not a tiny story stock. Revenue is roughly $3.61B annually, growing more than 30% per year recently, and SOFI is actually profitable with a profit margin near 15% and a P/E around 32. Debt levels look manageable, with total debt to equity at 0.31 and solid deposits funding the loan book. But SoFi Technologies is highly levered to credit growth, and cash flow remains sharply negative as the company leans into expansion, which keeps SOFI a higher‑risk trading vehicle.
Why Traders Are Watching SOFI Now
SOFI is on a lot of watchlists this week because the narrative just shifted from “growth story” to “show me the capital.” Keefe Bruyette Woods lowered its SoFi Technologies price target from $16 to $15 and reiterated an Underperform call. For short‑term trading, that matters more than the small dollar change suggests.
The firm is flagging a Q3 headwind of more than $1B tied to fair value accounting issues, higher interest rates, and aggressive balance sheet growth. Translation for traders: SoFi Technologies is piling on loans fast, but the mark‑to‑market math and funding costs may eat into capital and earnings quality. SOFI has been rewarded for growth, but now the Street is laser‑focused on how that growth is funded and how volatile those fair value marks might be.
At the same time, a Form 144 from an insider or large holder signals planned selling of restricted or control shares. When a major holder looks to sell, traders in SOFI pay attention. Even if the sale is routine, it adds psychological pressure right when the analyst community is turning more cautious on SoFi Technologies.
Put all of that on top of the recent chart. SOFI failed to hold the $16–$17 range, broke down into the mid‑$15s, and now trades below the freshly cut $15 price target. That combination of technical weakness, analyst pressure, and looming insider supply turns SoFi Technologies into a battleground stock, which is exactly where short‑term traders often find opportunity.
Conclusion
SOFI sits at a key crossroads. On one side, SoFi Technologies is showing real scale: more than $1.21B in quarterly revenue, positive net income of about $157M in the latest report, and return on equity above 7%. Loan growth is strong and deposits are climbing, which gives SoFi Technologies the raw material to keep expanding its digital banking model.
On the other side, traders cannot ignore the red flags. Operating cash flow and free cash flow are deeply negative as SoFi Technologies leans hard into growth. Keefe Bruyette Woods now pegs fair value at $15 and keeps SOFI rated Underperform, highlighting that more than $1B of Q3 headwinds may pressure capital levels. That is not the backdrop swing traders want when the chart already broke support. Add in a Form 144 showing a planned insider or large‑holder sale of SOFI shares, and the near‑term supply picture looks heavier.
For active traders, this is where discipline matters. SOFI can still offer sharp bounces and clean breakdowns, but you need a plan. As Tim Sykes always says, “Cut losses quickly; small losses are manageable, big losses are not.” As millionaire penny stock trader and teacher Tim Sykes, says, “The goal is not to win every trade but to protect your capital and keep moving forward.”. Apply that mindset ruthlessly if you trade SoFi Technologies in this environment. This analysis is for educational and research purposes only and is not investment advice.
This is stock news, not investment advice. Timothy Sykes News delivers real-time stock market news focused on key catalysts driving short-term price movements. Our content is tailored for active traders and investors seeking to capitalize on rapid price fluctuations, particularly in volatile sectors like penny stocks. Readers come to us for detailed coverage on earnings reports, mergers, FDA approvals, new contracts, and unusual trading volumes that can trigger significant short-term price action. Some users utilize our news to explain sudden stock movements, while others rely on it for diligent research into potential investment opportunities.
Dive deeper into the world of trading with Timothy Sykes, renowned for his expertise in penny stocks. Explore his top picks and discover the strategies that have propelled him to success with these articles:
- Penny Stocks Trading Guide
- Best Penny Stocks Under $1 to Buy Today
- Top 8 Penny Stocks to Watch on Robinhood
Once you’ve got some stocks on watch, elevate your trading game with StocksToTrade the ultimate platform for traders. With specialized tools for swing and day trading, StocksToTrade will guide you through the market’s twists and turns.
Dig into StocksToTrade’s watchlists here:





Leave a reply